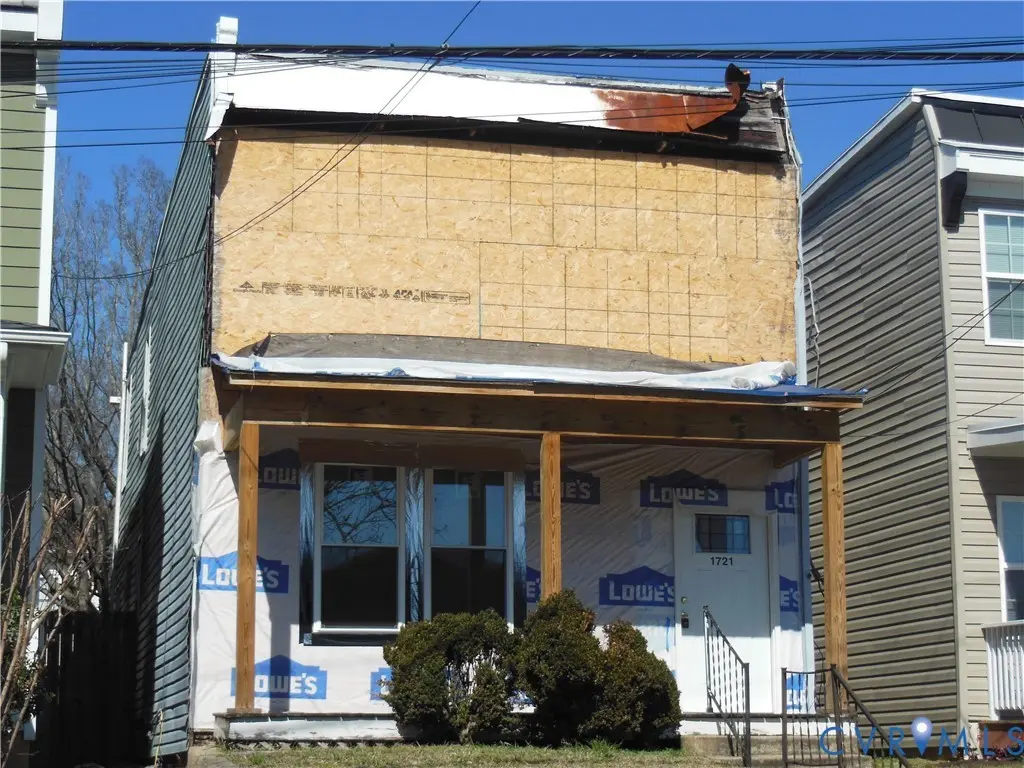
1721 Bainbridge St · Richmond, VA
Flood risk 1/10 · Minimal
- FEMA flood zone
- X (unshaded)
- Chance of flooding over 30 yrs
- 0.0%
- Est. flood insurance / yr
- $507 – $1,088
Fire risk 1/10 · Minimal
- Est. fire insurance / yr
- $666 – $1,236
Heat risk 8/10 · Major
- Hot days now (above 105°F)
- 7 days/yr
- Hot days in 30 yrs
- 16 days/yr
Wind risk 6/10 · Moderate
- Chance of severe wind over 30 yrs
- 27.0%
Air-quality risk 2/10 · Minimal
- Unhealthy air days now
- 1 days/yr
- Unhealthy air days in 30 yrs
- 1 days/yr
Risk factors via First Street. Map © Google.
Why this score? — see what drove the B grade
The composite is a weighted blend of 9 inputs, each scored 0–100. Each bar is that input's sub-score; the figure is the points it added to the 100-point composite (weight × sub-score).
- Cash flow +26.9/30.0
- ARV discount +15.0/15.0
- DSCR +9.3/10.0
- 1% rule +6.8/10.0
- Livability +4.2/5.0
- Rent growth +3.6/5.0
- Schools +3.3/10.0
- Condition / age +2.5/5.0
- Appreciation +0.0/10.0
$185,000
🖨 Deal sheet 📄 Offer letter ✓ Due diligence
Listing remarks MLS
PRICE ADJUSTMENT TO $190,000!!! Welcome to 1721 Bainbridge St in South Richmond. Where new construction projects and single family renovations are occurring in this prime and upcoming area. This listing has undergone initial rehab where the tough work has already been done. It awaits the next owner to complete the transformation. A unique opportunity to customize your new home. For the first 30-days on market, listing is offered under First Look program to owner-occupant buyers. Seller does not have any plans nor permits for renovation. Listing is being sold AS IS. Buyer must do their due diligence for renovation requirements, schools, etc. Purchaser MUST physically view the property prior to making an offer. * * * AGENTS YOU MUST READ "AGENT ONLY COMMENTS" !!!
Key facts
- 2,639 sq ft lot
- Built 1938
- Listed 104 days
Tags
Neighborhood map
What this means for you Summary
Snapshot
- This is a 3-bed/1.5-bath single-family listed at $185k.
Deal economics
- At list price, monthly cash flow is $514 ($6k/yr) — positive.
- The deal already cash-flows at list — no discount required.
- Meets the 1% rule at list price ($2k rent vs $185k).
- Recommended offer: $168k (9.0% below list) — sets the bar for market timing.
- Cap rate 9.6% vs local median 3.3% in Richmond — top-decile yield for the area; either an underpriced asset or a hidden risk that comps aren't pricing in. Stress-test before assuming the spread holds.
Location & tenants
- Location reads 84/100 on livability (#33 in VA, #793 nationally) — a professional / high-income tenant draw. Strengths: amenities A+, commute A+, health & safety A+; Watch: crime D-.
- Richmond City Public School District (urban): math 32% / reading 47% proficiency, ranked #123 of 131 in VA (top 94%) — families likely to look elsewhere, expect single-tenant / working-renter base with shorter leases; 74% free/reduced lunch — lower-income household profile, screen leases tightly.
- Market conditions: Rents rising fast (+4.5%/yr); 173 active listings in the ZIP; 38 comparable units currently listed for rent nearby; rentals leasing fast (median 5d on market — plan ~1-2 weeks tenant-placement turnaround); 2,540 units permitted in Richmond city in 2024 (2,077 in 5+ unit buildings).
- At $2,182/mo this rent would consume 52% of the median local household income ($50k/yr) (locally 3584% of renters already pay >50% of income on rent) — very limited rent-growth headroom before tenants either downsize or default.
Forward outlook
- Local home prices are declining (-3.0%/yr); year-one equity from $1k of loan paydown is wiped out by about $6k of value loss. Plan a longer hold.
- Richmond County population projected at +40% by 2050 — long-run rental-demand tailwind backs the buy-and-hold thesis.
- At projected returns (-3.0% appreciation + 4.5% rent growth), your $52k cash investment doubles in ~9 years — after that, you're playing with house money.
Negotiation context
- It's been on market 104 days — a 9% lower offer ($168k) is reasonable based on typical stale-listing flexibility.
- 6 sale attempts since 2y ago; this cycle's ask has dropped $15k (8%) from the opening price — seller is motivated, your offer sets the floor, not the list.
Risks & watch-outs
- Watch-outs: built in 1938 — expect roof / HVAC / electrical / plumbing capex.
- Climate carrying-cost: major wind risk, 27% chance of damaging wind over 30y; extreme-heat days projected 7→16/yr by 2055 (HVAC capex compounding) — expect insurance premiums to compound above CPI over the hold.
Questions for the listing agent
- It's been on market 104 days. Have you received any prior offers? Is the seller open to a 9% concession, seller financing, or rate buy-down credit?
- Built in 1938 — when were the roof, HVAC, electrical panel, plumbing, and water heater last replaced?
- Why hasn't it sold? Are there any deal-killer items the seller is aware of (foundation, flood, title, zoning, code violations)?
- Is there a deadline driving the sale (1031 exchange, divorce, estate, relocation)? That informs how much negotiation room exists.
- Schools are A-rated — typically a magnet for longer-tenancy family renters. What's the average tenant stay here, and is there a school-zone premium baked into asking?
- Crime grade is D in this area — have there been break-ins, vandalism, or insurance claims at this property in the last 3 years? What carrier currently insures it and at what premium?
- What's the average days-on-market for RENTAL listings here right now (not sales)? A rising rental-DOM trend means longer vacancies and softer asking-rent achievability than the comps imply.
- What's the recent tenant-quality profile in this submarket — average credit score on applications, eviction rate, late-payment / NSF rate, and stable-employment percentage? A property-management company in the area should have these aggregated.
- How much new for-sale + rental construction is in the pipeline within 1–3 miles? Heavy new supply typically softens prices + rents 12–24 months out; constrained supply supports both.
Investment metrics
- 1% rule
- 1.18% ✓
- Cap rate
- 9.62%
- Cash-on-cash
- 11.90%
- DSCR
- 1.53
- GRM
- 7.1
CMA / ARV
- ARV (median comp)
- $249,199
- List price
- $185,000
- Delta
- -25.76%
- Verdict
- UNDERPRICED
- Comps
- 20 within 1.0 mi
Show comp detail 12 sales within ~0.75 mi
| Address | Dist | Beds/Ba | Sqft | Sold | Price | $/sf | Match |
|---|---|---|---|---|---|---|---|
| 1602 Decatur St | 0.21mi | 2/2.0 (-1) | 1,491 (-4%) | 2mo | $324,500 | $218 | 76 |
| 1110 Perry St | 0.37mi | 3/2.0 | 1,503 (-3%) | 2mo | $360,000 | $240 | 74 |
| 307 W 26th St | 0.49mi | 3/1.5 | 1,571 (+2%) | 2mo | $435,000 | $277 | 74 |
| 1800 Maury St | 0.41mi | 3/2.5 | 1,487 (-4%) | 1mo | $285,000 | $192 | 69 |
| 113 E 18th St | 0.20mi | 4/2.0 (+1) | 1,680 (+8%) | 3mo | $210,000 | $125 | 67 |
| 1600 Decatur St St | 0.21mi | 3/2.5 | 1,742 (+12%) | 3mo | $220,000 | $126 | 62 |
| 2019 Dinwiddie Ave | 0.64mi | 3/2.5 | 1,490 (-4%) | 1mo | $340,000 | $228 | 59 |
| 2500 Hargrove St | 0.40mi | 3/2.5 | 1,728 (+12%) | 0mo | $397,500 | $230 | 58 |
| 1606 Chicago Ave | 0.59mi | 3/2.0 | 1,446 (-7%) | 4mo | $298,500 | $206 | 57 |
| 1806 Maury St | 0.41mi | 4/2.5 (+1) | 1,720 (+11%) | 0mo | $300,000 | $174 | 53 |
| 1804 Maury St | 0.41mi | 4/2.5 (+1) | 1,720 (+11%) | 1mo | $300,000 | $174 | 53 |
| 2118 Chicago Ave | 0.63mi | 3/2.5 | 1,678 (+8%) | 1mo | $305,000 | $182 | 52 |
Match score weights: distance 35% · size 25% · config 20% · recency 20%. Top-matched comps best support the ARV.
Projected returns pro-forma
-3.0% appreciation · 4.55% rent growth · sell at horizon
- IRR
- 3.0%
- Equity multiple
- 1.12×
- Total profit
- $6,183
- Equity at exit
- $27,584
- IRR
- 14.0%
- Equity multiple
- 2.20×
- Total profit
- $62,107
- Equity at exit
- $15,995
Cash invested: $51,800 (down + closing). Projections, not guarantees.
Landlord ↔ Tenant lean methodology
- Overall (STATE)
- 55 Moderately Landlord-Leaning
- State Virginia
- 55 Moderately Landlord-Leaning · D+2
- County
- — inherits STATE
- City
- — inherits STATE
ZIP-level market 23224
- Rents YoY
- 4.5%
- Active inventory
- 173
- Price-to-rent
- 7.1×
Monthly cashflow live
- Estimated rent
- $2,182 high interval (Pro) →
- Mortgage (P&I)
- −$970
- Tax from tax record
- −$163 /mo · $1,956/yr
- Insurance
- −$77
- HOA
- −$0
- Vacancy / Maint / Mgmt
- −$458
- Net cashflow
- $514
Break-even live
UW: 25.0% down · 7.5% · 30yr · 1.5% tax · 5.0% vac · 8.0% maint · 8.0% mgmt
Financing live
Cash to close
- Down payment
- $46,250
- Closing costs
- $5,550
- Reserves months
- —
- Total cash needed
- —
Loan-product check · same deal, 3 products live
Conventional
25% down · 7.5% · 30yr
- Down + closing
- —
- Monthly P&I
- —
- Monthly cashflow
- —
- DSCR
- —
- Eligible?
- —
Personal DTI + credit; lowest rate.
DSCR
20% down · 8.5% · 30yr
- Down + closing
- —
- Monthly P&I
- —
- Monthly cashflow
- —
- DSCR
- —
- Eligible?
- —
No personal income docs; deal must DSCR.
Hard money
10% down · 12.0% · 12mo
- Down + closing
- —
- Monthly P&I
- —
- Monthly cashflow
- —
- DSCR
- —
- Eligible?
- —
Short-term bridge; refi at stabilization.
Rent comps 38 comps
| Address | Beds | Baths | Sqft | Rent | $/sqft | DOM | Units | Dist |
|---|---|---|---|---|---|---|---|---|
| 1912 Porter St Richmond, VA | 3.0 | 1.5 | 1415 | $1,950 | $1.38 | 23d | 1 | 0.09mi |
| 1529 Porter St Unit A Richmond, VA | 3.0 | 2.5 | 1711 | $2,400 | $1.40 | 23d | 1 | 0.10mi |
| 201 Cowardin Ave Unit B Richmond, VA | 2.0 | 2.5 | 1436 | $2,200 | $1.53 | 43d | 1 | 0.10mi |
| 1422 Bainbridge St Richmond, VA | 2.0 | 2.0 | 1121 | $2,399 | $2.14 | 2d | 1 | 0.17mi |
| 1411 Porter St Unit B Richmond, VA | 3.0 | 3.0 | 1500 | $2,145 | $1.43 | 4d | 1 | 0.20mi |
| 107 E 16th St Richmond, VA | 4.0 | 2.5 | 1608 | $2,350 | $1.46 | 10d | 1 | 0.22mi |
| 2117 Old Manchester St Richmond, VA | 3.0 | 4.0 | 1960 | $2,695 | $1.38 | 10d | 1 | 0.25mi |
| 1429 McDonough St Richmond, VA | 1.0–3.0 | 1.0–2.0 | 826 | $2,469 | $2.99 | 2d | 15 | 0.27mi |
| 116 E 15th St Richmond, VA | 4.0 | 2.0 | 1452 | $2,250 | $1.55 | 23d | 1 | 0.27mi |
| 2104 Boro Ridge St Richmond, VA | 3.0 | 2.5 | 1916 | $2,775 | $1.45 | 43d | 1 | 0.28mi |
| 1709 Everett St Richmond, VA | 4.0 | 1.5 | 1460 | $1,995 | $1.37 | 43d | 1 | 0.31mi |
| 1719 Everett St Richmond, VA | 3.0 | 2.5 | 1748 | $2,255 | $1.29 | 43d | 1 | 0.31mi |
| 1212 Porter St Unit B Richmond, VA | 3.0 | 2.5 | 1837 | $2,300 | $1.25 | 43d | 1 | 0.31mi |
| 1211 Porter St Richmond, VA | 3.0 | 3.0 | 1571 | $2,495 | $1.59 | 19d | 1 | 0.31mi |
| 2522 Porter St Richmond, VA | 3.0 | 2.5 | 1390 | $1,800 | $1.29 | 43d | 1 | 0.45mi |
| 901 McDonough St Richmond, VA | 1.0–2.0 | 1.0–2.0 | 886 | $2,037 | $2.30 | 3d | 14 | 0.54mi |
| 815 Perry St Richmond, VA | 1.0–3.0 | 1.0–2.0 | 1004 | $1,800 | $1.79 | 1d | 10 | 0.55mi |
| 800 Semmes Ave Richmond, VA | 1.0–2.0 | 1.0–2.0 | 760 | $2,575 | $3.39 | 3d | 23 | 0.57mi |
| 2708 Semmes Ave Unit A Richmond, VA | 2.0 | 1.0 | 1050 | $1,275 | $1.21 | 43d | 1 | 0.63mi |
| 15 W 7th St Richmond, VA | 1.0–3.0 | 1.0–2.5 | 881 | $3,031 | $3.44 | 2d | 6 | 0.64mi |
| 700 Stockton St Richmond, VA | 1.0–2.0 | 1.0 | 1035 | $1,805 | $1.74 | 1d | 31 | 0.65mi |
| 84 W 6th St Richmond, VA | 3.0 | 2.0 | 1493 | $2,715 | $1.82 | 3d | 1 | 0.67mi |
| 700 Everett St Richmond, VA | 1.0–2.0 | 1.0–2.0 | 809 | $1,849 | $2.28 | 4d | 14 | 0.71mi |
| 403 Stockton St Richmond, VA | 1.0–3.0 | 1.0–2.0 | 882 | $2,140 | $2.42 | 3d | 22 | 0.79mi |
| 307 Stockton St Richmond, VA | 1.0–2.0 | 1.0–2.0 | 853 | $1,722 | $2.02 | 1d | 27 | 0.85mi |
| 1112 E 16th St Richmond, VA | 4.0 | 1.0 | 1206 | $1,595 | $1.32 | 43d | 1 | 0.89mi |
| 103 E 2nd St Richmond, VA | 2.0 | 1.0–2.0 | 820 | $2,340 | $2.85 | 2d | 18 | 0.91mi |
| 1100 Richmond Hwy Richmond, VA | 1.0–3.0 | 1.0–2.0 | 1062 | $2,345 | $2.21 | 1d | 16 | 0.96mi |
| 3 E Blake Ln Richmond, VA | 3.0 | 1.5 | 2065 | $2,000 | $0.97 | 3d | 1 | 1.02mi |
| 3154 Stockton St Richmond, VA | 3.0 | 1.0 | 1169 | $1,600 | $1.37 | 43d | 1 | 1.16mi |
| 3300 Midlothian Tpke Richmond, VA | 2.0 | 1.0 | 1116 | $1,800 | $1.61 | 4d | 1 | 1.18mi |
| 1101 Haxall Pt #1014 Richmond, VA | 2.0 | 2.0 | 1243 | $4,200 | $3.38 | 43d | 1 | 1.22mi |
| 615 S Laurel St Richmond, VA | 4.0 | 3.0 | 2110 | $3,500 | $1.66 | 23d | 1 | 1.25mi |
| 3314 Decatur St Richmond, VA | 2.0 | 1.5 | 1640 | $1,800 | $1.10 | 43d | 1 | 1.28mi |
| 513 S Laurel St Richmond, VA | 4.0 | 2.5 | 1650 | $3,000 | $1.82 | 3d | 1 | 1.34mi |
| 117 S 14th St Richmond, VA | 2.0 | 1.0–2.0 | 944 | $2,333 | $2.47 | 2d | 19 | 1.41mi |
| 100 S 15th St Richmond, VA | 1.0–2.0 | 1.0–2.0 | 825 | $1,749 | $2.12 | 4d | 4 | 1.44mi |
| 823 E Main St Richmond, VA | 3.0 | 1.0–2.5 | 1178 | $2,687 | $2.28 | 1d | 14 | 1.49mi |
Listing history 24 events
-
2026-06-13statusdays on market $185,000 Pending 104 DOM
-
2026-06-10days on market $185,000 Active 102 DOM
-
2026-06-09days on market $185,000 Active 101 DOM
-
2026-06-08days on market $185,000 Active 100 DOM
-
2026-06-07days on market $185,000 Active 99 DOM
-
2026-06-03days on market $185,000 Active 95 DOM
-
2026-06-02days on market $185,000 Active 94 DOM
-
2026-06-01days on market $185,000 Active 93 DOM
-
2026-05-31days on market $185,000 Active 92 DOM
-
2026-04-17price $190,000 783-char remark
Show marketing remark (783 chars)
PRICE ADJUSTMENT TO $190,000!!! Welcome to 1721 Bainbridge St in South Richmond. Where new construction projects and single family renovations are occurring in this prime and upcoming area. This listing has undergone initial rehab where the tough work has already been done. It awaits the next owner to complete the transformation. A unique opportunity to customize your new home. For the first 30-days on market, listing is offered under First Look program to owner-occupant buyers. Seller does not have any plans nor permits for renovation. Listing is being sold AS IS. Buyer must do their due diligence for renovation requirements, schools, etc. Purchaser MUST physically view the property prior to making an offer. * * * AGENTS YOU MUST READ "AGENT ONLY COMMENTS" !!!
-
2026-02-26$200,000 Active 783-char remark
Show marketing remark (783 chars)
PRICE ADJUSTMENT TO $190,000!!! Welcome to 1721 Bainbridge St in South Richmond. Where new construction projects and single family renovations are occurring in this prime and upcoming area. This listing has undergone initial rehab where the tough work has already been done. It awaits the next owner to complete the transformation. A unique opportunity to customize your new home. For the first 30-days on market, listing is offered under First Look program to owner-occupant buyers. Seller does not have any plans nor permits for renovation. Listing is being sold AS IS. Buyer must do their due diligence for renovation requirements, schools, etc. Purchaser MUST physically view the property prior to making an offer. * * * AGENTS YOU MUST READ "AGENT ONLY COMMENTS" !!!
-
2025-09-30historical
-
2025-06-17price $195,000
-
2025-06-10status Active
-
2025-05-27status Pending
-
2025-05-09price $215,000
-
2025-04-29status Active
-
2025-04-17status Pending
-
2025-03-25price $220,000
-
2025-03-12$255,000 Active
-
2024-04-03historical
-
2024-03-25status Active
-
2024-02-08status Pending
-
2024-01-25$187,000 Active
ⓘ Source: listings_history table (triggers on properties + properties_extension) + one-shot
backfill from property_details.listing_events for pre-trigger history.
Tax reassessment forecast VA · Resets to sale price
- Current annual tax
- $1,956 · $163/mo
- Projected year-2 tax
- $1,956 · $163/mo
- Expected delta
- $0/yr ($0/mo · 0.0%)
ⓘ Screening estimate from a state-policy table — verify with the county assessor before closing.
Climate risk First Street
- Flood 1/10 Low FEMA zone X (unshaded) · 0% chance over 30 yrs
- Wildfire 1/10 Low
- Heat 8/10 Severe 7 d/yr ≥105°F today · 16 d/yr by 30 yrs out
- Wind 6/10 Major 27% chance of damaging wind over 30 yrs
- Air quality 2/10 Low 1 unhealthy d/yr today · 1 by 30 yrs out
Nearby sold comps map
Loading sold comps map…
Walkable amenities ~0.75 mi
Loading nearby amenities…
Taxation est. · year 1
- Rental income
- $26,186
- − Mortgage interest
- −$10,363
- − Property taxes
- −$1,956
- − Insurance
- −$925
- − Repairs & maintenance
- −$2,095
- − Management
- −$2,095
- − Depreciation
- −$5,382
- Taxable income
- $3,370
- Est. tax owed @ 24.0%
- −$809
- After-tax cash flow
- $5,355/yr
For passive investors: Depreciation is non-cash, so a rental often shows a tax loss while cash-flowing — sheltering income. Rental losses are passive: they offset passive income freely, and up to $25,000/yr can offset ordinary (W-2) income if you actively participate and your MAGI is under $100k (phasing out to $0 by $150k); unused losses carry forward. On sale, claimed depreciation is recaptured at up to 25%, and gains may owe capital-gains tax (a 1031 exchange can defer both). Figures are a year-1 estimate at your 24.0% rate — not tax advice; consult a CPA.
Schools (NCES district)
- District
- Richmond City Public School District
- NCES district ID
- 5103240
- Math proficiency
- 32% ▼ -24.00%
- Reading proficiency
- 47% ▼ -9.00%
- Median HH income
- $40,276
- Composite
- 33.09/100
- National rank
- #5564
- State rank
- #123 of 131 in VA
Livability — Richmond
- Score
- 84/100
- State rank
- #33
- US rank
- #793
Category grades
Schools grade is shown separately in the Schools card above.
Census & demographics
- Census place
- Richmond, VA
- County
- Richmond City · 178,280 people
- City population
- 287,109
- Metro
- Richmond, VA
- Population (ZIP)
- 40,575
- Household income
- $50,475
- Rent vs Own
- Severe rent burden
- 3584.0
Population outlook (Richmond County) Hauer SSP2
- Today (2025)
- 262,263 people
- By 2030
- 284,503 · +8.5%
- By 2040
- 327,353 · +24.8%
- By 2050
- 367,946 · +40.3%
- By 2075
- 449,560 · +71.4%
- By 2100
- 500,301 · +90.8%
Race, ethnicity, and origin ACS 2023
- Neighborhood character
- Diverse neighborhood (Simpson 0.58)
- Race & ethnicity
- Black 59% Hispanic / Latino 22% White 15% Two or more races 6%
- Hispanic origin (detail)
- Mexican 5% Puerto Rican 2%
- Common ancestry
- Romanian 1% Lithuanian 1% Serbian 1%
- Foreign-born
- 17% · Canada
- Languages at home
- 78% English-only · Spanish 19% French/Haitian/Cajun 1%
Political lean MEDSL · Richmond
- 2024 margin
- Solid D (+66.3) · D 82.0% · R 15.8% · Other 2.2%
- 2008→2024 swing
- +7.2pp toward D · 2008: 59.1pp · 2024: 66.3pp
- All cycles
- 2024: D+66.3 2020: D+68.0 2016: D+63.8 2012: D+55.7 2008: D+59.1
Not yet ingested
- Civics
- —
Market trends
- HPI YoY
- ▼ -283.99%
- Current HPI
- 336.9345
- Rent YoY
- ▲ 4.55%
- Metro
- Richmond, VA
- State GDP YoY
- ▲ 2.40%
- F500 in state
- 50
Industry mix (Fortune 500 HQ in VA)
| Industry | F500 HQs | Revenue |
|---|---|---|
| Aerospace / Defense | 4 | $236B |
|
||
| Technology / Defense | 3 | $32B |
|
||
| Financial Services | 2 | $176B |
|
||
| Utilities | 2 | $27B |
|
||
| Insurance | 2 | $25B |
|
||
| Technology | 2 | $15B |
|
||
Price history
+1.6% since first listed15 events — show timeline
- 2026-04-17 Price Changed $190,000 CVRMLS
- 2026-02-26 Listed $200,000 CVRMLS
- 2025-09-30 Listing Removed — CVRMLS
- 2025-06-17 Price Changed $195,000 CVRMLS
- 2025-06-10 Relisted — CVRMLS
- 2025-05-27 Pending — CVRMLS
- 2025-05-09 Price Changed $215,000 CVRMLS
- 2025-04-29 Relisted — CVRMLS
- 2025-04-17 Pending — CVRMLS
- 2025-03-25 Price Changed $220,000 CVRMLS
- 2025-03-12 Listed $255,000 CVRMLS
- 2024-04-03 Listing Removed — CVRMLS
- 2024-03-25 Relisted — CVRMLS
- 2024-02-08 Pending — CVRMLS
- 2024-01-25 Listed $187,000 CVRMLS
Property tax history
+4.4%/yrLatest (2022): $1,956 · +41.7% YoY. Source: county tax records.
Cash-flow waterfall
monthlySold comps — $/sqft
last 12 mo · ≤1 miLoading sold comps…