 Triplex
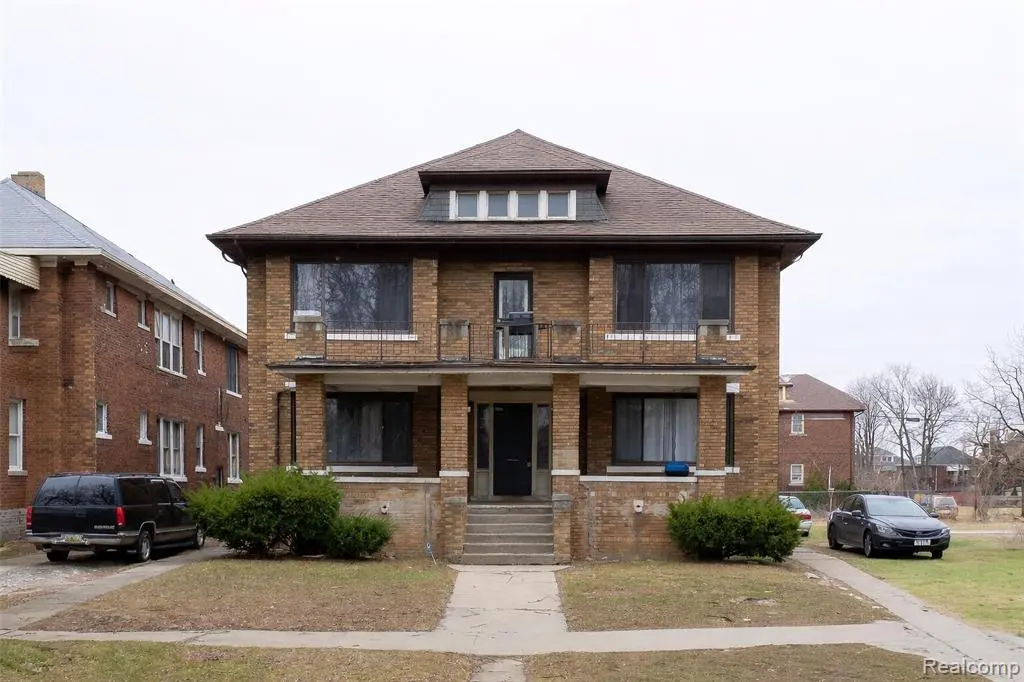
2675 Richton St · Detroit, MI
Flood risk 1/10 · Minimal
- FEMA flood zone
- X (unshaded)
- Chance of flooding over 30 yrs
- 0.0%
- Est. flood insurance / yr
- $473 – $860
Fire risk 1/10 · Minimal
- Est. fire insurance / yr
- $784 – $1,456
Heat risk 3/10 · Minor
- Hot days now (above 97°F)
- 7 days/yr
- Hot days in 30 yrs
- 15 days/yr
Wind risk 2/10 · Minimal
- Chance of severe wind over 30 yrs
- —
Air-quality risk 4/10 · Minor
- Unhealthy air days now
- 4 days/yr
- Unhealthy air days in 30 yrs
- 6 days/yr
Risk factors via First Street. Map © Google.
Why this score? — see what drove the C grade
The composite is a weighted blend of 9 inputs, each scored 0–100. Each bar is that input's sub-score; the figure is the points it added to the 100-point composite (weight × sub-score).
- Cash flow +27.9/30.0
- DSCR +9.9/10.0
- 1% rule +7.6/10.0
- Rent growth +3.8/5.0
- Condition / age +3.8/5.0
- Livability +3.7/5.0
- Schools +1.3/10.0
- ARV discount +1.0/15.0
- Appreciation +0.0/10.0
$340,000
🖨 Deal sheet 📄 Offer letter ✓ Due diligence
Multi-family units
County records classify this as Multi-Family (2-4 Unit). Listing-text estimate: 3 units. confirmed
Listing remarks MLS
Turnkey investment opportunity situated in the highly desirable Boston-Edison Historic District. This beautifully renovated property is fully occupied and producing $4,600 per month in rental income, offering immediate cash flow for investors seeking a stable addition to their portfolio. Extensive updates have been completed throughout the home, blending modern finishes with the timeless character that defines this historic neighborhood. Located in one of Detroit's most prominent and steadily revitalizing areas, the property provides convenient access to major employment hubs and some of the city's most recognized destinations. Residents enjoy close proximity to the Motown Museum, Henry Ford Hospital, and the vibrant shops, restaurants, and entertainment options along the Woodward Avenue corridor. The neighborhood is known for its stunning historic homes, mature tree-lined streets, and ongoing investment that continues to strengthen property values and tenant demand. With reliable rental income already established and a prime location within one of Detroit's most notable historic communities, this property presents an exceptional opportunity for investors focused on both strong cash flow and long-term appreciation potential.
Key facts
- Henry ford hospital
- Convenient access
- Modern finishes
Tags
Neighborhood map
What this means for you Summary
Snapshot
- This is a 3 × 3-bed/1.7-bath units multifamily listed at $340k. Condition is rated good.
Deal economics
- At list price, monthly cash flow is $1k ($13k/yr) — positive. Per door: $349/mo.
- The deal already cash-flows at list — no discount required.
- Meets the 1% rule at list price ($4k rent vs $340k).
- Recommended offer: $335k (1.5% below list) — sets the bar for market timing.
Location & tenants
- Location reads 73/100 on livability (#218 in MI) — a middle-class / working-renter tenant base. Strengths: amenities A+, commute A+, cost of living A+; Watch: schools F, crime F, employment F.
- Detroit Public Schools Community District (urban): math 10% / reading 24% proficiency, ranked #499 of 540 in MI (top 92%) — low school quality limits family demand, transient renter base, plan for 1-2y turnover; 90% free/reduced lunch — lower-income household profile, screen leases tightly.
- Market conditions: Rents rising fast (+5.2%/yr); 271 active listings in the ZIP; 2,639 units permitted in Wayne County in 2024 (1,216 in 5+ unit buildings).
- At $4,299/mo this rent would consume 115% of the median local household income ($45k/yr) (locally 646% of renters already pay >50% of income on rent) — very limited rent-growth headroom before tenants either downsize or default.
Forward outlook
- Local home prices are declining (-3.0%/yr); year-one equity from $2k of loan paydown is wiped out by about $10k of value loss. Plan a longer hold.
- Wayne County population projected at -17% by 2050 — secular population decline; favor cash flow + early exit over multi-decade hold.
- At projected returns (-3.0% appreciation + 5.2% rent growth), your $95k cash investment doubles in ~8 years — after that, you're playing with house money.
Negotiation context
- It's been on market 26 days — a 2% lower offer ($335k) is reasonable based on typical stale-listing flexibility.
- 2 sale attempts with the ask held roughly flat each time — persistent listings suggest the price (not the market) is what's stuck; bring a comps-based counter.
Risks & watch-outs
- Watch-outs: built in 1924 — expect roof / HVAC / electrical / plumbing capex.
Questions for the listing agent
- Can we see the unit-by-unit rent roll, current vacancy, and any below-market leases? What's the average tenancy length?
- What capital expenditures (roof, boiler, parking lot, exteriors) have been made in the last 5 years, and what's planned in the next 2?
- Built in 1924 — when were the roof, HVAC, electrical panel, plumbing, and water heater last replaced?
- Is there a deadline driving the sale (1031 exchange, divorce, estate, relocation)? That informs how much negotiation room exists.
- Schools are F-rated, which usually means shorter tenancies and higher turnover. Who's the typical renter profile here, and what's been the actual vacancy rate?
- Crime grade is F in this area — have there been break-ins, vandalism, or insurance claims at this property in the last 3 years? What carrier currently insures it and at what premium?
- What's the average days-on-market for RENTAL listings here right now (not sales)? A rising rental-DOM trend means longer vacancies and softer asking-rent achievability than the comps imply.
- What's the recent tenant-quality profile in this submarket — average credit score on applications, eviction rate, late-payment / NSF rate, and stable-employment percentage? A property-management company in the area should have these aggregated.
- How much new apartment / multifamily construction is in the pipeline within 1–3 miles? Heavy new supply (>2% of stock underway) typically softens rents 12–24 months out; light construction supports rent growth.
Investment metrics
- 1% rule
- 1.26% ✓
- Cap rate
- 9.99%
- Cash-on-cash
- 13.19%
- DSCR
- 1.59
- GRM
- 6.6
CMA / ARV
- ARV (on-the-fly)
- $297,070
- Comps found
- 7
Show comp detail 7 sales within ~0.75 mi
| Address | Dist | Beds/Ba | Sqft | Sold | Price | $/sf | Match |
|---|---|---|---|---|---|---|---|
| 2675 Richton St | 0.00mi | 8/5.0 (-1) | 4,870 (0%) | 0mo | $310,000 | $64 | 94 |
| 2683 Sturtevant St | 0.13mi | 8/5.0 (-1) | 4,876 (+0%) | 8mo | $200,000 | $41 | 82 |
| 3224 Monterey St | 0.26mi | 8/6.0 (-1) | 4,880 (+0%) | 20mo | $300,000 | $61 | 62 |
| 2676 Sturtevant St | 0.16mi | 8/4.5 (-1) | 4,308 (-12%) | 9mo | $152,500 | $35 | 58 |
| 2310 Glendale St | 0.46mi | 8/4.5 (-1) | 4,158 (-15%) | 8mo | $199,900 | $48 | 40 |
| 2296 W Buena Vista St | 0.52mi | 8/4.0 (-1) | 4,184 (-14%) | 21mo | $299,000 | $71 | 26 |
| 2945 W Grand St | 0.67mi | 8/4.0 (-1) | 4,144 (-15%) | 14mo | $306,000 | $74 | 23 |
Match score weights: distance 35% · size 25% · config 20% · recency 20%. Top-matched comps best support the ARV.
Projected returns pro-forma
-3.0% appreciation · 5.2% rent growth · sell at horizon
- IRR
- 5.6%
- Equity multiple
- 1.22×
- Total profit
- $21,350
- Equity at exit
- $50,695
- IRR
- 17.0%
- Equity multiple
- 2.54×
- Total profit
- $146,428
- Equity at exit
- $29,397
Cash invested: $95,200 (down + closing). Projections, not guarantees.
Landlord ↔ Tenant lean methodology
- Overall (STATE)
- 62 Landlord-Friendly
- State Michigan
- 62 Landlord-Friendly · EVEN
- County
- — inherits STATE
- City
- — inherits STATE
ZIP-level market 48206
- Rents YoY
- 5.2%
- Active inventory
- 271
- Price-to-rent
- 19.8×
Monthly cashflow live
- Estimated rent
- $4,299 high interval (Pro) →
- Mortgage (P&I)
- −$1,783
- Tax est. 1.5%
- −$425 /mo · $5,100/yr
- Insurance
- −$142
- HOA
- −$0
- Vacancy / Maint / Mgmt
- −$903
- Net cashflow
- $1,047
Break-even live
3-unit breakdown (identical units grouped — click to expand)
| Units | Beds | Baths | Est. rent |
|---|---|---|---|
| 3× units | 3 | 1.7 | $4,299 |
| #1 | 3 | 1.7 | $1,433 |
| #2 | 3 | 1.7 | $1,433 |
| #3 | 3 | 1.7 | $1,433 |
| Total (3 units) | $4,299 | ||
UW: 25.0% down · 7.5% · 30yr · 1.5% tax · 5.0% vac · 8.0% maint · 8.0% mgmt
Financing live
Cash to close
- Down payment
- $85,000
- Closing costs
- $10,200
- Reserves months
- —
- Total cash needed
- —
Loan-product check · same deal, 3 products live
Conventional
25% down · 7.5% · 30yr
- Down + closing
- —
- Monthly P&I
- —
- Monthly cashflow
- —
- DSCR
- —
- Eligible?
- —
Personal DTI + credit; lowest rate.
DSCR
20% down · 8.5% · 30yr
- Down + closing
- —
- Monthly P&I
- —
- Monthly cashflow
- —
- DSCR
- —
- Eligible?
- —
No personal income docs; deal must DSCR.
Hard money
10% down · 12.0% · 12mo
- Down + closing
- —
- Monthly P&I
- —
- Monthly cashflow
- —
- DSCR
- —
- Eligible?
- —
Short-term bridge; refi at stabilization.
Listing history 4 events
-
2026-04-18status Pending 1244-char remark
Show marketing remark (1244 chars)
Turnkey investment opportunity situated in the highly desirable Boston-Edison Historic District. This beautifully renovated property is fully occupied and producing $4,600 per month in rental income, offering immediate cash flow for investors seeking a stable addition to their portfolio. Extensive updates have been completed throughout the home, blending modern finishes with the timeless character that defines this historic neighborhood. Located in one of Detroit's most prominent and steadily revitalizing areas, the property provides convenient access to major employment hubs and some of the city's most recognized destinations. Residents enjoy close proximity to the Motown Museum, Henry Ford Hospital, and the vibrant shops, restaurants, and entertainment options along the Woodward Avenue corridor. The neighborhood is known for its stunning historic homes, mature tree-lined streets, and ongoing investment that continues to strengthen property values and tenant demand. With reliable rental income already established and a prime location within one of Detroit's most notable historic communities, this property presents an exceptional opportunity for investors focused on both strong cash flow and long-term appreciation potential.
-
2026-04-18status Pending
Show marketing remark (1244 chars)
Turnkey investment opportunity situated in the highly desirable Boston-Edison Historic District. This beautifully renovated property is fully occupied and producing $4,600 per month in rental income, offering immediate cash flow for investors seeking a stable addition to their portfolio. Extensive updates have been completed throughout the home, blending modern finishes with the timeless character that defines this historic neighborhood. Located in one of Detroit's most prominent and steadily revitalizing areas, the property provides convenient access to major employment hubs and some of the city's most recognized destinations. Residents enjoy close proximity to the Motown Museum, Henry Ford Hospital, and the vibrant shops, restaurants, and entertainment options along the Woodward Avenue corridor. The neighborhood is known for its stunning historic homes, mature tree-lined streets, and ongoing investment that continues to strengthen property values and tenant demand. With reliable rental income already established and a prime location within one of Detroit's most notable historic communities, this property presents an exceptional opportunity for investors focused on both strong cash flow and long-term appreciation potential.
-
2026-03-23$340,000 Active
Show marketing remark (1244 chars)
Turnkey investment opportunity situated in the highly desirable Boston-Edison Historic District. This beautifully renovated property is fully occupied and producing $4,600 per month in rental income, offering immediate cash flow for investors seeking a stable addition to their portfolio. Extensive updates have been completed throughout the home, blending modern finishes with the timeless character that defines this historic neighborhood. Located in one of Detroit's most prominent and steadily revitalizing areas, the property provides convenient access to major employment hubs and some of the city's most recognized destinations. Residents enjoy close proximity to the Motown Museum, Henry Ford Hospital, and the vibrant shops, restaurants, and entertainment options along the Woodward Avenue corridor. The neighborhood is known for its stunning historic homes, mature tree-lined streets, and ongoing investment that continues to strengthen property values and tenant demand. With reliable rental income already established and a prime location within one of Detroit's most notable historic communities, this property presents an exceptional opportunity for investors focused on both strong cash flow and long-term appreciation potential.
-
2026-03-23$340,000 Active 1244-char remark
Show marketing remark (1244 chars)
Turnkey investment opportunity situated in the highly desirable Boston-Edison Historic District. This beautifully renovated property is fully occupied and producing $4,600 per month in rental income, offering immediate cash flow for investors seeking a stable addition to their portfolio. Extensive updates have been completed throughout the home, blending modern finishes with the timeless character that defines this historic neighborhood. Located in one of Detroit's most prominent and steadily revitalizing areas, the property provides convenient access to major employment hubs and some of the city's most recognized destinations. Residents enjoy close proximity to the Motown Museum, Henry Ford Hospital, and the vibrant shops, restaurants, and entertainment options along the Woodward Avenue corridor. The neighborhood is known for its stunning historic homes, mature tree-lined streets, and ongoing investment that continues to strengthen property values and tenant demand. With reliable rental income already established and a prime location within one of Detroit's most notable historic communities, this property presents an exceptional opportunity for investors focused on both strong cash flow and long-term appreciation potential.
ⓘ Source: listings_history table (triggers on properties + properties_extension) + one-shot
backfill from property_details.listing_events for pre-trigger history.
Climate risk First Street
- Flood 1/10 Low FEMA zone X (unshaded) · 0% chance over 30 yrs
- Wildfire 1/10 Low
- Heat 3/10 Moderate 7 d/yr ≥97°F today · 15 d/yr by 30 yrs out
- Wind 2/10 Low
- Air quality 4/10 Moderate 4 unhealthy d/yr today · 6 by 30 yrs out
Nearby sold comps map
Loading sold comps map…
Walkable amenities ~0.75 mi
Loading nearby amenities…
Taxation est. · year 1
- Rental income
- $51,588
- − Mortgage interest
- −$19,045
- − Property taxes
- −$5,100
- − Insurance
- −$1,700
- − Repairs & maintenance
- −$4,127
- − Management
- −$4,127
- − Depreciation
- −$9,891
- Taxable income
- $7,598
- Est. tax owed @ 24.0%
- −$1,823
- After-tax cash flow
- $10,735/yr
For passive investors: Depreciation is non-cash, so a rental often shows a tax loss while cash-flowing — sheltering income. Rental losses are passive: they offset passive income freely, and up to $25,000/yr can offset ordinary (W-2) income if you actively participate and your MAGI is under $100k (phasing out to $0 by $150k); unused losses carry forward. On sale, claimed depreciation is recaptured at up to 25%, and gains may owe capital-gains tax (a 1031 exchange can defer both). Figures are a year-1 estimate at your 24.0% rate — not tax advice; consult a CPA.
Condition & rehab AI · 14 photos
This multi-family property in the Boston-Edison Historic District is in good condition with modern updates and a well-maintained exterior. It's a turnkey investment opportunity with immediate rental income and potential for further value increases through exterior painting and landscaping.
Value-add opportunities
- Both Painting the exterior brick facade — Enhances curb appeal and can increase both resale and rental value.
- Both Landscaping improvements — A well-maintained yard can increase both resale and rental value.
Renovation cost estimate screening
Value-add ROI direction
- Both Painting the exterior brick facade — Enhances curb appeal and can increase both resale and rental value. ↑
- Both Landscaping improvements — A well-maintained yard can increase both resale and rental value. ↑
ⓘ Cost ranges are severity-bucket heuristics (US national rule-of-thumb). Get contractor quotes + a written scope before underwriting a rehab budget.
Schools (NCES district)
- District
- Detroit Public Schools Community District
- NCES district ID
- 2601103
- Math proficiency
- 10% ▼ -2.00%
- Reading proficiency
- 24% ▲ 6.00%
- Median HH income
- $25,815
- Composite
- 13.06/100
- National rank
- #9564
- State rank
- #499 of 540 in MI
Livability — Detroit
- Score
- 73/100
- State rank
- #218
- US rank
- #5427
Category grades
Schools grade is shown separately in the Schools card above.
Census & demographics
- Census place
- Detroit, MI
- County
- Wayne County · 1,562,939 people
- City population
- 572,865
- Metro
- Detroit-Warren-Dearborn, MI
- Population (ZIP)
- 15,227
- Household income
- $45,046
- Rent vs Own
- Severe rent burden
- 646.0
Population outlook (Wayne County) Hauer SSP2
- Today (2025)
- 1,675,273 people
- By 2030
- 1,620,300 · -3.3%
- By 2040
- 1,502,341 · -10.3%
- By 2050
- 1,384,039 · -17.4%
- By 2075
- 1,124,592 · -32.9%
- By 2100
- 881,193 · -47.4%
Race, ethnicity, and origin ACS 2023
- Neighborhood character
- Predominantly Black (81%)
- Race & ethnicity
- Black 81% White 12% Two or more races 5% Hispanic / Latino 3%
- Common ancestry
- Iranian 3% Romanian 1% Slovak 1%
- Foreign-born
- 4% · Canada
- Languages at home
- 94% English-only · Spanish 4% Other Indo-European 1%
Political lean MEDSL · Wayne
- 2024 margin
- Strong D (+29.0) · D 62.7% · R 33.7% · Other 3.6%
- 2008→2024 swing
- -20.5pp toward R · 2008: 49.5pp · 2024: 29.0pp
- All cycles
- 2024: D+29.0 2020: D+38.1 2016: D+37.3 2012: D+46.9 2008: D+49.5
Not yet ingested
- Civics
- —
Market trends
- HPI YoY
- ▼ -139.60%
- Current HPI
- 130.9545
- Rent YoY
- ▲ 5.20%
- Metro
- Detroit-Warren-Dearborn, MI
- State GDP YoY
- ▲ 1.37%
- F500 in state
- 28
Industry mix (Fortune 500 HQ in MI)
| Industry | F500 HQs | Revenue |
|---|---|---|
| Automotive Parts | 3 | $48B |
|
||
| Automotive | 2 | $372B |
|
||
| Chemicals | 1 | $45B |
|
||
| Automotive Retail | 1 | $29B |
|
||
| Healthcare / Medical Devices | 1 | $23B |
|
||
| Automotive Technology | 1 | $20B |
|
||
Price history
+0.0% since first listed4 events — show timeline
- 2026-04-18 Pending — MiRealSource-MiMLS
- 2026-04-18 Pending — REALCOMP
- 2026-03-23 Listed $340,000 REALCOMP
- 2026-03-23 Listed $340,000 MiRealSource-MiMLS
Cash-flow waterfall
monthlySold comps — $/sqft
last 12 mo · ≤1 miLoading sold comps…