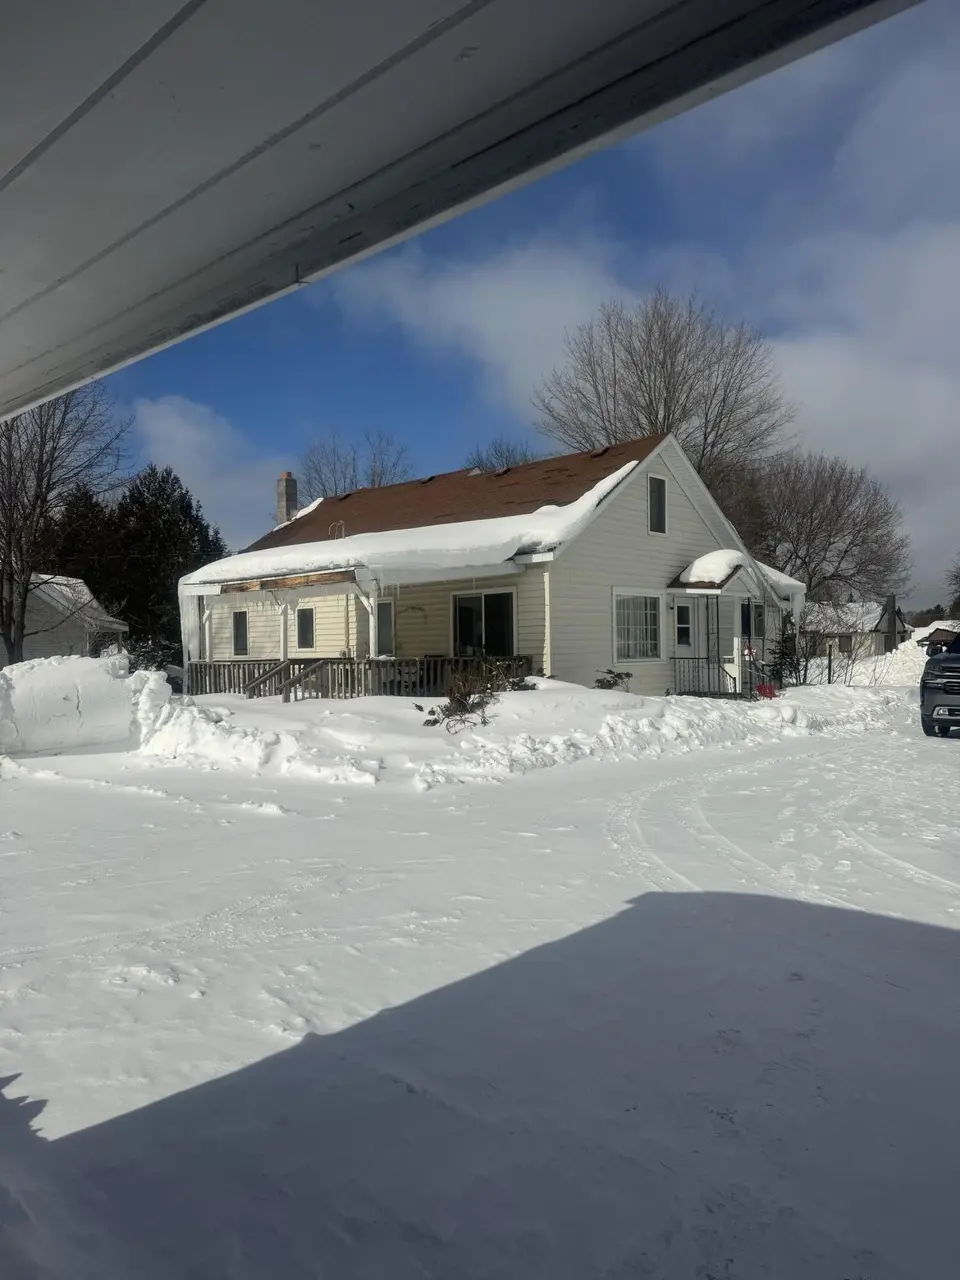
203 W Avenue D · McMillan, MI
Flood risk 1/10 · Minimal
- FEMA flood zone
- —
- Chance of flooding over 30 yrs
- 0.0%
- Est. flood insurance / yr
- —
Fire risk 4/10 · Minor
- Est. fire insurance / yr
- $784 – $1,456
Heat risk 1/10 · Minimal
- Hot days now (above 89°F)
- 7 days/yr
- Hot days in 30 yrs
- 13 days/yr
Wind risk 1/10 · Minimal
- Chance of severe wind over 30 yrs
- —
Air-quality risk 2/10 · Minimal
- Unhealthy air days now
- 0 days/yr
- Unhealthy air days in 30 yrs
- 1 days/yr
Risk factors via First Street. Map © Google.
Why this score? — see what drove the B grade
The composite is a weighted blend of 9 inputs, each scored 0–100. Each bar is that input's sub-score; the figure is the points it added to the 100-point composite (weight × sub-score).
- Cash flow +30.0/30.0
- ARV discount +14.3/15.0
- DSCR +10.0/10.0
- 1% rule +8.9/10.0
- Rent growth +2.5/5.0
- Schools +2.5/10.0
- Livability +2.5/5.0
- Condition / age +2.5/5.0
- Appreciation +0.0/10.0
$99,900
🖨 Deal sheet 📄 Offer letter ✓ Due diligence
Listing remarks MLS
Charming 4-bedroom home on a corner lot in the Village of Newberry. The home features hardwood floors, newer appliances and a covered patio for your outdoor enjoyment. The detached two-car garage has an additional storage area and an upstairs. Shown by appointment
Key facts
- Covered patio
- Corner lot
- Hardwood floors
Tags
Neighborhood map
What this means for you Summary
Snapshot
- This is a 4-bed/1.0-bath single-family listed at $100k.
Deal economics
- At list price, monthly cash flow is $422 ($5k/yr) — positive.
- The deal already cash-flows at list — no discount required.
- Meets the 1% rule at list price ($1k rent vs $100k).
- Recommended offer: $91k (9.0% below list) — sets the bar for market timing.
Location & tenants
- Location reads: area grade B — affects rentability + tenant quality, not the cash-flow math above.
- Tahquamenon Area Schools (town): math 23% / reading 37% proficiency, ranked #374 of 540 in MI (top 69%) — families likely to look elsewhere, expect single-tenant / working-renter base with shorter leases.
- Market conditions: 67 active listings in the ZIP; 9 units permitted in Luce County in 2024 (0 in 5+ unit buildings).
Forward outlook
- Local home prices are declining (-3.0%/yr); year-one equity from $691 of loan paydown is wiped out by about $3k of value loss. Plan a longer hold.
- Luce County population projected at -11% by 2050 — secular population decline; favor cash flow + early exit over multi-decade hold.
- At projected returns (-3.0% appreciation + 3.0% rent growth), your $28k cash investment doubles in ~7 years — after that, you're playing with house money.
Negotiation context
- It's been on market 113 days — a 9% lower offer ($91k) is reasonable based on typical stale-listing flexibility.
- 3 sale attempts since 9y ago with the ask held roughly flat each time — persistent listings suggest the price (not the market) is what's stuck; bring a comps-based counter.
Questions for the listing agent
- It's been on market 113 days. Have you received any prior offers? Is the seller open to a 9% concession, seller financing, or rate buy-down credit?
- Built in 1970 — when were the roof, HVAC, electrical panel, plumbing, and water heater last replaced?
- Why hasn't it sold? Are there any deal-killer items the seller is aware of (foundation, flood, title, zoning, code violations)?
- Is there a deadline driving the sale (1031 exchange, divorce, estate, relocation)? That informs how much negotiation room exists.
- What's the average days-on-market for RENTAL listings here right now (not sales)? A rising rental-DOM trend means longer vacancies and softer asking-rent achievability than the comps imply.
- What's the recent tenant-quality profile in this submarket — average credit score on applications, eviction rate, late-payment / NSF rate, and stable-employment percentage? A property-management company in the area should have these aggregated.
- How much new for-sale + rental construction is in the pipeline within 1–3 miles? Heavy new supply typically softens prices + rents 12–24 months out; constrained supply supports both.
Investment metrics
- 1% rule
- 1.39% ✓
- Cap rate
- 11.36%
- Cash-on-cash
- 18.11%
- DSCR
- 1.81
- GRM
- 6.0
CMA / ARV
- ARV (median comp)
- $117,762
- List price
- $99,900
- Delta
- -15.17%
- Verdict
- UNDERPRICED
- Comps
- 20 within 1.0 mi
Show comp detail 5 sales within ~0.75 mi
| Address | Dist | Beds/Ba | Sqft | Sold | Price | $/sf | Match |
|---|---|---|---|---|---|---|---|
| 408 W Ave B | 0.25mi | 4/2.0 | 1,734 (+8%) | 18mo | $170,000 | $98 | 55 |
| 114 W John St | 0.53mi | 4/2.0 | 1,529 (-4%) | 20mo | $140,000 | $92 | 47 |
| 518 E Mcmillan Ave | 0.61mi | 4/2.0 | 1,547 (-3%) | 23mo | $90,000 | $58 | 43 |
| 502 E Mcmillan Ave | 0.56mi | 3/1.0 (-1) | 1,368 (-14%) | 16mo | $81,500 | $60 | 31 |
| 309 W Helen St | 0.58mi | 3/1.5 (-1) | 1,408 (-12%) | 18mo | $146,500 | $104 | 31 |
Match score weights: distance 35% · size 25% · config 20% · recency 20%. Top-matched comps best support the ARV.
Projected returns pro-forma
-3.0% appreciation · 3.0% rent growth · sell at horizon
- IRR
- 9.7%
- Equity multiple
- 1.38×
- Total profit
- $10,708
- Equity at exit
- $14,895
- IRR
- 18.9%
- Equity multiple
- 2.57×
- Total profit
- $43,984
- Equity at exit
- $8,638
Cash invested: $27,972 (down + closing). Projections, not guarantees.
Landlord ↔ Tenant lean methodology
- Overall (STATE)
- 62 Landlord-Friendly
- State Michigan
- 62 Landlord-Friendly · EVEN
- County
- — inherits STATE
- City
- — inherits STATE
ZIP-level market 49868
- Home prices YoY
- -16.8%
- Active inventory
- 67
- Price-to-rent
- 6.0×
Monthly cashflow live
- Estimated rent
- $1,386 medium interval (Pro) →
- Mortgage (P&I)
- −$524
- Tax from tax record
- −$107 /mo · $1,287/yr
- Insurance
- −$42
- HOA
- −$0
- Vacancy / Maint / Mgmt
- −$291
- Net cashflow
- $422
Break-even live
UW: 25.0% down · 7.5% · 30yr · 1.5% tax · 5.0% vac · 8.0% maint · 8.0% mgmt
Financing live
Cash to close
- Down payment
- $24,975
- Closing costs
- $2,997
- Reserves months
- —
- Total cash needed
- —
Loan-product check · same deal, 3 products live
Conventional
25% down · 7.5% · 30yr
- Down + closing
- —
- Monthly P&I
- —
- Monthly cashflow
- —
- DSCR
- —
- Eligible?
- —
Personal DTI + credit; lowest rate.
DSCR
20% down · 8.5% · 30yr
- Down + closing
- —
- Monthly P&I
- —
- Monthly cashflow
- —
- DSCR
- —
- Eligible?
- —
No personal income docs; deal must DSCR.
Hard money
10% down · 12.0% · 12mo
- Down + closing
- —
- Monthly P&I
- —
- Monthly cashflow
- —
- DSCR
- —
- Eligible?
- —
Short-term bridge; refi at stabilization.
Listing history 23 events
-
2026-06-18days on market $99,900 Active 113 DOM
-
2026-06-17days on market $99,900 Active 112 DOM
-
2026-06-16days on market $99,900 Active 111 DOM
-
2026-06-15days on market $99,900 Active 110 DOM
-
2026-06-13days on market $99,900 Active 108 DOM
-
2026-06-12days on market $99,900 Active 107 DOM
-
2026-06-09days on market $99,900 Active 104 DOM
-
2026-06-08days on market $99,900 Active 103 DOM
-
2026-06-07days on market $99,900 Active 102 DOM
-
2026-06-07days on market $99,900 Active 101 DOM
-
2026-06-04days on market $99,900 Active 98 DOM
-
2026-06-02days on market $99,900 Active 97 DOM
-
2026-06-01days on market $99,900 Active 96 DOM
-
2026-05-31days on market $99,900 Active 95 DOM
-
2026-05-31days on market $99,900 Active 94 DOM
-
2026-02-25$99,900 Active 264-char remark
Show marketing remark (264 chars)
Charming 4-bedroom home on a corner lot in the Village of Newberry. The home features hardwood floors, newer appliances and a covered patio for your outdoor enjoyment. The detached two-car garage has an additional storage area and an upstairs. Shown by appointment
-
2024-07-08soldstatus $100,000 Closed 313-char remark
Show marketing remark (313 chars)
Charming 4-bedroom home featuring 2 fireplaces, hardwood floors in the family room, a sunroom, and a spacious yard with a covered back deck for outdoor enjoyment. Home is on a lovely corner lot in the Village of Newberry. Detached Garage with a upstairs and bonus office area. Call today for your personal tour!!!
-
2024-05-22historical Active Under Contract 313-char remark
Show marketing remark (313 chars)
Charming 4-bedroom home featuring 2 fireplaces, hardwood floors in the family room, a sunroom, and a spacious yard with a covered back deck for outdoor enjoyment. Home is on a lovely corner lot in the Village of Newberry. Detached Garage with a upstairs and bonus office area. Call today for your personal tour!!!
-
2024-04-22price $110,000 313-char remark
Show marketing remark (313 chars)
Charming 4-bedroom home featuring 2 fireplaces, hardwood floors in the family room, a sunroom, and a spacious yard with a covered back deck for outdoor enjoyment. Home is on a lovely corner lot in the Village of Newberry. Detached Garage with a upstairs and bonus office area. Call today for your personal tour!!!
-
2024-03-15$120,000 Active 313-char remark
Show marketing remark (313 chars)
Charming 4-bedroom home featuring 2 fireplaces, hardwood floors in the family room, a sunroom, and a spacious yard with a covered back deck for outdoor enjoyment. Home is on a lovely corner lot in the Village of Newberry. Detached Garage with a upstairs and bonus office area. Call today for your personal tour!!!
-
2019-09-05soldstatus $36,500
-
2019-09-05soldstatus $36,500
-
2017-08-04$40,000
ⓘ Source: listings_history table (triggers on properties + properties_extension) + one-shot
backfill from property_details.listing_events for pre-trigger history.
Tax reassessment forecast MI · Partial reset (capped growth)
- Current annual tax
- $1,287 · $107/mo
- Projected year-2 tax
- $1,413 · $118/mo
- Expected delta
- +$126/yr (+$10/mo · 9.8%)
ⓘ Screening estimate from a state-policy table — verify with the county assessor before closing.
Climate risk First Street
- Flood 1/10 Low 0% chance over 30 yrs
- Wildfire 4/10 Moderate
- Heat 1/10 Low 7 d/yr ≥89°F today · 13 d/yr by 30 yrs out
- Wind 1/10 Low
- Air quality 2/10 Low 0 unhealthy d/yr today · 1 by 30 yrs out
Nearby sold comps map
Loading sold comps map…
Walkable amenities ~0.75 mi
Loading nearby amenities…
Taxation est. · year 1
- Rental income
- $16,631
- − Mortgage interest
- −$5,596
- − Property taxes
- −$1,287
- − Insurance
- −$500
- − Repairs & maintenance
- −$1,330
- − Management
- −$1,330
- − Depreciation
- −$2,906
- Taxable income
- $3,682
- Est. tax owed @ 24.0%
- −$884
- After-tax cash flow
- $4,182/yr
For passive investors: Depreciation is non-cash, so a rental often shows a tax loss while cash-flowing — sheltering income. Rental losses are passive: they offset passive income freely, and up to $25,000/yr can offset ordinary (W-2) income if you actively participate and your MAGI is under $100k (phasing out to $0 by $150k); unused losses carry forward. On sale, claimed depreciation is recaptured at up to 25%, and gains may owe capital-gains tax (a 1031 exchange can defer both). Figures are a year-1 estimate at your 24.0% rate — not tax advice; consult a CPA.
Schools (NCES district)
- District
- Tahquamenon Area Schools
- NCES district ID
- 2625350
- Math proficiency
- 23% ▼ -1.00%
- Reading proficiency
- 37% ▼ -4.00%
- Median HH income
- $38,217
- Composite
- 25.03/100
- National rank
- #7553
- State rank
- #374 of 540 in MI
Livability — McMillan
No livability data for this city. (Only ~50 U.S. cities are tracked.)
Census & demographics
- Census place
- Newberry, MI
- Population (ZIP)
- 5,231
Population outlook (Luce County) Hauer SSP2
- Today (2025)
- 6,185 people
- By 2030
- 6,049 · -2.2%
- By 2040
- 5,756 · -6.9%
- By 2050
- 5,481 · -11.4%
- By 2075
- 4,729 · -23.5%
- By 2100
- 3,631 · -41.3%
Race, ethnicity, and origin ACS 2023
- Neighborhood character
- Predominantly White (74%)
- Race & ethnicity
- White 74% Black 10% Native American 8% Two or more races 6% Hispanic / Latino 2%
- Common ancestry
- Romanian 4% Lithuanian 3% Iranian 1%
- Foreign-born
- 1% · Canada
- Languages at home
- 96% English-only · Spanish 2% Arabic 1%
Political lean MEDSL · Luce
- 2024 margin
- Solid R (+46.9) · D 25.8% · R 72.7% · Other 1.5%
- 2008→2024 swing
- -36.0pp toward R · 2008: -10.9pp · 2024: -46.9pp
- All cycles
- 2024: R+46.9 2020: R+42.2 2016: R+41.7 2012: R+22.2 2008: R+10.9
Not yet ingested
- Civics
- —
Market trends
- HPI YoY
- ▼ -26.69%
- Current HPI
- 132.0633
- Rent YoY
- —
- Metro
- —
- State GDP YoY
- ▲ 1.37%
- F500 in state
- 28
Industry mix (Fortune 500 HQ in MI)
| Industry | F500 HQs | Revenue |
|---|---|---|
| Automotive Parts | 3 | $48B |
|
||
| Automotive | 2 | $372B |
|
||
| Chemicals | 1 | $45B |
|
||
| Automotive Retail | 1 | $29B |
|
||
| Healthcare / Medical Devices | 1 | $23B |
|
||
| Automotive Technology | 1 | $20B |
|
||
Price history
+149.8% since first listed8 events — show timeline
- 2026-02-25 Listed $99,900 EUPBR
- 2024-07-08 Sold (MLS) $100,000 WWMLS
- 2024-05-22 Contingent — WWMLS
- 2024-04-22 Price Changed $110,000 WWMLS
- 2024-03-15 Listed $120,000 WWMLS
- 2019-09-05 Sold (Public Records) $36,500 Public Records
- 2019-09-05 Sold (MLS) $36,500 EUPBR
- 2017-08-04 Listed $40,000 EUPBR
Property tax history
+7.2%/yrLatest (2016): $1,287 · +23.2% YoY. Source: county tax records.
Cash-flow waterfall
monthlySold comps — $/sqft
last 12 mo · ≤1 miLoading sold comps…