 🏢 Co-op
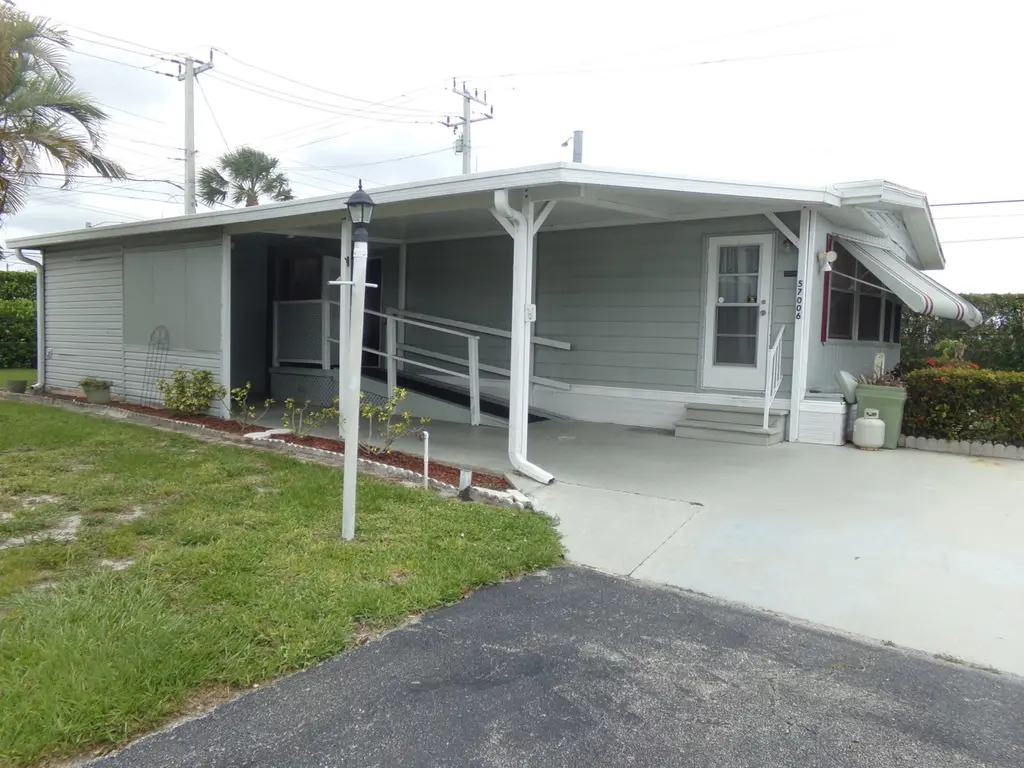
57006 Antilles · Boynton Beach, FL
Flood risk 1/10 · Minimal
- FEMA flood zone
- X (unshaded)
- Chance of flooding over 30 yrs
- 0.0%
- Est. flood insurance / yr
- $507 – $1,088
Fire risk 1/10 · Minimal
- Est. fire insurance / yr
- $947 – $1,759
Heat risk 9/10 · Severe
- Hot days now (above 106°F)
- 6 days/yr
- Hot days in 30 yrs
- 20 days/yr
Wind risk 10/10 · Severe
- Chance of severe wind over 30 yrs
- 99.0%
Air-quality risk 2/10 · Minimal
- Unhealthy air days now
- 1 days/yr
- Unhealthy air days in 30 yrs
- 2 days/yr
Risk factors via First Street. Map © Google.
Why this score? — see what drove the B grade
The composite is a weighted blend of 9 inputs, each scored 0–100. Each bar is that input's sub-score; the figure is the points it added to the 100-point composite (weight × sub-score).
- Cash flow +30.0/30.0
- 1% rule +10.0/10.0
- DSCR +10.0/10.0
- ARV discount +7.5/15.0
- Schools +4.3/10.0
- Livability +3.6/5.0
- Condition / age +2.5/5.0
- Rent growth +2.4/5.0
- Appreciation +0.0/10.0
$169,000
🖨 Deal sheet 📄 Offer letter ✓ Due diligence
Listing remarks
Welcome to this practical 2-bedroom, 2-bathroom residence nestled within Jamaica Bay Mobile Home Co-Op in Boynton Beach, Florida. Offering 1,440 square feet of finished living space on a single floor, this home provides comfortable accommodations and functional layout for daily living. The two full bathrooms offer convenience for household members, while the open design maximizes usable space throughout the residence. Located within an established cooperative community, this property presents an accessible housing option in a well-established Boynton Beach location. Jamaica Bay is a desirable 55+, gated community offering offering many amenities including pickleball courts , 3 pools, large
Key facts
- Gated community
- Dog park
- Pickleball courts
Tags
Property features AI
Finance
- Financial info: Not on a land lease; Pets allowed (with limits on number and size)
- HOA & community: Part of Jamaica Bay association; Monthly association fee (paid monthly); Association provides internet, security, sewer, trash, water, common area maintenance, reserve funds, recreation facilities, pool service; Community amenities include pool (heated), clubhouse, billiard and game rooms, community room, library, kitchen facilities, laundry, storage, management/on-site manager, dog park, bocce ball, pickleball courts, shuffleboard court, putting green, maintained community, street lights, gated community, and maintenance
Exterior
- Parking: Attached carport; Carport with 2 covered spaces (2 carport spaces total); Total parking for 2 vehicles
- Security: Gated community with security guard and security gate
- Utilities: Public water; Public sewer; Electricity connected; Sewer connected; Water connected; Cable connected; Other utility connections
- Home design: Manufactured home; One story; Entry at level 1; Faces south; Resale condition; Walker-accessible stairs
- Construction: Vinyl siding; Aluminum roof
- Exterior features: Shed(s); Partial backyard fencing; Back yard fencing; Located on a cul-de-sac; Corner lot; Paved roads; Private maintained road; Not waterfront
Interior
- Kitchen: Electric range; Dishwasher; Microwave; Refrigerator; Electric water heater
- Bedrooms: 2 bedrooms on the main level
- Flooring: Carpet; Vinyl
- Bathrooms: 2 full bathrooms on the main level
- Heating & cooling: Central heating; Central air; Ceiling fan(s)
- Interior features: Built-in features; Walk-in closet(s); Partially furnished; Jalousie and shutter window treatments; Other window features
- Laundry & utility: Laundry room; Washer hookup; Electric dryer hookup; Outside access to laundry; Laundry area located in carport
Neighborhood map
What this means for you Summary
Snapshot
- This is a 3-bed/2.0-bath condo listed at $169k.
Deal economics
- At list price, monthly cash flow is $971 ($12k/yr) — positive.
- The deal already cash-flows at list — no discount required.
- Meets the 1% rule at list price ($3k rent vs $169k).
- Cap rate 13.2% vs local median 4.3% in Boynton Beach — top-decile yield for the area; either an underpriced asset or a hidden risk that comps aren't pricing in. Stress-test before assuming the spread holds.
Location & tenants
- Location reads 72/100 on livability (#351 in FL) — a middle-class / working-renter tenant base. Strengths: housing A+, health & safety B+, cost of living B; Watch: amenities D+, crime D-, commute F.
- Palm Beach (suburban): math 46% / reading 53% proficiency, ranked #34 of 73 in FL (top 47%) — families likely to look elsewhere, expect single-tenant / working-renter base with shorter leases.
- Zoned schools: Crosspointe Elementary School (math 36% / reading 45%, grade F, #1,471 of 2,144 statewide, top 69%, 652 students, 75% FRL); Congress Community Middle School (math 21% / reading 28%, grade F, #522 of 571 statewide, top 93%, 988 students, 72% FRL); Boynton Beach Community High (math 13% / reading 25%, grade F, #565 of 667 statewide, top 85%, 1,547 students, 65% FRL) — zoned schools average 71% FRL vs 52% district-wide (19 pts higher); higher-poverty schools than district average — tighter screening recommended.
- Zoned-school proficiency averages 28% at this address vs 50% district-wide (-22 pts) — the specific schools serving this property underperform the Palm Beach average; the district grade overstates school quality for this exact location.
- Market conditions: Rents soft (-0.6%/yr); 445 active listings in the ZIP; 40 comparable units currently listed for rent nearby; rentals at typical pace (median 21d on market — plan ~3-4 weeks tenant-placement turnaround); solid renter incomes; 3,974 units permitted in Palm Beach County in 2024 (1,012 in 5+ unit buildings).
- At $2,870/mo this rent would consume 45% of the median local household income ($76k/yr) (locally 1813% of renters already pay >50% of income on rent) — very limited rent-growth headroom before tenants either downsize or default.
Forward outlook
- Local home prices are declining (-3.0%/yr); year-one equity from $1k of loan paydown is wiped out by about $5k of value loss. Plan a longer hold.
- Palm Beach County population projected at +30% by 2050 — long-run rental-demand tailwind backs the buy-and-hold thesis.
- At projected returns (-3.0% appreciation + 0.0% rent growth), your $47k cash investment doubles in ~6 years — after that, you're playing with house money.
Negotiation context
- Only 11 days on market — expect competitive offers; lowballing is unlikely to land.
- 3 sale attempts since 14y ago with the ask held roughly flat each time — persistent listings suggest the price (not the market) is what's stuck; bring a comps-based counter.
Risks & watch-outs
- Climate carrying-cost: severe wind risk, 99% chance of damaging wind over 30y; extreme-heat days projected 6→20/yr by 2055 (HVAC capex compounding) — expect insurance premiums to compound above CPI over the hold.
Questions for the listing agent
- Built in 1979 — when were the roof, HVAC, electrical panel, plumbing, and water heater last replaced?
- What does the HOA fee cover, when was the last increase, and are there any pending special assessments or reserve-fund shortfalls?
- Any open or pending special assessments — roof, HVAC, plumbing, elevator, façade? What's the per-unit balance and payoff schedule, and is the seller paying it off at close or rolling it to the buyer?
- Is there a deadline driving the sale (1031 exchange, divorce, estate, relocation)? That informs how much negotiation room exists.
- Crime grade is D in this area — have there been break-ins, vandalism, or insurance claims at this property in the last 3 years? What carrier currently insures it and at what premium?
- What's the average days-on-market for RENTAL listings here right now (not sales)? A rising rental-DOM trend means longer vacancies and softer asking-rent achievability than the comps imply.
- What's the recent tenant-quality profile in this submarket — average credit score on applications, eviction rate, late-payment / NSF rate, and stable-employment percentage? A property-management company in the area should have these aggregated.
- How much new apartment / multifamily construction is in the pipeline within 1–3 miles? Heavy new supply (>2% of stock underway) typically softens rents 12–24 months out; light construction supports rent growth.
Investment metrics
- 1% rule
- 1.70% ✓
- Cap rate
- 13.19%
- Cash-on-cash
- 24.63%
- DSCR
- 2.10
- GRM
- 4.9
CMA / ARV
No comps found within radius.
Projected returns pro-forma
-3.0% appreciation · 0.0% rent growth · sell at horizon
- IRR
- 14.4%
- Equity multiple
- 1.55×
- Total profit
- $26,185
- Equity at exit
- $25,198
- IRR
- 20.6%
- Equity multiple
- 2.49×
- Total profit
- $70,449
- Equity at exit
- $14,612
Cash invested: $47,320 (down + closing). Projections, not guarantees.
Landlord ↔ Tenant lean methodology
- Overall (STATE)
- 87 Strongly Landlord-Friendly
- State Florida
- 87 Strongly Landlord-Friendly · R+3
- County
- — inherits STATE
- City
- — inherits STATE
ZIP-level market 33436
- Home prices YoY
- -26.0%
- Rents YoY
- -0.6%
- Active inventory
- 445
- Price-to-rent
- 4.9×
Monthly cashflow live
- Estimated rent
- $2,870 high interval (Pro) →
- Mortgage (P&I)
- −$886
- Tax from tax record
- −$69 /mo · $829/yr
- Insurance
- −$70
- HOA
- −$270
- Vacancy / Maint / Mgmt
- −$603
- Net cashflow
- $971
Break-even live
UW: 25.0% down · 7.5% · 30yr · 1.5% tax · 5.0% vac · 8.0% maint · 8.0% mgmt
Financing live
Cash to close
- Down payment
- $42,250
- Closing costs
- $5,070
- Reserves months
- —
- Total cash needed
- —
Loan-product check · same deal, 3 products live
Conventional
25% down · 7.5% · 30yr
- Down + closing
- —
- Monthly P&I
- —
- Monthly cashflow
- —
- DSCR
- —
- Eligible?
- —
Personal DTI + credit; lowest rate.
DSCR
20% down · 8.5% · 30yr
- Down + closing
- —
- Monthly P&I
- —
- Monthly cashflow
- —
- DSCR
- —
- Eligible?
- —
No personal income docs; deal must DSCR.
Hard money
10% down · 12.0% · 12mo
- Down + closing
- —
- Monthly P&I
- —
- Monthly cashflow
- —
- DSCR
- —
- Eligible?
- —
Short-term bridge; refi at stabilization.
Rent comps 40 comps
| Address | Beds | Baths | Sqft | Rent | $/sqft | DOM | Units | Dist |
|---|---|---|---|---|---|---|---|---|
| 4045 White Pine Dr Boynton Beach, FL | 3.0 | 2.0 | 1566 | $1,800 | $1.15 | 1d | 1 | 0.61mi |
| 5537 Pebble Brook Ln Boynton Beach, FL | 3.0 | 2.0 | 1166 | $2,825 | $2.42 | 14d | 1 | 0.68mi |
| 9498 S Military Trl #5 Boynton Beach, FL | 3.0 | 2.5 | 1317 | $2,900 | $2.20 | 24d | 1 | 0.73mi |
| 8949 Oak St Boynton Beach, FL | 2.0 | 2.0 | 1040 | $1,300 | $1.25 | 24d | 1 | 0.78mi |
| 5072 Arbor Glen Cir Lake Worth, FL | 3.0 | 2.0 | 1232 | $3,300 | $2.68 | 14d | 1 | 0.81mi |
| 5373 Mirror Lakes Blvd Boynton Beach, FL | 3.0 | 2.0 | 1310 | $2,100 | $1.60 | 24d | 1 | 0.83mi |
| 8202 White Rock Cir Boynton Beach, FL | 3.0 | 2.0 | 1738 | $3,300 | $1.90 | 7d | 1 | 0.88mi |
| 8520 Tourmaline Blvd Boynton Beach, FL | 4.0 | 2.0 | 1699 | $4,000 | $2.35 | 18d | 1 | 0.89mi |
| 5155 Europa Dr Unit J Boynton Beach, FL | 3.0 | 2.0 | 1333 | $2,750 | $2.06 | 24d | 1 | 0.91mi |
| 5234 Europa Dr Unit A Boynton Beach, FL | 3.0 | 2.0 | 1578 | $2,500 | $1.58 | 19d | 1 | 0.93mi |
| 5299 Europa Dr Unit P Boynton Beach, FL | 3.0 | 2.0 | 1606 | $3,000 | $1.87 | 13d | 1 | 0.94mi |
| 5275 Europa Dr Unit I Boynton Beach, FL | 3.0 | 2.0 | 1282 | $2,500 | $1.95 | 1d | 1 | 1.05mi |
| 5157 Floria Way Unit J Boynton Beach, FL | 3.0 | 2.0 | 1447 | $3,300 | $2.28 | 24d | 1 | 1.05mi |
| 9565 El Clair Ranch Rd Boynton Beach, FL | 3.0 | 2.0 | 1867 | $3,500 | $1.87 | 20d | 1 | 1.09mi |
| 9565 El Clair Ranch Rd Boynton Beach, FL | 3.0 | 2.0 | 1867 | $3,500 | $1.87 | 7d | 1 | 1.09mi |
| 5133 Brisata Cir Unit P Boynton Beach, FL | 3.0 | 2.0 | 1374 | $2,800 | $2.04 | 24d | 1 | 1.10mi |
| 5418 Firenze Dr Unit P Boynton Beach, FL | 2.0 | 2.0 | 1139 | $2,400 | $2.11 | 2d | 1 | 1.13mi |
| 9900 Pineapple Tree Dr #106 Boynton Beach, FL | 2.0 | 2.0 | 1008 | $2,250 | $2.23 | 24d | 1 | 1.16mi |
| 9935 Pineapple Tree Dr #202 Boynton Beach, FL | 2.0 | 2.0 | 1008 | $2,575 | $2.55 | 14d | 1 | 1.18mi |
| 3962 Winfield Rd Unit 3962 Boynton Beach, FL | 4.0 | 2.0 | 1592 | $3,300 | $2.07 | 13d | 1 | 1.21mi |
| 3962 Winfield Rd Boynton Beach, FL | 4.0 | 2.0 | 1592 | $3,300 | $2.07 | 14d | 1 | 1.21mi |
| 4296 Grove Park Ln Boynton Beach, FL | 3.0 | 2.0 | 1696 | $3,350 | $1.98 | 24d | 1 | 1.24mi |
| 3736 Coelebs Ave Boynton Beach, FL | 3.0 | 2.0 | 1232 | $3,000 | $2.44 | 24d | 1 | 1.27mi |
| 3930 Max Pl Boynton Beach, FL | 3.0 | 2.0 | 1550 | $2,825 | $1.82 | 24d | 1 | 1.27mi |
| 5945 Parkwalk Dr Boynton Beach, FL | 2.0 | 2.0 | 1178 | $2,500 | $2.12 | 22d | 1 | 1.27mi |
| 7705 Forest Green Ln Boynton Beach, FL | 2.0 | 2.0 | 1379 | $3,200 | $2.32 | 17d | 1 | 1.28mi |
| 7705 Forest Green Ln Boynton Beach, FL | 3.0 | 2.0 | 1379 | $3,200 | $2.32 | 24d | 1 | 1.28mi |
| 4220 Grove Park Ln Unit 1 Boynton Beach, FL | 3.0 | 2.0 | 1406 | $3,400 | $2.42 | 4d | 1 | 1.29mi |
| 4220 Grove Park Ln Unit 1 Boynton Beach, FL | 3.0 | 2.0 | 1406 | $3,600 | $2.56 | 24d | 1 | 1.29mi |
| 4525 Nutmeg Tree Ln Unit A Boynton Beach, FL | 2.0 | 2.0 | 1404 | $3,000 | $2.14 | 24d | 1 | 1.30mi |
| 6365 Lansdowne Cir Boynton Beach, FL | 3.0 | 2.0 | 1769 | $3,200 | $1.81 | 2d | 1 | 1.32mi |
| 7640 Forest Green Ln Boynton Beach, FL | 3.0 | 2.0 | 1696 | $3,500 | $2.06 | 24d | 1 | 1.34mi |
| 7640 Forest Green Ln Unit 7640 Boynton Beach, FL | 3.0 | 2.0 | 1696 | $3,500 | $2.06 | 11d | 1 | 1.34mi |
| 3500 Sandpiper Dr Boynton Beach, FL | 1.0–2.0 | 1.0–2.0 | 1147 | $2,579 | $2.25 | 22d | 22 | 1.36mi |
| 9766 Kamena Cir Boynton Beach, FL | 3.0 | 2.5 | 1596 | $3,300 | $2.07 | 5d | 1 | 1.40mi |
| 920 Sun Acres Ln Boynton Beach, FL | 2.0 | 2.0 | 1352 | $2,200 | $1.63 | 24d | 1 | 1.41mi |
| 190 Temple Ave Boynton Beach, FL | 3.0 | 2.0 | 1781 | $4,200 | $2.36 | 24d | 1 | 1.43mi |
| 4259 Wood Ride Unit E Boynton Beach, FL | 2.0 | 2.0 | 1240 | $2,350 | $1.90 | 7d | 1 | 1.43mi |
| 9873 Lawrence Rd Boynton Beach, FL | 2.0 | 2.0 | 1200 | $2,267 | $1.89 | 22d | 1 | 1.43mi |
| 9873 Lawrence Rd Boynton Beach, FL | 2.0 | 2.0 | 1200 | $2,315 | $1.93 | 3d | 1 | 1.43mi |
HOA detail condo
- Monthly dues
- $270 · $3,240/yr
- Likely covers
- poolsecurity
- Assessments
- None detected in remarks — confirm with the listing agent.
Listing history 8 events
-
2026-06-18days on market $169,000 Active 11 DOM
-
2026-06-17days on market $169,000 Active 10 DOM
-
2026-06-16days on market $169,000 Active 9 DOM
-
2026-06-15days on market $169,000 Active 8 DOM
-
2026-06-13days on market $169,000 Active 6 DOM
-
2026-06-09days on market $169,000 Active 2 DOM
-
2026-06-08remarks 699-char remark
-
2026-06-08$169,000 Active 1 DOM
ⓘ Source: listings_history table (triggers on properties + properties_extension) + one-shot
backfill from property_details.listing_events for pre-trigger history.
Tax reassessment forecast FL · Resets to sale price
- Current annual tax
- $829 · $69/mo
- Projected year-2 tax
- $1,403 · $117/mo
- Expected delta
- +$574/yr (+$48/mo · 69.2%)
ⓘ Screening estimate from a state-policy table — verify with the county assessor before closing.
Climate risk First Street
- Flood 1/10 Low FEMA zone X (unshaded) · 0% chance over 30 yrs
- Wildfire 1/10 Low
- Heat 9/10 Extreme 6 d/yr ≥106°F today · 20 d/yr by 30 yrs out
- Wind 10/10 Extreme 99% chance of damaging wind over 30 yrs
- Air quality 2/10 Low 1 unhealthy d/yr today · 2 by 30 yrs out
Nearby sold comps map
Loading sold comps map…
Walkable amenities ~0.75 mi
Loading nearby amenities…
Taxation est. · year 1
- Rental income
- $34,435
- − Mortgage interest
- −$9,467
- − Property taxes
- −$829
- − Insurance
- −$845
- − Repairs & maintenance
- −$2,755
- − Management
- −$2,755
- − HOA
- −$3,240
- − Depreciation
- −$4,916
- Taxable income
- $9,629
- Est. tax owed @ 24.0%
- −$2,311
- After-tax cash flow
- $9,344/yr
For passive investors: Depreciation is non-cash, so a rental often shows a tax loss while cash-flowing — sheltering income. Rental losses are passive: they offset passive income freely, and up to $25,000/yr can offset ordinary (W-2) income if you actively participate and your MAGI is under $100k (phasing out to $0 by $150k); unused losses carry forward. On sale, claimed depreciation is recaptured at up to 25%, and gains may owe capital-gains tax (a 1031 exchange can defer both). Figures are a year-1 estimate at your 24.0% rate — not tax advice; consult a CPA.
Schools (NCES district)
- District
- Palm Beach
- NCES district ID
- 1201500
- Math proficiency
- 46% ▼ -16.00%
- Reading proficiency
- 53% ▼ -4.00%
- Median HH income
- $53,943
- Composite
- 42.72/100
- National rank
- #3160
- State rank
- #34 of 73 in FL
Livability — Boynton Beach
- Score
- 72/100
- State rank
- #351
- US rank
- #6098
Category grades
Schools grade is shown separately in the Schools card above.
Census & demographics
- County
- Palm Beach County · 1,438,312 people
- City population
- 148,060
- Metro
- Miami-Fort Lauderdale-Pompano Beach, FL
- Population (ZIP)
- 48,743
- Household income
- $75,789
- Rent vs Own
- Severe rent burden
- 1813.0
Population outlook (Palm Beach County) Hauer SSP2
- Today (2025)
- 1,637,487 people
- By 2030
- 1,743,255 · +6.5%
- By 2040
- 1,948,712 · +19.0%
- By 2050
- 2,132,979 · +30.3%
- By 2075
- 2,530,027 · +54.5%
- By 2100
- 2,706,979 · +65.3%
Race, ethnicity, and origin ACS 2023
- Neighborhood character
- Diverse neighborhood (Simpson 0.64)
- Race & ethnicity
- White 52% Black 24% Hispanic / Latino 19% Two or more races 10% Asian 2%
- Hispanic origin (detail)
- Mexican 2% Puerto Rican 4% Cuban 3% Dominican 1%
- Common ancestry
- Hispanic 12% Romanian 3% Scotch-Irish 2%
- Foreign-born
- 27% · Canada, Jamaica, Vietnam
- Languages at home
- 64% English-only · Spanish 14% French/Haitian/Cajun 13% Other Indo-European 2%
Political lean MEDSL · Palm Beach
- 2024 margin
- Toss-up / Even · D 50.0% · R 49.2%
- 2008→2024 swing
- -22.1pp toward R · 2008: 22.9pp · 2024: 0.8pp
- All cycles
- 2024: D+0.8 2020: D+12.8 2016: D+15.3 2012: D+17.0 2008: D+22.9
Not yet ingested
- Civics
- —
Market trends
- HPI YoY
- ▼ -109.59%
- Current HPI
- 311.7742
- Rent YoY
- ▼ -0.57%
- Metro
- Miami-Fort Lauderdale-Pompano Beach, FL
- State GDP YoY
- ▲ 3.28%
- F500 in state
- 36
Industry mix (Fortune 500 HQ in FL)
| Industry | F500 HQs | Revenue |
|---|---|---|
| Industrial Technology | 2 | $29B |
|
||
| Insurance | 2 | $17B |
|
||
| Retail | 1 | $60B |
|
||
| Technology Distribution | 1 | $58B |
|
||
| Homebuilding | 1 | $35B |
|
||
| Technology Manufacturing | 1 | $35B |
|
||
Price history
+148.9% since first listed5 events — show timeline
- 2026-06-06 Listed $169,000 Beaches MLS
- 2014-03-31 Listing Removed — Beaches MLS
- 2014-02-07 Listed $64,900 Beaches MLS
- 2013-02-28 Listing Removed — Beaches MLS
- 2012-02-28 Listed $67,900 Beaches MLS
Property tax history
+2.0%/yrLatest (2025): $829 · +3.1% YoY. Source: county tax records.
Cash-flow waterfall
monthlySold comps — $/sqft
last 12 mo · ≤1 miLoading sold comps…