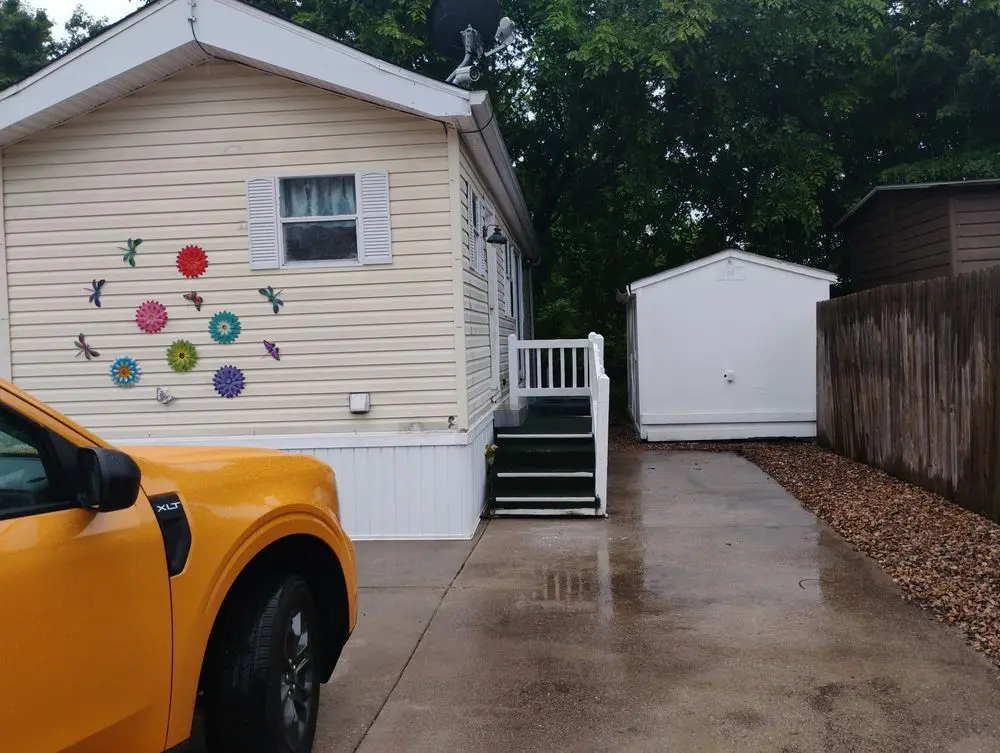
444 Monarch Dr · Branson, MO
Flood risk 1/10 · Minimal
- FEMA flood zone
- X (unshaded)
- Chance of flooding over 30 yrs
- 0.0%
- Est. flood insurance / yr
- $473 – $860
Fire risk 3/10 · Minor
- Est. fire insurance / yr
- $1,054 – $1,958
Heat risk 6/10 · Moderate
- Hot days now (above 105°F)
- 7 days/yr
- Hot days in 30 yrs
- 22 days/yr
Wind risk 2/10 · Minimal
- Chance of severe wind over 30 yrs
- 1.0%
Air-quality risk 2/10 · Minimal
- Unhealthy air days now
- 0 days/yr
- Unhealthy air days in 30 yrs
- 1 days/yr
Risk factors via First Street. Map © Google.
Why this score? — see what drove the C grade
The composite is a weighted blend of 9 inputs, each scored 0–100. Each bar is that input's sub-score; the figure is the points it added to the 100-point composite (weight × sub-score).
- Cash flow +21.8/30.0
- ARV discount +10.4/15.0
- DSCR +7.0/10.0
- 1% rule +4.4/10.0
- Schools +4.2/10.0
- Livability +3.9/5.0
- Rent growth +3.2/5.0
- Condition / age +2.5/5.0
- Appreciation +0.0/10.0
$98,000
🖨 Deal sheet 📄 Offer letter ✓ Due diligence
Listing remarks MLS
Escape to your perfect getaway in the heart of Branson or seize an incredible investment opportunity with this charming Park Model unit in the picturesque Fall Creek RV Estates. Recently updated with fresh paint, new flooring, and improved ducting, this home is ready for your final touches. A spacious loft, full main bedroom, and generous living area provide ample room for relaxation and entertaining. Plus, a large storage shed offers extra convenience to store all those toys. With a few personal touches, this property has endless potential to become your dream retreat or a sought-after rental. Don't miss out on this hidden gem!
Key facts
- Extra parking
- Close to lakes
- On a resort
Tags
Property features AI
Exterior
- Home design: House
- Construction: 408 square feet of living area
- Exterior features: Lot area of approximately 2,612 sq ft
Neighborhood map
What this means for you Summary
Snapshot
- This is a 1-bed/1.0-bath manufactured listed at $98k.
Deal economics
- At list price, monthly cash flow is $152 ($2k/yr) — positive.
- The deal already cash-flows at list — no discount required.
- To meet the 1% rule (rent ≥ 1% of price), the offer needs to be $92k (5.8% below list).
- Recommended offer: $92k (5.8% below list) — sets the bar for 1% rule.
- Cap rate 8.2% vs local median 2.5% in Branson — top-decile yield for the area; either an underpriced asset or a hidden risk that comps aren't pricing in. Stress-test before assuming the spread holds.
Location & tenants
- Location reads 77/100 on livability (#32 in MO, #2,940 nationally) — a middle-class / working-renter tenant base. Strengths: commute A+, cost of living A+, health & safety A+; Watch: employment C-, crime F.
- Branson R-IV (rural): math 48% / reading 52% proficiency, ranked #44 of 324 in MO (top 14%) — acceptable for families but not a draw, mixed tenant base, ~2y average lease.
- Market conditions: Rents rising (+2.9%/yr); 1048 active listings in the ZIP; 1 comparable units currently listed for rent nearby; 331 units permitted in Taney County in 2024 (50 in 5+ unit buildings).
Forward outlook
- Local home prices are declining (-3.0%/yr); year-one equity from $678 of loan paydown is wiped out by about $3k of value loss. Plan a longer hold.
- Taney County population projected at +17% by 2050 — long-run rental-demand tailwind backs the buy-and-hold thesis.
Negotiation context
- Only 14 days on market — expect competitive offers; lowballing is unlikely to land.
- 2 sale attempts with the ask held roughly flat each time — persistent listings suggest the price (not the market) is what's stuck; bring a comps-based counter.
Risks & watch-outs
- Climate carrying-cost: extreme-heat days projected 7→22/yr by 2055 (HVAC capex compounding) — expect insurance premiums to compound above CPI over the hold.
Questions for the listing agent
- Is there a deadline driving the sale (1031 exchange, divorce, estate, relocation)? That informs how much negotiation room exists.
- Crime grade is F in this area — have there been break-ins, vandalism, or insurance claims at this property in the last 3 years? What carrier currently insures it and at what premium?
- What's the average days-on-market for RENTAL listings here right now (not sales)? A rising rental-DOM trend means longer vacancies and softer asking-rent achievability than the comps imply.
- What's the recent tenant-quality profile in this submarket — average credit score on applications, eviction rate, late-payment / NSF rate, and stable-employment percentage? A property-management company in the area should have these aggregated.
- How much new for-sale + rental construction is in the pipeline within 1–3 miles? Heavy new supply typically softens prices + rents 12–24 months out; constrained supply supports both.
Investment metrics
- 1% rule
- 0.94% ✗
- Cap rate
- 8.16%
- Cash-on-cash
- 6.66%
- DSCR
- 1.30
- GRM
- 8.8
CMA / ARV
- ARV (on-the-fly)
- $104,856
- Comps found
- 6
Show comp detail 6 sales within ~0.75 mi
| Address | Dist | Beds/Ba | Sqft | Sold | Price | $/sf | Match |
|---|---|---|---|---|---|---|---|
| 207 Sunshine Cir | 0.26mi | 1/1.0 | 396 (-3%) | 1mo | $114,000 | $288 | 82 |
| 444 Monarch Dr | 0.00mi | 2/1.0 (+1) | 408 (0%) | 16mo | $55,000 | $135 | 82 |
| 136 Estate Cir Cir | 0.06mi | 2/1.0 (+1) | 408 (0%) | 15mo | $103,900 | $255 | 80 |
| 205 Sunshine Cir | 0.26mi | 1/1.0 | 408 (0%) | 14mo | $104,900 | $257 | 76 |
| 406 Monarch Dr | 0.13mi | 1/1.0 | 358 (-12%) | 11mo | $95,000 | $265 | 64 |
| 221 Blue Bird Ln | 0.11mi | 1/1.0 | 360 (-12%) | 20mo | $49,500 | $138 | 58 |
Match score weights: distance 35% · size 25% · config 20% · recency 20%. Top-matched comps best support the ARV.
Projected returns pro-forma
-3.0% appreciation · 2.9% rent growth · sell at horizon
- IRR
- -6.2%
- Equity multiple
- 0.77×
- Total profit
- $-6,315
- Equity at exit
- $14,612
- IRR
- 3.3%
- Equity multiple
- 1.23×
- Total profit
- $6,424
- Equity at exit
- $8,473
Cash invested: $27,440 (down + closing). Projections, not guarantees.
Landlord ↔ Tenant lean methodology
- Overall (STATE)
- 81 Strongly Landlord-Friendly
- State Missouri
- 81 Strongly Landlord-Friendly · R+10
- County
- — inherits STATE
- City
- — inherits STATE
ZIP-level market 65616
- Home prices YoY
- -24.3%
- Rents YoY
- 2.9%
- Active inventory
- 1048
- Price-to-rent
- 8.8×
Monthly cashflow live
- Estimated rent
- $923 medium interval (Pro) →
- Mortgage (P&I)
- −$514
- Tax from tax record
- −$22 /mo · $263/yr
- Insurance
- −$41
- HOA
- −$0
- Vacancy / Maint / Mgmt
- −$194
- Net cashflow
- $152
Break-even live
UW: 25.0% down · 7.5% · 30yr · 1.5% tax · 5.0% vac · 8.0% maint · 8.0% mgmt
Financing live
Cash to close
- Down payment
- $24,500
- Closing costs
- $2,940
- Reserves months
- —
- Total cash needed
- —
Loan-product check · same deal, 3 products live
Conventional
25% down · 7.5% · 30yr
- Down + closing
- —
- Monthly P&I
- —
- Monthly cashflow
- —
- DSCR
- —
- Eligible?
- —
Personal DTI + credit; lowest rate.
DSCR
20% down · 8.5% · 30yr
- Down + closing
- —
- Monthly P&I
- —
- Monthly cashflow
- —
- DSCR
- —
- Eligible?
- —
No personal income docs; deal must DSCR.
Hard money
10% down · 12.0% · 12mo
- Down + closing
- —
- Monthly P&I
- —
- Monthly cashflow
- —
- DSCR
- —
- Eligible?
- —
Short-term bridge; refi at stabilization.
Rent comps 1 comps
| Address | Beds | Baths | Sqft | Rent | $/sqft | DOM | Units | Dist |
|---|---|---|---|---|---|---|---|---|
| 8669 Historic State Highway 165 Hollister, MO | — | 1.0 | 336 | $650 | $1.93 | 43d | 1 | 1.15mi |
Listing history 11 events
-
2026-06-19days on market $98,000 Active 14 DOM
-
2026-06-18days on market $98,000 Active 13 DOM
-
2026-06-17days on market $98,000 Active 12 DOM
-
2026-06-16days on market $98,000 Active 11 DOM
-
2026-06-15days on market $98,000 Active 10 DOM
-
2026-06-14days on market $98,000 Active 8 DOM
-
2026-06-12days on market $98,000 Active 7 DOM
-
2026-06-09days on market $98,000 Active 4 DOM
-
2026-06-08days on market $98,000 Active 3 DOM
-
2026-06-07remarks 362-char remark
-
2026-06-07$98,000 Active 2 DOM
ⓘ Source: listings_history table (triggers on properties + properties_extension) + one-shot
backfill from property_details.listing_events for pre-trigger history.
Tax reassessment forecast MO · Resets to sale price
- Current annual tax
- $263 · $22/mo
- Projected year-2 tax
- $951 · $79/mo
- Expected delta
- +$688/yr (+$57/mo · 261.6%)
ⓘ Screening estimate from a state-policy table — verify with the county assessor before closing.
Climate risk First Street
- Flood 1/10 Low FEMA zone X (unshaded) · 0% chance over 30 yrs
- Wildfire 3/10 Moderate
- Heat 6/10 Major 7 d/yr ≥105°F today · 22 d/yr by 30 yrs out
- Wind 2/10 Low 100% chance of damaging wind over 30 yrs
- Air quality 2/10 Low 0 unhealthy d/yr today · 1 by 30 yrs out
Nearby sold comps map
Loading sold comps map…
Walkable amenities ~0.75 mi
Loading nearby amenities…
Taxation est. · year 1
- Rental income
- $11,074
- − Mortgage interest
- −$5,490
- − Property taxes
- −$263
- − Insurance
- −$490
- − Repairs & maintenance
- −$886
- − Management
- −$886
- − Depreciation
- −$2,851
- Taxable income
- $209
- Est. tax owed @ 24.0%
- −$50
- After-tax cash flow
- $1,778/yr
For passive investors: Depreciation is non-cash, so a rental often shows a tax loss while cash-flowing — sheltering income. Rental losses are passive: they offset passive income freely, and up to $25,000/yr can offset ordinary (W-2) income if you actively participate and your MAGI is under $100k (phasing out to $0 by $150k); unused losses carry forward. On sale, claimed depreciation is recaptured at up to 25%, and gains may owe capital-gains tax (a 1031 exchange can defer both). Figures are a year-1 estimate at your 24.0% rate — not tax advice; consult a CPA.
Schools (NCES district)
- District
- Branson R-IV
- NCES district ID
- 2905760
- Math proficiency
- 48% ▼ -6.00%
- Reading proficiency
- 52% ▼ -3.00%
- Median HH income
- $41,473
- Composite
- 41.96/100
- National rank
- #3347
- State rank
- #44 of 324 in MO
Livability — Branson
- Score
- 77/100
- State rank
- #32
- US rank
- #2940
Category grades
Schools grade is shown separately in the Schools card above.
Census & demographics
- Census place
- Branson, MO
- County
- Taney County · 28,460 people
- City population
- 28,460
- Metro
- Branson, MO
- Population (ZIP)
- 28,460
- Household income
- $60,489
- Rent vs Own
- Severe rent burden
- 1065.0
Population outlook (Taney County) Hauer SSP2
- Today (2025)
- 59,017 people
- By 2030
- 61,235 · +3.8%
- By 2040
- 65,225 · +10.5%
- By 2050
- 68,842 · +16.6%
- By 2075
- 77,705 · +31.7%
- By 2100
- 82,002 · +38.9%
Race, ethnicity, and origin ACS 2023
- Neighborhood character
- Predominantly White (82%)
- Race & ethnicity
- White 82% Two or more races 10% Hispanic / Latino 10% Black 2% Asian 2%
- Hispanic origin (detail)
- Mexican 6% Puerto Rican 2%
- Common ancestry
- Italian 4% Lithuanian 3% Slovak 2%
- Foreign-born
- 5% · Canada
- Languages at home
- 89% English-only · Spanish 7% Other Indo-European 1% Russian/Polish/Slavic 1%
Political lean MEDSL · Taney
- 2024 margin
- Solid R (+59.3) · D 19.9% · R 79.2%
- 2008→2024 swing
- -22.2pp toward R · 2008: -37.2pp · 2024: -59.3pp
- All cycles
- 2024: R+59.3 2020: R+57.7 2016: R+59.3 2012: R+47.4 2008: R+37.2
Not yet ingested
- Civics
- —
Market trends
- HPI YoY
- ▼ -64.45%
- Current HPI
- 200.8392
- Rent YoY
- ▲ 2.90%
- Metro
- Branson, MO
- State GDP YoY
- ▲ 1.84%
- F500 in state
- 20
Industry mix (Fortune 500 HQ in MO)
| Industry | F500 HQs | Revenue |
|---|---|---|
| Healthcare | 1 | $163B |
|
||
| Insurance | 1 | $21B |
|
||
| Industrial Technology | 1 | $17B |
|
||
| Retail | 1 | $16B |
|
||
| Industrial Distribution | 1 | $10B |
|
||
| Utilities | 1 | $9B |
|
||
Price history
+78.2% since first listed8 events — show timeline
- 2026-06-05 Listed $98,000 ForSaleByOwner.com
- 2025-02-20 Sold (Public Records) — Public Records
- 2025-02-18 Sold (MLS) — SOMO
- 2025-01-30 Pending — SOMO
- 2025-01-30 Listed $55,000 SOMO
- 2003-04-04 Sold (Public Records) — Public Records
- 2003-01-27 Sold (Public Records) — Public Records
- 1994-10-11 Sold (Public Records) — Public Records
Property tax history
+0.2%/yrLatest (2025): $263 · +3.7% YoY. Source: county tax records.
Cash-flow waterfall
monthlySold comps — $/sqft
last 12 mo · ≤1 miLoading sold comps…