3464 Bremond St · Houston, TX
Flood risk No data
- FEMA flood zone
- —
- Chance of flooding over 30 yrs
- —
- Est. flood insurance / yr
- —
Fire risk No data
- Est. fire insurance / yr
- —
Heat risk No data
- Hot days now (above threshold)
- —
- Hot days in 30 yrs
- —
Wind risk No data
- Chance of severe wind over 30 yrs
- —
Air-quality risk No data
- Unhealthy air days now
- —
- Unhealthy air days in 30 yrs
- —
Risk factors via First Street. Map © Google.
Why this score? — see what drove the D grade
The composite is a weighted blend of 9 inputs, each scored 0–100. Each bar is that input's sub-score; the figure is the points it added to the 100-point composite (weight × sub-score).
- Cash flow +11.7/30.0
- ARV discount +10.9/15.0
- 1% rule +3.7/10.0
- Livability +3.7/5.0
- DSCR +3.4/10.0
- Schools +2.7/10.0
- Condition / age +2.5/5.0
- Rent growth +2.4/5.0
- Appreciation +0.0/10.0
$404,000
🖨 Deal sheet (PDF) 📄 Offer letter ✓ Due diligence
Listing remarks MLS
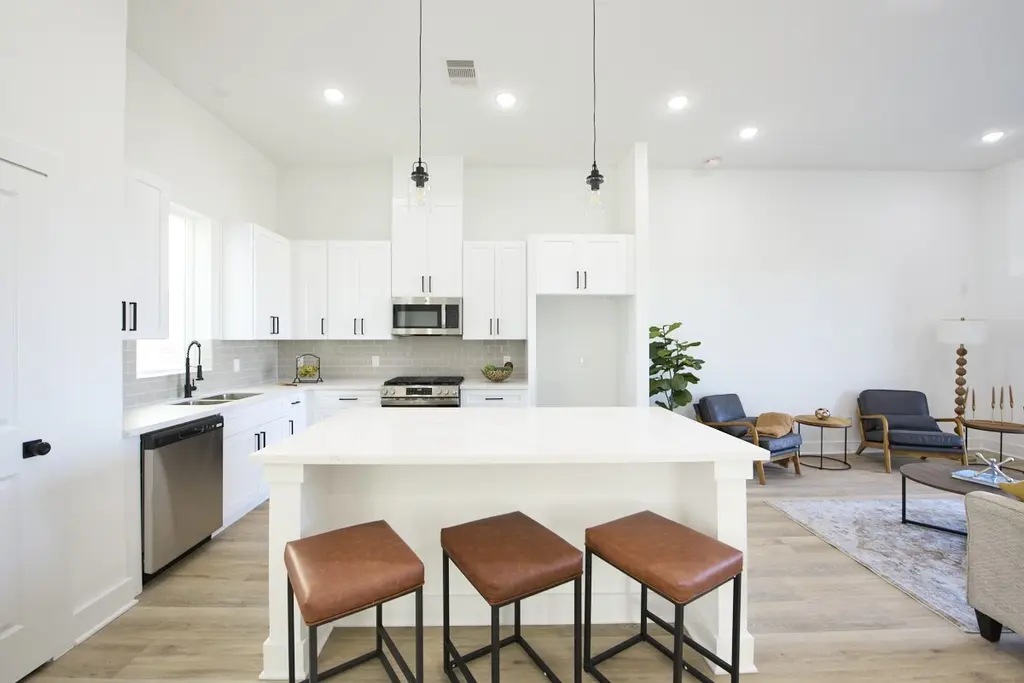
Modern 3-Story Home with High-End Finishes & Private Yard This beautifully designed home features an open layout, quartz countertops, and luxury vinyl plank flooring throughout. The sleek kitchen flows into bright living spaces, perfect for entertaining. Each bedroom has its own en-suite bath, and the primary suite offers a walk-in closet and spa-style bathroom. Enjoy your own private yard, ideal for relaxing or entertaining. Located just minutes from Downtown and the Med Center. Just 3 units left!!! Hurry today to book your appointment to view these beautiful properties!
Key facts
- Quartz countertops
- Bright living spaces
- Private yard
Tags
Neighborhood map
What this means for you Summary
Snapshot
- This is a 3-bed/2.0-bath single-family listed at $404k.
Deal economics
- At list price, monthly cash flow is $-117 ($-1k/yr) — negative.
- To cash-flow at today's rent, offer at most $383k (5.1% below list).
- To meet the 1% rule (rent ≥ 1% of price), the offer needs to be $351k (13.0% below list).
- Recommended offer: $351k (13.0% below list) — sets the bar for 1% rule.
- Cap rate 5.9% vs local median 3.2% in Houston — top-decile yield for the area; either an underpriced asset or a hidden risk that comps aren't pricing in. Stress-test before assuming the spread holds.
Location & tenants
- Location reads 74/100 on livability (#184 in TX, #4,771 nationally) — a middle-class / working-renter tenant base. Strengths: amenities A+, cost of living A+, housing A+; Watch: crime F.
- Houston ISD (urban): math 27% / reading 35% proficiency, ranked #593 of 826 in TX (top 72%) — families likely to look elsewhere, expect single-tenant / working-renter base with shorter leases; 71% free/reduced lunch — lower-income household profile, screen leases tightly.
- Zoned schools: Blackshear El (math 27% / reading 32%, grade F, #2,525 of 4,322 statewide, top 62%, 308 students, 99% FRL); Cullen Middle (math 6% / reading 14%, grade F, #1,641 of 1,662 statewide, top 99%, 324 students, 100% FRL); Yates H S (math 12% / reading 23%, grade F, #1,451 of 1,632 statewide, top 89%, 851 students, 96% FRL) — zoned schools average 98% FRL vs 71% district-wide (27 pts higher); higher-poverty schools than district average — tighter screening recommended.
- Zoned-school proficiency averages 19% at this address vs 31% district-wide (-12 pts) — the specific schools serving this property underperform the Houston ISD average; the district grade overstates school quality for this exact location.
- Market conditions: Rents soft (-0.3%/yr); 585 active listings in the ZIP; 34 comparable units currently listed for rent nearby; rentals at typical pace (median 24d on market — plan ~3-4 weeks tenant-placement turnaround); 29,883 units permitted in Harris County in 2024 (8,621 in 5+ unit buildings).
- At $3,514/mo this rent would consume 59% of the median local household income ($71k/yr) (locally 3072% of renters already pay >50% of income on rent) — very limited rent-growth headroom before tenants either downsize or default.
Forward outlook
- Local home prices are declining (-3.0%/yr); year-one equity from $3k of loan paydown is wiped out by about $12k of value loss. Plan a longer hold.
- Harris County population projected at +47% by 2050 — long-run rental-demand tailwind backs the buy-and-hold thesis.
Negotiation context
- It's been on market 73 days — a 6% lower offer ($380k) is reasonable based on typical stale-listing flexibility.
- 2 sale attempts with the ask held roughly flat each time — persistent listings suggest the price (not the market) is what's stuck; bring a comps-based counter.
Questions for the listing agent
- What do current leases actually rent for vs. the listed asking? Can we see a recent rent roll and the last 12 months of T-12 income?
- It's been on market 73 days. Have you received any prior offers? Is the seller open to a 13% concession, seller financing, or rate buy-down credit?
- Why hasn't it sold? Are there any deal-killer items the seller is aware of (foundation, flood, title, zoning, code violations)?
- Is there a deadline driving the sale (1031 exchange, divorce, estate, relocation)? That informs how much negotiation room exists.
- Schools are D-rated, which usually means shorter tenancies and higher turnover. Who's the typical renter profile here, and what's been the actual vacancy rate?
- Crime grade is F in this area — have there been break-ins, vandalism, or insurance claims at this property in the last 3 years? What carrier currently insures it and at what premium?
- The area grade is low — what's the realistic commute time and amenity access for the typical tenant pool here? Any planned neighborhood developments (good or bad) we should know about?
- What's the average days-on-market for RENTAL listings here right now (not sales)? A rising rental-DOM trend means longer vacancies and softer asking-rent achievability than the comps imply.
- What's the recent tenant-quality profile in this submarket — average credit score on applications, eviction rate, late-payment / NSF rate, and stable-employment percentage? A property-management company in the area should have these aggregated.
- How much new for-sale + rental construction is in the pipeline within 1–3 miles? Heavy new supply typically softens prices + rents 12–24 months out; constrained supply supports both.
Investment metrics
- 1% rule
- 0.87% ✗
- Cap rate
- 5.94%
- Cash-on-cash
- -1.25%
- DSCR
- 0.94
- GRM
- 9.6
CMA / ARV
- ARV (median comp)
- $436,520
- List price
- $404,000
- Delta
- -7.45%
- Verdict
- FAIR
- Comps
- 20 within 1.0 mi
Show comp detail 12 sales within ~0.75 mi
| Address | Dist | Beds/Ba | Sqft | Sold | Price | $/sf | Match |
|---|---|---|---|---|---|---|---|
| 3413 Mcgowen St | 0.13mi | 3/2.5 | 2,336 (-9%) | 1mo | $439,000 | $188 | 75 |
| 3034 Bremond St | 0.48mi | 3/3.5 | 2,275 (-12%) | 1mo | $299,900 | $132 | 52 |
| 1215 Sampson St | 0.67mi | 3/3.5 | 2,347 (-9%) | 1mo | $499,000 | $213 | 47 |
| 2115 Sauer St | 0.61mi | 4/4.0 (+1) | 2,529 (-2%) | 12mo | $659,000 | $261 | 45 |
| 2807 Delano St | 0.67mi | 3/3.5 | 2,340 (-9%) | 4mo | $630,000 | $269 | 44 |
| 2602 Briley St | 0.47mi | 3/3.5 | 2,241 (-13%) | 9mo | $499,000 | $223 | 43 |
| 3010 Bell St | 0.65mi | 3/3.5 | 2,287 (-11%) | 6mo | $499,000 | $218 | 40 |
| 3012 Bell St | 0.66mi | 3/3.5 | 2,287 (-11%) | 6mo | $499,000 | $218 | 39 |
| 2117 Sauer | 0.61mi | 4/4.5 (+1) | 2,776 (+8%) | 8mo | $559,000 | $201 | 38 |
| 1520 Palmer St | 0.62mi | 4/3.5 (+1) | 2,378 (-8%) | 12mo | $415,000 | $175 | 37 |
| 3008 Bell St | 0.64mi | 3/3.5 | 2,287 (-11%) | 12mo | $535,500 | $234 | 35 |
| 1205 Sampson St | 0.69mi | 3/3.5 | 2,240 (-13%) | 8mo | $425,000 | $190 | 34 |
Match score weights: distance 35% · size 25% · config 20% · recency 20%. Top-matched comps best support the ARV.
Projected returns pro-forma
-3.0% appreciation · 0.0% rent growth · sell at horizon
- IRR
- -21.9%
- Equity multiple
- 0.27×
- Total profit
- $-83,132
- Equity at exit
- $60,238
- IRR
- -25.8%
- Equity multiple
- -0.07×
- Total profit
- $-121,358
- Equity at exit
- $34,931
Cash invested: $113,120 (down + closing). Projections, not guarantees.
Landlord ↔ Tenant lean methodology
- Overall (STATE)
- 87 Strongly Landlord-Friendly
- State Texas
- 87 Strongly Landlord-Friendly · R+5
- County
- — inherits STATE
- City
- — inherits STATE
ZIP-level market 77004
- Rents YoY
- -0.3%
- Active inventory
- 585
- Price-to-rent
- 9.6×
Monthly cashflow live
- Estimated rent
- $3,514 high interval (Pro) →
- Mortgage (P&I)
- −$2,119
- Tax from tax record
- −$607 /mo · $7,283/yr
- Insurance
- −$168
- HOA
- −$0
- Vacancy / Maint / Mgmt
- −$738
- Net cashflow
- $-117
Break-even live
Sensitivity live
| Price | -10% $111 | -5% $-3 | +0% $-117 | +5% $-232 | +10% $-346 |
|---|---|---|---|---|---|
| Rent | -10% $-395 | -5% $-256 | +0% $-117 | +5% $21 | +10% $160 |
| Rate | -1.0pp $86 | -0.5pp $-15 | base $-117 | +0.5pp $-222 | +1.0pp $-329 |
UW: 25.0% down · 7.5% · 30yr · 1.5% tax · 5.0% vac · 8.0% maint · 8.0% mgmt
Financing live
Cash to close
- Down payment
- $101,000
- Closing costs
- $12,120
- Reserves months
- —
- Total cash needed
- —
Loan-product check · same deal, 3 products live
Conventional
25% down · 7.5% · 30yr
- Down + closing
- —
- Monthly P&I
- —
- Monthly cashflow
- —
- DSCR
- —
- Eligible?
- —
Personal DTI + credit; lowest rate.
DSCR
20% down · 8.5% · 30yr
- Down + closing
- —
- Monthly P&I
- —
- Monthly cashflow
- —
- DSCR
- —
- Eligible?
- —
No personal income docs; deal must DSCR.
Hard money
10% down · 12.0% · 12mo
- Down + closing
- —
- Monthly P&I
- —
- Monthly cashflow
- —
- DSCR
- —
- Eligible?
- —
Short-term bridge; refi at stabilization.
Rent comps 34 comps
| Address | Beds | Baths | Sqft | Rent | $/sqft | DOM | Units | Dist |
|---|---|---|---|---|---|---|---|---|
| 3518 Dennis St Unit 1387517P Houston, TX | 4.0 | 4.0 | 2271 | $5,657 | $2.49 | 0d | 1 | 0.11mi |
| 3517 McIlhenny St Houston, TX | 3.0 | 3.5 | 2000 | $3,200 | $1.60 | 5d | 1 | 0.12mi |
| 3335 Tuam St Houston, TX | 2.0 | 1.0 | 2300 | $995 | $0.43 | 45d | 1 | 0.22mi |
| 3719 Elgin St Houston, TX | 1.0–5.0 | 1.0–5.0 | 1241 | $1,374 | $1.11 | 26d | 14 | 0.33mi |
| 3034 Gray St Houston, TX | 3.0 | 3.0 | 2081 | $3,000 | $1.44 | 45d | 1 | 0.53mi |
| 3507 Canfield St Houston, TX | 3.0 | 2.5 | 2200 | $2,350 | $1.07 | 26d | 1 | 0.58mi |
| 3131 Leeland St Houston, TX | 3.0 | 3.5 | 1966 | $2,850 | $1.45 | 26d | 1 | 0.61mi |
| 4001 Dallas St Unit 1029264P Houston, TX | 3.0 | 3.0 | 2174 | $5,220 | $2.40 | 0d | 1 | 0.81mi |
| 3226 McKinney St Houston, TX | 3.0 | 3.0 | 2274 | $2,500 | $1.10 | 45d | 1 | 0.85mi |
| 2105 McGowen St Unit 1244936P Houston, TX | 3.0 | 3.5 | 2497 | $4,371 | $1.75 | 0d | 1 | 1.01mi |
| 2103 McGowen St Unit 1244937P Houston, TX | 3.0 | 3.5 | 2292 | $4,732 | $2.06 | 0d | 1 | 1.01mi |
| 2107 McGowen St Unit 1244935P Houston, TX | 3.0 | 3.5 | 2497 | $4,711 | $1.89 | 4d | 1 | 1.01mi |
| 2109 McGowen St Unit 1244934P Houston, TX | 3.0 | 3.5 | 2497 | $4,245 | $1.70 | 0d | 1 | 1.01mi |
| 2519 Saint Emanuel St Unit 1241246P Houston, TX | 3.0 | 3.0 | 2389 | $2,621 | $1.10 | 0d | 1 | 1.03mi |
| 2521 Saint Emanuel St Unit 1047945P Houston, TX | 3.0 | 3.0 | 2292 | $2,727 | $1.19 | 0d | 1 | 1.03mi |
| 2326 St Emanuel St Houston, TX | 3.0 | 3.5 | 2642 | $2,601 | $0.98 | 9d | 1 | 1.05mi |
| 2816 Rusk St Houston, TX | 3.0 | 3.5 | 2107 | $2,800 | $1.33 | 45d | 1 | 1.08mi |
| 3213 Saint Emanuel St Houston, TX | 4.0 | 3.5 | 2100 | $3,300 | $1.57 | 18d | 1 | 1.13mi |
| 4306 Ennis St Houston, TX | 3.0 | 3.0 | 1989 | $2,500 | $1.26 | 45d | 1 | 1.17mi |
| 3405 St Emanuel St Houston, TX | 4.0 | 5.0 | 2388 | $2,900 | $1.21 | 45d | 1 | 1.18mi |
| 2504 Rusk St Unit 1563174P Houston, TX | 2.0 | 2.0 | 1819 | $4,036 | $2.22 | 4d | 1 | 1.19mi |
| 3535 Wentworth St Houston, TX | 4.0 | 3.0 | 2600 | $2,650 | $1.02 | 23d | 1 | 1.20mi |
| 2209 Alabama St Unit B Houston, TX | 3.0 | 2.5 | 2074 | $2,350 | $1.13 | 45d | 1 | 1.21mi |
| 2357 Jackson St Houston, TX | 3.0 | 2.5 | 1908 | $2,500 | $1.31 | 23d | 1 | 1.27mi |
| 3010 Chenevert St Unit 3010 Houston, TX | 3.0 | 3.5 | 3203 | $8,000 | $2.50 | 45d | 1 | 1.31mi |
| 3010 Chenevert St Unit 1019638P Houston, TX | 3.0 | 3.5 | 3196 | $7,988 | $2.50 | 9d | 1 | 1.31mi |
| 2311 Eagle St Houston, TX | 3.0 | 4.0 | 1783 | $2,500 | $1.40 | 45d | 1 | 1.32mi |
| 4952 Polk St Unit 1531100P Houston, TX | 1.0–2.0 | 1.0–2.0 | 1258 | $2,285 | $1.82 | 0d | 2 | 1.34mi |
| 4952 Polk St Unit 1531107P Houston, TX | 2.0 | 2.0 | 1980 | $2,327 | $1.18 | 9d | 1 | 1.34mi |
| 2809 Crawford St Houston, TX | 2.0 | 2.0 | 1928 | $2,600 | $1.35 | 45d | 1 | 1.36mi |
| 2703 Blodgett St Unit 1047952P Houston, TX | 1.0–5.0 | 1.5–5.5 | 2497 | $12,804 | $5.13 | 0d | 2 | 1.40mi |
| 2416 La Branch St Houston, TX | 3.0 | 4.0 | 2540 | $2,900 | $1.14 | 45d | 1 | 1.43mi |
| 1915 Cleburne St Houston, TX | 2.0 | 1.0 | 2766 | $1,800 | $0.65 | 45d | 1 | 1.46mi |
| 2721 Austin St Houston, TX | 3.0 | 4.0 | 2607 | $3,000 | $1.15 | 26d | 1 | 1.48mi |
Listing history 16 events
-
2026-06-21days on market $404,000 Active 73 DOM
-
2026-06-18days on market $404,000 Active 70 DOM
-
2026-06-17days on market $404,000 Active 69 DOM
-
2026-06-16days on market $404,000 Active 68 DOM
-
2026-06-15days on market $404,000 Active 67 DOM
-
2026-06-13days on market $404,000 Active 65 DOM
-
2026-06-10days on market $404,000 Active 61 DOM
-
2026-06-08days on market $404,000 Active 60 DOM
-
2026-06-07days on market $404,000 Active 59 DOM
-
2026-06-04days on market $404,000 Active 56 DOM
-
2026-06-01days on market $404,000 Active 53 DOM
-
2026-05-31days on market $404,000 Active 52 DOM
-
2026-05-14status Active 583-char remark
Show marketing remark (583 chars)
Modern 3-Story Home with High-End Finishes & Private Yard This beautifully designed home features an open layout, quartz countertops, and luxury vinyl plank flooring throughout. The sleek kitchen flows into bright living spaces, perfect for entertaining. Each bedroom has its own en-suite bath, and the primary suite offers a walk-in closet and spa-style bathroom. Enjoy your own private yard, ideal for relaxing or entertaining. Located just minutes from Downtown and the Med Center. Just 3 units left!!! Hurry today to book your appointment to view these beautiful properties!
-
2026-03-29status Pending 583-char remark
Show marketing remark (583 chars)
Modern 3-Story Home with High-End Finishes & Private Yard This beautifully designed home features an open layout, quartz countertops, and luxury vinyl plank flooring throughout. The sleek kitchen flows into bright living spaces, perfect for entertaining. Each bedroom has its own en-suite bath, and the primary suite offers a walk-in closet and spa-style bathroom. Enjoy your own private yard, ideal for relaxing or entertaining. Located just minutes from Downtown and the Med Center. Just 3 units left!!! Hurry today to book your appointment to view these beautiful properties!
-
2026-03-18status Pending 583-char remark
Show marketing remark (583 chars)
Modern 3-Story Home with High-End Finishes & Private Yard This beautifully designed home features an open layout, quartz countertops, and luxury vinyl plank flooring throughout. The sleek kitchen flows into bright living spaces, perfect for entertaining. Each bedroom has its own en-suite bath, and the primary suite offers a walk-in closet and spa-style bathroom. Enjoy your own private yard, ideal for relaxing or entertaining. Located just minutes from Downtown and the Med Center. Just 3 units left!!! Hurry today to book your appointment to view these beautiful properties!
-
2026-02-21$404,000 Active 583-char remark
Show marketing remark (583 chars)
Modern 3-Story Home with High-End Finishes & Private Yard This beautifully designed home features an open layout, quartz countertops, and luxury vinyl plank flooring throughout. The sleek kitchen flows into bright living spaces, perfect for entertaining. Each bedroom has its own en-suite bath, and the primary suite offers a walk-in closet and spa-style bathroom. Enjoy your own private yard, ideal for relaxing or entertaining. Located just minutes from Downtown and the Med Center. Just 3 units left!!! Hurry today to book your appointment to view these beautiful properties!
ⓘ Source: listings_history table (triggers on properties + properties_extension) + one-shot
backfill from property_details.listing_events for pre-trigger history.
Tax reassessment forecast TX · Resets to sale price
- Current annual tax
- $7,283 · $607/mo
- Projected year-2 tax
- $7,393 · $616/mo
- Expected delta
- +$110/yr (+$9/mo · 1.5%)
ⓘ Screening estimate from a state-policy table — verify with the county assessor before closing.
Nearby sold comps map
Loading sold comps map…
Walkable amenities ~0.75 mi
Loading nearby amenities…
Taxation est. · year 1
- Rental income
- $42,173
- − Mortgage interest
- −$22,630
- − Property taxes
- −$7,283
- − Insurance
- −$2,020
- − Repairs & maintenance
- −$3,374
- − Management
- −$3,374
- − Depreciation
- −$11,753
- Taxable loss
- −$8,261
- Est. tax savings @ 24.0%
- +$1,983
- After-tax cash flow
- $573/yr
For passive investors: Depreciation is non-cash, so a rental often shows a tax loss while cash-flowing — sheltering income. Rental losses are passive: they offset passive income freely, and up to $25,000/yr can offset ordinary (W-2) income if you actively participate and your MAGI is under $100k (phasing out to $0 by $150k); unused losses carry forward. On sale, claimed depreciation is recaptured at up to 25%, and gains may owe capital-gains tax (a 1031 exchange can defer both). Figures are a year-1 estimate at your 24.0% rate — not tax advice; consult a CPA.
Schools (NCES district)
- District
- Houston ISD
- NCES district ID
- 4823640
- Math proficiency
- 27% ▼ -18.00%
- Reading proficiency
- 35% ▼ -6.00%
- Median HH income
- $46,054
- Composite
- 26.63/100
- National rank
- #7173
- State rank
- #593 of 826 in TX
Livability — Houston
- Score
- 74/100
- State rank
- #184
- US rank
- #4771
Category grades
Schools grade is shown separately in the Schools card above.
Census & demographics
- Census place
- Houston, TX
- County
- Harris County · 4,702,590 people
- City population
- 3,226,434
- Metro
- Houston-The Woodlands-Sugar Land, TX
- Population (ZIP)
- 35,997
- Household income
- $71,199
- Rent vs Own
- Severe rent burden
- 3072.0
Population outlook (Harris County) Hauer SSP2
- Today (2025)
- 5,571,493 people
- By 2030
- 6,089,821 · +9.3%
- By 2040
- 7,142,806 · +28.2%
- By 2050
- 8,185,864 · +46.9%
- By 2075
- 10,574,329 · +89.8%
- By 2100
- 12,109,958 · +117.4%
Race, ethnicity, and origin ACS 2023
- Neighborhood character
- Diverse neighborhood (Simpson 0.68)
- Race & ethnicity
- Black 48% White 27% Hispanic / Latino 13% Two or more races 11% Asian 8%
- Hispanic origin (detail)
- Mexican 9%
- Common ancestry
- Lithuanian 1% Romanian 1% Italian 1%
- Foreign-born
- 14% · Canada, China, South Korea
- Languages at home
- 82% English-only · Spanish 10% Chinese 2% Other Indo-European 2%
Political lean MEDSL · Harris
- 2024 margin
- Lean D (+5.5) · D 52.0% · R 46.4% · Other 1.6%
- 2008→2024 swing
- +3.9pp toward D · 2008: 1.6pp · 2024: 5.5pp
- All cycles
- 2024: D+5.5 2020: D+13.3 2016: D+12.4 2012: D+0.1 2008: D+1.6
Not yet ingested
- Civics
- —
Market trends
- HPI YoY
- ▼ -139.34%
- Current HPI
- 199.6066
- Rent YoY
- ▼ -0.32%
- Metro
- Houston-The Woodlands-Sugar Land, TX
- State GDP YoY
- ▲ 3.95%
- F500 in state
- 110
Industry mix (Fortune 500 HQ in TX)
| Industry | F500 HQs | Revenue |
|---|---|---|
| Energy | 16 | $1,198B |
|
||
| Technology | 5 | $198B |
|
||
| Engineering / Construction | 4 | $72B |
|
||
| Energy Services | 3 | $60B |
|
||
| Utilities | 3 | $41B |
|
||
| Healthcare | 2 | $330B |
|
||
Price history
4 events — show timeline
- 2026-05-14 Relisted — HARMLS
- 2026-03-29 Pending — HARMLS
- 2026-03-18 Pending — HARMLS
- 2026-02-21 Listed $404,000 HARMLS
Property tax history
+420.7%/yrLatest (2025): $7,283 · +420.7% YoY. Source: county tax records.
Cash-flow waterfall
monthlySold comps — $/sqft
last 12 mo · ≤1 miLoading sold comps…