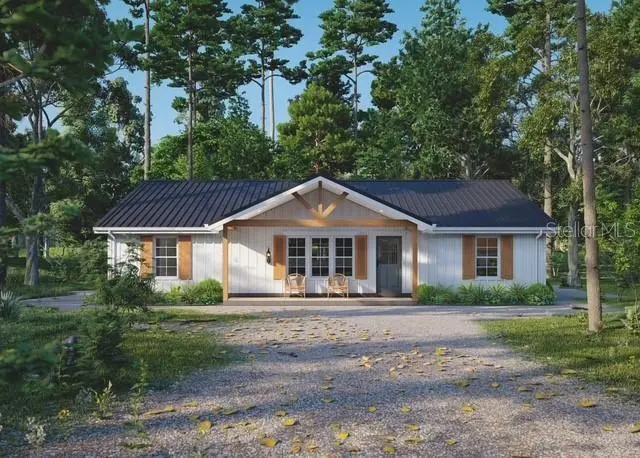
3199 S Kings Ave · Homosassa Springs, FL
Flood risk 9/10 · Severe
- FEMA flood zone
- AE
- Chance of flooding over 30 yrs
- 0.99%
- Est. flood insurance / yr
- $1,737 – $8,500
Fire risk 4/10 · Minor
- Est. fire insurance / yr
- $947 – $1,759
Heat risk 9/10 · Severe
- Hot days now (above 108°F)
- 7 days/yr
- Hot days in 30 yrs
- 25 days/yr
Wind risk 9/10 · Severe
- Chance of severe wind over 30 yrs
- 99.0%
Air-quality risk 1/10 · Minimal
- Unhealthy air days now
- 0 days/yr
- Unhealthy air days in 30 yrs
- 0 days/yr
Risk factors via First Street. Map © Google.
Why this score? — see what drove the D- grade
The composite is a weighted blend of 9 inputs, each scored 0–100. Each bar is that input's sub-score; the figure is the points it added to the 100-point composite (weight × sub-score).
- Cash flow +12.1/30.0
- ARV discount +7.5/15.0
- Schools +4.1/10.0
- DSCR +3.6/10.0
- Livability +3.6/5.0
- 1% rule +3.5/10.0
- Rent growth +2.5/5.0
- Condition / age +2.5/5.0
- Appreciation +0.0/10.0
$235,000
🖨 Deal sheet 📄 Offer letter ✓ Due diligence
Listing remarks
Pre-Construction. To be built. Pre-Construction Custom Home Opportunity! Build Your Dream Home on 3199 S KINGS RD, HOMOSASSA FL This is your chance to own a brand-new custom-built home in a peaceful setting — designed and built exactly the way you want it! The base home starts at just $235,000 and includes a spacious 3-bedroom, 2-bath open-concept floor plan with these desirable features: • Large kitchen island with plenty of cabinet space • Stainless steel appliances (side-by-side refrigerator, dishwasher, microwave, garbage disposal, and stylish range) • Generous primary suite with walk-in closet • Energy-efficient double-pane windows Well and septic are included
Key facts
- 6,250 sq ft lot
- Built 2026
- Listed 77 days
Property features AI
Finance
- Other: Lot size approximately 0.14 acre (0 to less than 1/4 acre)
- Financial info: Unfurnished; Home warranty included; No lease restrictions
- HOA & community: No HOA reported
Exterior
- Parking: No parking details provided
- Security: No security details provided
- Utilities: Well water available; Septic tank sewer; Electricity available; Cable available; Phone available; Water available
- Home design: Single Family Residence; Residential property; One story; New construction (projected completion 2026-09-30); North-facing
- Construction: Vinyl siding; Shingle roof; Built on slab
- Exterior features: Outdoor lighting; Private mailbox; Dirt road access
Interior
- Kitchen: Dishwasher; Disposal; Microwave; Range; Refrigerator; Electric water heater
- Bedrooms: 3 bedrooms
- Flooring: Laminate; Slab foundation
- Bathrooms: 2 full bathrooms
- Heating & cooling: Central heating; Central air
- Interior features: Open floorplan; Split bedroom layout; Thermostat
- Laundry & utility: Inside laundry room; Electric dryer hookup
Neighborhood map
What this means for you Summary
Snapshot
- This is a 3-bed/2.0-bath land listed at $235k.
Deal economics
- At list price, monthly cash flow is $-480 ($-6k/yr) — negative.
- To cash-flow at today's rent, offer at most $166k (29.6% below list).
- To meet the 1% rule (rent ≥ 1% of price), the offer needs to be $199k (15.4% below list).
- Recommended offer: $166k (29.6% below list) — sets the bar for cash-flow.
Location & tenants
- Location reads 71/100 on livability (#391 in FL) — a middle-class / working-renter tenant base. Strengths: cost of living A+, housing A+, health & safety A+; Watch: crime C-, schools F, amenities F.
- Citrus (rural): math 49% / reading 50% proficiency, ranked #44 of 73 in FL (top 60%) — families likely to look elsewhere, expect single-tenant / working-renter base with shorter leases.
- Market conditions: 307 active listings in the ZIP; 1 comparable units currently listed for rent nearby; 2,443 units permitted in Citrus County in 2024 (0 in 5+ unit buildings).
- At $1,988/mo this rent would consume 52% of the median local household income ($46k/yr) (locally 113% of renters already pay >50% of income on rent) — very limited rent-growth headroom before tenants either downsize or default.
Forward outlook
- Local home prices are declining (-3.0%/yr); year-one equity from $2k of loan paydown is wiped out by about $7k of value loss. Plan a longer hold.
- Citrus County population projected to shrink 10% by 2050 — rents likely to lag national; underwrite the cash flow, not the appreciation.
Negotiation context
- It's been on market 78 days — a 6% lower offer ($221k) is reasonable based on typical stale-listing flexibility.
Risks & watch-outs
- Watch-outs: flood insurance adds $427/mo.
- Climate carrying-cost: in FEMA flood zone AE (mandatory federal flood insurance); severe wind risk, 99% chance of damaging wind over 30y; extreme-heat days projected 7→25/yr by 2055 (HVAC capex compounding) — expect insurance premiums to compound above CPI over the hold.
Questions for the listing agent
- What do current leases actually rent for vs. the listed asking? Can we see a recent rent roll and the last 12 months of T-12 income?
- It's been on market 78 days. Have you received any prior offers? Is the seller open to a 30% concession, seller financing, or rate buy-down credit?
- What's the actual annual flood-insurance premium (NFIP or private), and is the property in a SFHA with mandatory coverage?
- Why hasn't it sold? Are there any deal-killer items the seller is aware of (foundation, flood, title, zoning, code violations)?
- Is there a deadline driving the sale (1031 exchange, divorce, estate, relocation)? That informs how much negotiation room exists.
- Schools are F-rated, which usually means shorter tenancies and higher turnover. Who's the typical renter profile here, and what's been the actual vacancy rate?
- The area grade is low — what's the realistic commute time and amenity access for the typical tenant pool here? Any planned neighborhood developments (good or bad) we should know about?
- What's the average days-on-market for RENTAL listings here right now (not sales)? A rising rental-DOM trend means longer vacancies and softer asking-rent achievability than the comps imply.
- What's the recent tenant-quality profile in this submarket — average credit score on applications, eviction rate, late-payment / NSF rate, and stable-employment percentage? A property-management company in the area should have these aggregated.
- How much new for-sale + rental construction is in the pipeline within 1–3 miles? Heavy new supply typically softens prices + rents 12–24 months out; constrained supply supports both.
Investment metrics
- 1% rule
- 0.85% ✗
- Cap rate
- 6.02%
- Cash-on-cash
- -0.98%
- DSCR
- 0.96
- GRM
- 9.9
CMA / ARV
No comps found within radius.
Projected returns pro-forma
-3.0% appreciation · 3.0% rent growth · sell at horizon
- IRR
- -31.6%
- Equity multiple
- -0.04×
- Total profit
- $-68,365
- Equity at exit
- $35,039
- IRR
- -34.6%
- Equity multiple
- -0.49×
- Total profit
- $-97,717
- Equity at exit
- $20,319
Cash invested: $65,800 (down + closing). Projections, not guarantees.
Landlord ↔ Tenant lean methodology
- Overall (STATE)
- 87 Strongly Landlord-Friendly
- State Florida
- 87 Strongly Landlord-Friendly · R+3
- County
- — inherits STATE
- City
- — inherits STATE
ZIP-level market 34448
- Home prices YoY
- -26.1%
- Active inventory
- 307
- Price-to-rent
- 9.9×
Monthly cashflow live
- Estimated rent
- $1,988 medium interval (Pro) →
- Mortgage (P&I)
- −$1,232
- Tax est. 1.5%
- −$294 /mo · $3,525/yr
- Insurance
- −$98
- Flood insurance flood zone
- −$427 /mo · $5,118/yr
- HOA
- −$0
- Vacancy / Maint / Mgmt
- −$417
- Net cashflow
- $-480
Break-even live
UW: 25.0% down · 7.5% · 30yr · 1.5% tax · 5.0% vac · 8.0% maint · 8.0% mgmt
Financing live
Cash to close
- Down payment
- $58,750
- Closing costs
- $7,050
- Reserves months
- —
- Total cash needed
- —
Loan-product check · same deal, 3 products live
Conventional
25% down · 7.5% · 30yr
- Down + closing
- —
- Monthly P&I
- —
- Monthly cashflow
- —
- DSCR
- —
- Eligible?
- —
Personal DTI + credit; lowest rate.
DSCR
20% down · 8.5% · 30yr
- Down + closing
- —
- Monthly P&I
- —
- Monthly cashflow
- —
- DSCR
- —
- Eligible?
- —
No personal income docs; deal must DSCR.
Hard money
10% down · 12.0% · 12mo
- Down + closing
- —
- Monthly P&I
- —
- Monthly cashflow
- —
- DSCR
- —
- Eligible?
- —
Short-term bridge; refi at stabilization.
Rent comps 1 comps
| Address | Beds | Baths | Sqft | Rent | $/sqft | DOM | Units | Dist |
|---|---|---|---|---|---|---|---|---|
| 3844 S Swan Ter Homosassa, FL | 3.0 | 2.0 | 1172 | $1,800 | $1.54 | 21d | 1 | 1.10mi |
Listing history 17 events
-
2026-06-19days on market $235,000 Active 78 DOM
-
2026-06-18days on market $235,000 Active 77 DOM
-
2026-06-17days on market $235,000 Active 76 DOM
-
2026-06-16days on market $235,000 Active 75 DOM
-
2026-06-15days on market $235,000 Active 74 DOM
-
2026-06-14days on market $235,000 Active 72 DOM
-
2026-06-13days on market $235,000 Active 71 DOM
-
2026-06-09days on market $235,000 Active 68 DOM
-
2026-06-08days on market $235,000 Active 67 DOM
-
2026-06-07days on market $235,000 Active 66 DOM
-
2026-06-03days on market $235,000 Active 62 DOM
-
2026-06-02days on market $235,000 Active 61 DOM
-
2026-06-01days on market $235,000 Active 60 DOM
-
2026-05-31days on market $235,000 Active 59 DOM
-
2026-05-30days on market $235,000 Active 58 DOM
-
2026-04-02$235,000 Active
-
2023-08-25soldstatus $218,000
ⓘ Source: listings_history table (triggers on properties + properties_extension) + one-shot
backfill from property_details.listing_events for pre-trigger history.
Climate risk First Street
- Flood 9/10 Extreme FEMA zone AE · 99% chance over 30 yrs
- Wildfire 4/10 Moderate
- Heat 9/10 Extreme 7 d/yr ≥108°F today · 25 d/yr by 30 yrs out
- Wind 9/10 Extreme 99% chance of damaging wind over 30 yrs
- Air quality 1/10 Low 0 unhealthy d/yr today · 0 by 30 yrs out
Nearby sold comps map
Loading sold comps map…
Walkable amenities ~0.75 mi
Loading nearby amenities…
Taxation est. · year 1
- Rental income
- $23,856
- − Mortgage interest
- −$13,164
- − Property taxes
- −$3,525
- − Insurance
- −$6,294
- − Repairs & maintenance
- −$1,908
- − Management
- −$1,908
- − Depreciation
- −$6,836
- Taxable loss
- −$9,780
- Est. tax savings @ 24.0%
- +$2,347
- After-tax cash flow
- $-3,414/yr
For passive investors: Depreciation is non-cash, so a rental often shows a tax loss while cash-flowing — sheltering income. Rental losses are passive: they offset passive income freely, and up to $25,000/yr can offset ordinary (W-2) income if you actively participate and your MAGI is under $100k (phasing out to $0 by $150k); unused losses carry forward. On sale, claimed depreciation is recaptured at up to 25%, and gains may owe capital-gains tax (a 1031 exchange can defer both). Figures are a year-1 estimate at your 24.0% rate — not tax advice; consult a CPA.
Schools (NCES district)
- District
- Citrus
- NCES district ID
- 1200270
- Math proficiency
- 49% ▼ -10.00%
- Reading proficiency
- 50% ▼ -6.00%
- Median HH income
- $38,618
- Composite
- 41.28/100
- National rank
- #3519
- State rank
- #44 of 73 in FL
Livability — Homosassa Springs
- Score
- 71/100
- State rank
- #391
- US rank
- #6877
Category grades
Schools grade is shown separately in the Schools card above.
Census & demographics
- Census place
- Homosassa Springs, FL
- County
- Citrus County · 111,314 people
- Metro
- Homosassa Springs, FL
- Population (ZIP)
- 10,817
- Household income
- $45,916
- Rent vs Own
- Severe rent burden
- 113.0
Population outlook (Citrus County) Hauer SSP2
- Today (2025)
- 138,622 people
- By 2030
- 136,886 · -1.3%
- By 2040
- 132,009 · -4.8%
- By 2050
- 125,196 · -9.7%
- By 2075
- 108,570 · -21.7%
- By 2100
- 84,454 · -39.1%
Race, ethnicity, and origin ACS 2023
- Neighborhood character
- Predominantly White (94%)
- Race & ethnicity
- White 94% Two or more races 3% Hispanic / Latino 3% Black 1%
- Common ancestry
- Slovak 3% Scotch-Irish 2% Lithuanian 2%
- Foreign-born
- 2% · Canada
- Languages at home
- 96% English-only · Spanish 2% Russian/Polish/Slavic 1%
Political lean MEDSL · Citrus
- 2024 margin
- Solid R (+45.9) · D 26.8% · R 72.6%
- 2008→2024 swing
- -29.8pp toward R · 2008: -16.1pp · 2024: -45.9pp
- All cycles
- 2024: R+45.9 2020: R+41.0 2016: R+39.7 2012: R+21.9 2008: R+16.1
Not yet ingested
- Civics
- —
Market trends
- HPI YoY
- ▼ -110.27%
- Current HPI
- 312.4302
- Rent YoY
- —
- Metro
- Homosassa Springs, FL
- State GDP YoY
- ▲ 3.28%
- F500 in state
- 36
Industry mix (Fortune 500 HQ in FL)
| Industry | F500 HQs | Revenue |
|---|---|---|
| Industrial Technology | 2 | $29B |
|
||
| Insurance | 2 | $17B |
|
||
| Retail | 1 | $60B |
|
||
| Technology Distribution | 1 | $58B |
|
||
| Homebuilding | 1 | $35B |
|
||
| Technology Manufacturing | 1 | $35B |
|
||
Price history
+7.8% since first listed2 events — show timeline
- 2026-04-02 Listed $235,000 Stellar MLS as Distributed by MLS Grid
- 2023-08-25 Sold (Public Records) $218,000 Public Records
Property tax history
+8.8%/yrLatest (2025): $132 · +41.5% YoY. Source: county tax records.
Cash-flow waterfall
monthlySold comps — $/sqft
last 12 mo · ≤1 miLoading sold comps…