 7-Plex
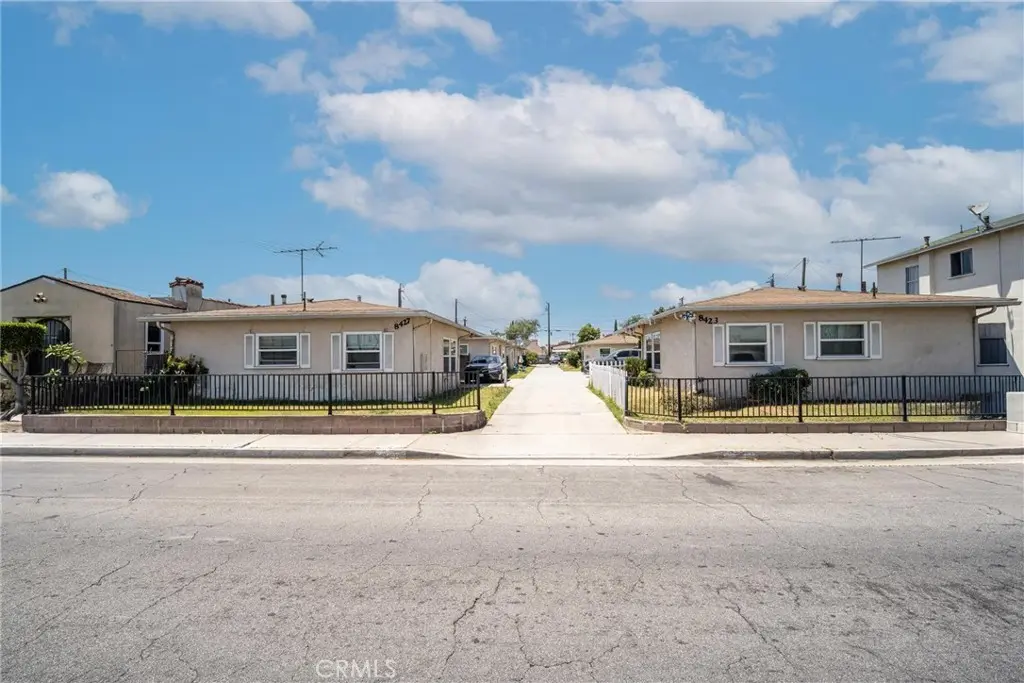
8427 Otis St · South Gate, CA
Flood risk 1/10 · Minimal
- FEMA flood zone
- X (unshaded)
- Chance of flooding over 30 yrs
- 0.0%
- Est. flood insurance / yr
- $507 – $1,088
Fire risk 1/10 · Minimal
- Est. fire insurance / yr
- $659 – $1,223
Heat risk 5/10 · Moderate
- Hot days now (above 91°F)
- 7 days/yr
- Hot days in 30 yrs
- 22 days/yr
Wind risk 1/10 · Minimal
- Chance of severe wind over 30 yrs
- —
Air-quality risk 5/10 · Moderate
- Unhealthy air days now
- 9 days/yr
- Unhealthy air days in 30 yrs
- 9 days/yr
Risk factors via First Street. Map © Google.
Why this score? — see what drove the D- grade
The composite is a weighted blend of 9 inputs, each scored 0–100. Each bar is that input's sub-score; the figure is the points it added to the 100-point composite (weight × sub-score).
- Cash flow +10.8/30.0
- ARV discount +7.5/15.0
- Rent growth +3.7/5.0
- Schools +3.6/10.0
- Livability +3.2/5.0
- DSCR +3.1/10.0
- Condition / age +2.5/5.0
- 1% rule +2.3/10.0
- Appreciation +0.0/10.0
$1,725,000
🖨 Deal sheet 📄 Offer letter ✓ Due diligence
Multi-family units
County records classify this as Multi-Family (2-4 Unit). Listing-text estimate: 7 units. estimate disagrees with records
Listing remarks
This rare 7-unit apartment investment opportunity in South Gate offers investors a well-maintained income property with strong upside potential in one of Southern California’s consistently high-demand rental markets. Built in 1951, the property features approximately 5,466 square feet of rentable space situated on a spacious 19,229 square foot lot. Strategically positioned in a dense rental corridor with historically low vacancy rates, the property provides stable in-place income with the opportunity to increase rents over time and enhance long-term value. The attractive layout features all single-story detached units, creating a desirable living environment for tenants while minimizi
Key facts
- Spacious lot
- Low vacancy rates
- 9,601 sq ft lot
Tags
Property features AI
Finance
- Other: Property contains 7 total units across 9 buildings (per data); Additional parcel references listed
- Financial info: Total building area reported at 5,466 (units not shown in this section); Gross scheduled and gross operating income reported at $114,960; Net operating income reported at $88,060; Gross income reported at $114,960; Gross multiplier 14.96; Operating expenses reported at $26,900 (includes insurance, water/sewer, trash, gardener, maintenance, licenses); Tenant responsibility: gas, cable TV, electricity; Total actual rent reported at $9,580; Unit-level rents vary (examples: $1,000; $1,200; $1,385; $1,505; $1,600)
- HOA & community: Nearby park
Exterior
- Parking: Total of 13 parking spaces; 8 garage spaces; 5 uncovered spaces; Assigned private on-site parking; Each unit includes a garage space (units list 1 garage space each)
- Security: Carbon monoxide and smoke detectors
- Utilities: Public/district water (water connected); Public sewer (sewer connected); Electricity on property / electricity available; Natural gas available; Multiple separate gas and electric meters (7 each); Single separate water meter
- Home design: Single-story buildings; No shared/common walls; Entry level at ground floor; Stucco construction
- Construction: Stucco exterior; Asphalt roof; Concrete slab foundation; Year built per assessor
- Exterior features: Rain gutters; Chain-link fencing; No pool; Lot zoned approximately 2–5 units per acre; Access via paved city streets
Interior
- Kitchen: No appliances included; Fireplaces can be found in kitchen areas
- Bedrooms: All bedrooms on main level; Two primary bedrooms
- Flooring: Vinyl flooring; Laminate flooring
- Bathrooms: Multiple full bathrooms (units include full baths)
- Heating & cooling: Wall heaters; Wall/window cooling units; Has heating and cooling
- Interior features: Tile countertops; Double-pane Energy Star windows with screens; Carbon monoxide and smoke detectors; No interior steps (accessible); Doors swing inward; Entry slope less than 1 foot
- Laundry & utility: No laundry features listed
Neighborhood map
What this means for you Summary
Snapshot
- This is a 7 × 1-bed/1-bath units multifamily listed at $1.73M.
Deal economics
- At list price, monthly cash flow is $-782 ($-9k/yr) — negative. Per door: $-112/mo.
- To cash-flow at today's rent, offer at most $1.59M (8.0% below list).
- To meet the 1% rule (rent ≥ 1% of price), the offer needs to be $1.25M (27.5% below list).
- Recommended offer: $1.25M (27.5% below list) — sets the bar for 1% rule.
- Cap rate 5.7% vs local median 2.8% in South Gate — top-decile yield for the area; either an underpriced asset or a hidden risk that comps aren't pricing in. Stress-test before assuming the spread holds.
Location & tenants
- Location reads 63/100 on livability (#459 in CA) — a middle-class / working-renter tenant base. Strengths: commute A+; Watch: health & safety C-, schools D-, crime F.
- Los Angeles Unified (urban): math 29% / reading 54% proficiency, ranked #223 of 517 in CA (top 43%) — families likely to look elsewhere, expect single-tenant / working-renter base with shorter leases; 67% free/reduced lunch — lower-income household profile, screen leases tightly.
- Market conditions: Rents rising fast (+5.0%/yr); 51 active listings in the ZIP; 34 comparable units currently listed for rent nearby; rentals at typical pace (median 24d on market — plan ~3-4 weeks tenant-placement turnaround); 19,697 units permitted in Los Angeles County in 2024 (9,426 in 5+ unit buildings).
- At $12,508/mo this rent would consume 201% of the median local household income ($75k/yr) (locally 4041% of renters already pay >50% of income on rent) — very limited rent-growth headroom before tenants either downsize or default.
Forward outlook
- Local home prices are declining (-3.0%/yr); year-one equity from $12k of loan paydown is wiped out by about $52k of value loss. Plan a longer hold.
- Los Angeles County population projected at +9% by 2050 — modest demand growth; plan on rents tracking national, not racing it.
Negotiation context
- It's been on market 28 days — a 2% lower offer ($1.70M) is reasonable based on typical stale-listing flexibility.
- Current owner paid $110k; list at $1.73M implies a 1468% gain — meaningful room to come down on a strong offer.
Risks & watch-outs
- Watch-outs: built in 1951 — expect roof / HVAC / electrical / plumbing capex.
- Climate carrying-cost: extreme-heat days projected 7→22/yr by 2055 (HVAC capex compounding) — expect insurance premiums to compound above CPI over the hold.
Questions for the listing agent
- What do current leases actually rent for vs. the listed asking? Can we see a recent rent roll and the last 12 months of T-12 income?
- Can we see the unit-by-unit rent roll, current vacancy, and any below-market leases? What's the average tenancy length?
- What capital expenditures (roof, boiler, parking lot, exteriors) have been made in the last 5 years, and what's planned in the next 2?
- Built in 1951 — when were the roof, HVAC, electrical panel, plumbing, and water heater last replaced?
- Is there a deadline driving the sale (1031 exchange, divorce, estate, relocation)? That informs how much negotiation room exists.
- Schools are D-rated, which usually means shorter tenancies and higher turnover. Who's the typical renter profile here, and what's been the actual vacancy rate?
- Crime grade is F in this area — have there been break-ins, vandalism, or insurance claims at this property in the last 3 years? What carrier currently insures it and at what premium?
- The area grade is low — what's the realistic commute time and amenity access for the typical tenant pool here? Any planned neighborhood developments (good or bad) we should know about?
- What's the average days-on-market for RENTAL listings here right now (not sales)? A rising rental-DOM trend means longer vacancies and softer asking-rent achievability than the comps imply.
- What's the recent tenant-quality profile in this submarket — average credit score on applications, eviction rate, late-payment / NSF rate, and stable-employment percentage? A property-management company in the area should have these aggregated.
- How much new apartment / multifamily construction is in the pipeline within 1–3 miles? Heavy new supply (>2% of stock underway) typically softens rents 12–24 months out; light construction supports rent growth.
Investment metrics
- 1% rule
- 0.73% ✗
- Cap rate
- 5.75%
- Cash-on-cash
- -1.94%
- DSCR
- 0.91
- GRM
- 11.5
CMA / ARV
No comps found within radius.
Projected returns pro-forma
-3.0% appreciation · 4.95% rent growth · sell at horizon
- IRR
- -17.6%
- Equity multiple
- 0.37×
- Total profit
- $-304,929
- Equity at exit
- $257,203
- IRR
- -6.8%
- Equity multiple
- 0.53×
- Total profit
- $-225,238
- Equity at exit
- $149,146
Cash invested: $483,000 (down + closing). Projections, not guarantees.
Landlord ↔ Tenant lean methodology
- Overall (STATE)
- 18 Strongly Tenant-Friendly
- State California
- 18 Strongly Tenant-Friendly · D+13
- County
- — inherits STATE
- City
- — inherits STATE
ZIP-level market 90280
- Rents YoY
- 5.0%
- Active inventory
- 51
- Price-to-rent
- 80.4×
Monthly cashflow live
- Estimated rent
- $12,508 high interval (Pro) →
- Mortgage (P&I)
- −$9,046
- Tax from tax record
- −$899 /mo · $10,788/yr
- Insurance
- −$719
- HOA
- −$0
- Vacancy / Maint / Mgmt
- −$2,627
- Net cashflow
- $-782
Break-even live
7-unit breakdown (identical units grouped — click to expand)
| Units | Beds | Baths | Est. rent |
|---|---|---|---|
| 7× units | 1 | 1 | $12,509 |
| #1 | 1 | 1 | $1,787 |
| #2 | 1 | 1 | $1,787 |
| #3 | 1 | 1 | $1,787 |
| #4 | 1 | 1 | $1,787 |
| #5 | 1 | 1 | $1,787 |
| #6 | 1 | 1 | $1,787 |
| #7 | 1 | 1 | $1,787 |
| Total (7 units) | $12,508 | ||
UW: 25.0% down · 7.5% · 30yr · 1.5% tax · 5.0% vac · 8.0% maint · 8.0% mgmt
Financing live
Cash to close
- Down payment
- $431,250
- Closing costs
- $51,750
- Reserves months
- —
- Total cash needed
- —
Loan-product check · same deal, 3 products live
Conventional
25% down · 7.5% · 30yr
- Down + closing
- —
- Monthly P&I
- —
- Monthly cashflow
- —
- DSCR
- —
- Eligible?
- —
Personal DTI + credit; lowest rate.
DSCR
20% down · 8.5% · 30yr
- Down + closing
- —
- Monthly P&I
- —
- Monthly cashflow
- —
- DSCR
- —
- Eligible?
- —
No personal income docs; deal must DSCR.
Hard money
10% down · 12.0% · 12mo
- Down + closing
- —
- Monthly P&I
- —
- Monthly cashflow
- —
- DSCR
- —
- Eligible?
- —
Short-term bridge; refi at stabilization.
Rent comps 34 comps
| Address | Beds | Baths | Sqft | Rent | $/sqft | DOM | Units | Dist |
|---|---|---|---|---|---|---|---|---|
| 8123 Otis St Unit downstairs unit South Gate, CA | 1.0 | 1.0 | 550 | $1,550 | $2.82 | 19d | 1 | 0.22mi |
| 8468 San Antonio Ave Apt D South Gate, CA | 1.0 | 1.0 | 650 | $1,900 | $2.92 | 24d | 1 | 0.46mi |
| 8946 Bryson Ave Unit A South Gate, CA | — | 1.0 | 425 | $1,800 | $4.24 | 17d | 1 | 0.51mi |
| 3723 Olive St Unit 2 Huntington Park, CA | 1.0 | 1.0 | 700 | $1,450 | $2.07 | 7d | 1 | 0.63mi |
| 3613 Grand Ave Huntington Park, CA | — | 1.0 | 450 | $1,400 | $3.11 | 14d | 1 | 0.72mi |
| 7716 California Ave Unit G Huntington Park, CA | 1.0 | 1.0 | 450 | $2,000 | $4.44 | 43d | 1 | 0.74mi |
| 7715 California Ave Huntington Park, CA | 1.0 | 1.0 | 650 | $1,900 | $2.92 | 43d | 1 | 0.76mi |
| 4013 Live Oak St Cudahy, CA | 1.0 | 1.0 | 462 | $1,650 | $3.57 | 24d | 1 | 0.77mi |
| 8939 Elizabeth Ave South Gate, CA | 2.0 | 1.0 | 500 | $2,395 | $4.79 | 16d | 1 | 0.82mi |
| 7520 Atlantic Ave Unit 4 Cudahy, CA | 1.0 | 1.0 | 700 | $1,600 | $2.29 | 43d | 1 | 0.82mi |
| 8677 Dearborn Ave Apt C South Gate, CA | 2.0 | 1.0 | 645 | $2,700 | $4.19 | 7d | 1 | 0.89mi |
| 4332 Florence Ave Unit 15 Bell, CA | 1.0 | 1.0 | 450 | $1,850 | $4.11 | 21d | 1 | 0.89mi |
| 9518 California Ave South Gate, CA | 1.0 | 1.0 | 700 | $1,395 | $1.99 | 43d | 1 | 0.91mi |
| 3247 Santa Ana St Huntington Park, CA | 1.0 | 1.0 | 468 | $1,645 | $3.51 | 19d | 1 | 0.91mi |
| 3464 Duane Way Unit 1/2 South Gate, CA | 1.0 | 1.0 | 650 | $1,850 | $2.85 | 43d | 1 | 0.92mi |
| 8601 State St Unit 18 South Gate, CA | 1.0 | 1.0 | 500 | $1,750 | $3.50 | 43d | 1 | 0.92mi |
| 5018 Santa Ana St Bell Gardens, CA | 1.0 | 1.0 | 650 | $1,775 | $2.73 | 43d | 1 | 1.00mi |
| 5033 Santa Ana St Unit C Cudahy, CA | 1.0 | 1.0 | 466 | $1,650 | $3.54 | 16d | 1 | 1.04mi |
| 4986 Southern Ave South Gate, CA | 1.0 | 1.0 | 700 | $2,000 | $2.86 | 43d | 1 | 1.17mi |
| 4403 Michigan Ave Unit A South Gate, CA | 1.0 | 1.0 | 450 | $2,250 | $5.00 | 19d | 1 | 1.21mi |
| 4403 Michigan Ave Unit A South Gate, CA | 1.0 | 1.0 | 450 | $2,250 | $5.00 | 20d | 1 | 1.21mi |
| 10120 California Ave Apt B South Gate, CA | 1.0 | 1.0 | 400 | $1,650 | $4.12 | 43d | 1 | 1.26mi |
| 8178 Chestnut Ave Unit C South Gate, CA | — | 1.0 | 490 | $1,600 | $3.27 | 18d | 1 | 1.28mi |
| 8178 Chestnut Ave Unit A South Gate, CA | 1.0 | 1.0 | 550 | $2,000 | $3.64 | 18d | 1 | 1.29mi |
| 3505 Michigan Ave South Gate, CA | 1.0 | 1.0 | 600 | $1,895 | $3.16 | 43d | 1 | 1.29mi |
| 4656 Bell Ave Unit A Bell, CA | 1.0 | 1.0 | 400 | $1,800 | $4.50 | 17d | 1 | 1.30mi |
| 7716 Walker Ave Unit C Cudahy, CA | 2.0 | 1.0 | 740 | $2,080 | $2.81 | 7d | 1 | 1.30mi |
| 7712 Walker Ave Unit A Cudahy, CA | 2.0 | 1.0 | 720 | $2,200 | $3.06 | 15d | 1 | 1.31mi |
| 10243 San Antonio Ave South Gate, CA | 2.0 | 1.0 | 650 | $2,195 | $3.38 | 43d | 1 | 1.34mi |
| 4656 Bell Pl Bell Gardens, CA | 1.0 | 1.0 | 475 | $1,950 | $4.11 | 43d | 1 | 1.35mi |
| 9951 State St Unit D Lynwood, CA | 1.0 | 1.0 | 575 | $1,650 | $2.87 | 24d | 1 | 1.40mi |
| 2844 Ardmore Ave Unit 8 South Gate, CA | 1.0 | 1.0 | 692 | $1,850 | $2.67 | 20d | 1 | 1.42mi |
| 2844 Ardmore Ave Unit 3 South Gate, CA | 1.0 | 1.0 | 692 | $1,850 | $2.67 | 24d | 1 | 1.42mi |
| 2815 Willow Pl Unit 19A South Gate, CA | 2.0 | 1.0 | 604 | $2,025 | $3.35 | 43d | 1 | 1.43mi |
Listing history 15 events
-
2026-06-18days on market $1,725,000 Active 28 DOM
-
2026-06-17days on market $1,725,000 Active 27 DOM
-
2026-06-16days on market $1,725,000 Active 26 DOM
-
2026-06-15days on market $1,725,000 Active 25 DOM
-
2026-06-13days on market $1,725,000 Active 23 DOM
-
2026-06-09days on market $1,725,000 Active 19 DOM
-
2026-06-08days on market $1,725,000 Active 18 DOM
-
2026-06-07days on market $1,725,000 Active 17 DOM
-
2026-06-04days on market $1,725,000 Active 14 DOM
-
2026-06-03days on market $1,725,000 Active 13 DOM
-
2026-06-02days on market $1,725,000 Active 12 DOM
-
2026-06-01days on market $1,725,000 Active 11 DOM
-
2026-05-31days on market $1,725,000 Active 10 DOM
-
2026-05-21$1,725,000 Active
-
1977-06-29soldstatus $110,000
ⓘ Source: listings_history table (triggers on properties + properties_extension) + one-shot
backfill from property_details.listing_events for pre-trigger history.
Tax reassessment forecast CA · Resets to sale price
- Current annual tax
- $10,788 · $899/mo
- Projected year-2 tax
- $13,110 · $1,092/mo
- Expected delta
- +$2,322/yr (+$194/mo · 21.5%)
ⓘ Screening estimate from a state-policy table — verify with the county assessor before closing.
Climate risk First Street
- Flood 1/10 Low FEMA zone X (unshaded) · 0% chance over 30 yrs
- Wildfire 1/10 Low
- Heat 5/10 Major 7 d/yr ≥91°F today · 22 d/yr by 30 yrs out
- Wind 1/10 Low
- Air quality 5/10 Major 9 unhealthy d/yr today · 9 by 30 yrs out
Nearby sold comps map
Loading sold comps map…
Walkable amenities ~0.75 mi
Loading nearby amenities…
Taxation est. · year 1
- Rental income
- $150,096
- − Mortgage interest
- −$96,627
- − Property taxes
- −$10,788
- − Insurance
- −$8,625
- − Repairs & maintenance
- −$12,008
- − Management
- −$12,008
- − Depreciation
- −$50,182
- Taxable loss
- −$40,141
- Est. tax savings @ 24.0%
- +$9,634
- After-tax cash flow
- $244/yr
For passive investors: Depreciation is non-cash, so a rental often shows a tax loss while cash-flowing — sheltering income. Rental losses are passive: they offset passive income freely, and up to $25,000/yr can offset ordinary (W-2) income if you actively participate and your MAGI is under $100k (phasing out to $0 by $150k); unused losses carry forward. On sale, claimed depreciation is recaptured at up to 25%, and gains may owe capital-gains tax (a 1031 exchange can defer both). Figures are a year-1 estimate at your 24.0% rate — not tax advice; consult a CPA.
Schools (NCES district)
- District
- Los Angeles Unified
- NCES district ID
- 0622710
- Math proficiency
- 29% ▼ -4.00%
- Reading proficiency
- 54% ▲ 10.00%
- Median HH income
- $50,403
- Composite
- 35.67/100
- National rank
- #4875
- State rank
- #223 of 517 in CA
Livability — South Gate
- Score
- 63/100
- State rank
- #459
- US rank
- #15665
Category grades
Schools grade is shown separately in the Schools card above.
Census & demographics
- Census place
- South Gate, CA
- County
- Los Angeles County · 9,444,647 people
- City population
- 91,365
- Metro
- Los Angeles-Long Beach-Anaheim, CA
- Population (ZIP)
- 91,365
- Household income
- $74,651
- Rent vs Own
- Severe rent burden
- 4041.0
Population outlook (Los Angeles County) Hauer SSP2
- Today (2025)
- 10,940,515 people
- By 2030
- 11,256,481 · +2.9%
- By 2040
- 11,729,929 · +7.2%
- By 2050
- 11,948,407 · +9.2%
- By 2075
- 11,818,114 · +8.0%
- By 2100
- 10,842,928 · -0.9%
Race, ethnicity, and origin ACS 2023
- Neighborhood character
- Predominantly Hispanic (95%)
- Race & ethnicity
- Hispanic / Latino 95% Two or more races 27% White 3% Native American 2%
- Hispanic origin (detail)
- Mexican 78%
- Foreign-born
- 42% · Canada
- Languages at home
- 16% English-only · Spanish 83%
Political lean MEDSL · Los Angeles
- 2024 margin
- Solid D (+32.9) · D 64.8% · R 31.9% · Other 3.3%
- 2008→2024 swing
- -7.4pp toward R · 2008: 40.4pp · 2024: 32.9pp
- All cycles
- 2024: D+32.9 2020: D+44.2 2016: D+48.0 2012: D+40.0 2008: D+40.4
Not yet ingested
- Civics
- —
Market trends
- HPI YoY
- ▼ -847.77%
- Current HPI
- 419.791
- Rent YoY
- ▲ 4.95%
- Metro
- Los Angeles-Long Beach-Anaheim, CA
- State GDP YoY
- ▲ 3.21%
- F500 in state
- 116
Industry mix (Fortune 500 HQ in CA)
| Industry | F500 HQs | Revenue |
|---|---|---|
| Technology | 27 | $1,492B |
|
||
| Financial Services | 3 | $174B |
|
||
| Retail | 3 | $44B |
|
||
| Insurance | 3 | $26B |
|
||
| Media / Entertainment | 2 | $115B |
|
||
| Pharmaceuticals / Biotech | 2 | $62B |
|
||
Price history
+1468.2% since first listed2 events — show timeline
- 2026-05-21 Listed $1,725,000 CRMLS
- 1977-06-29 Sold (Public Records) $110,000 Public Records
Property tax history
+10.6%/yrLatest (2025): $10,788 · +3.8% YoY. Source: county tax records.
Cash-flow waterfall
monthlySold comps — $/sqft
last 12 mo · ≤1 miLoading sold comps…