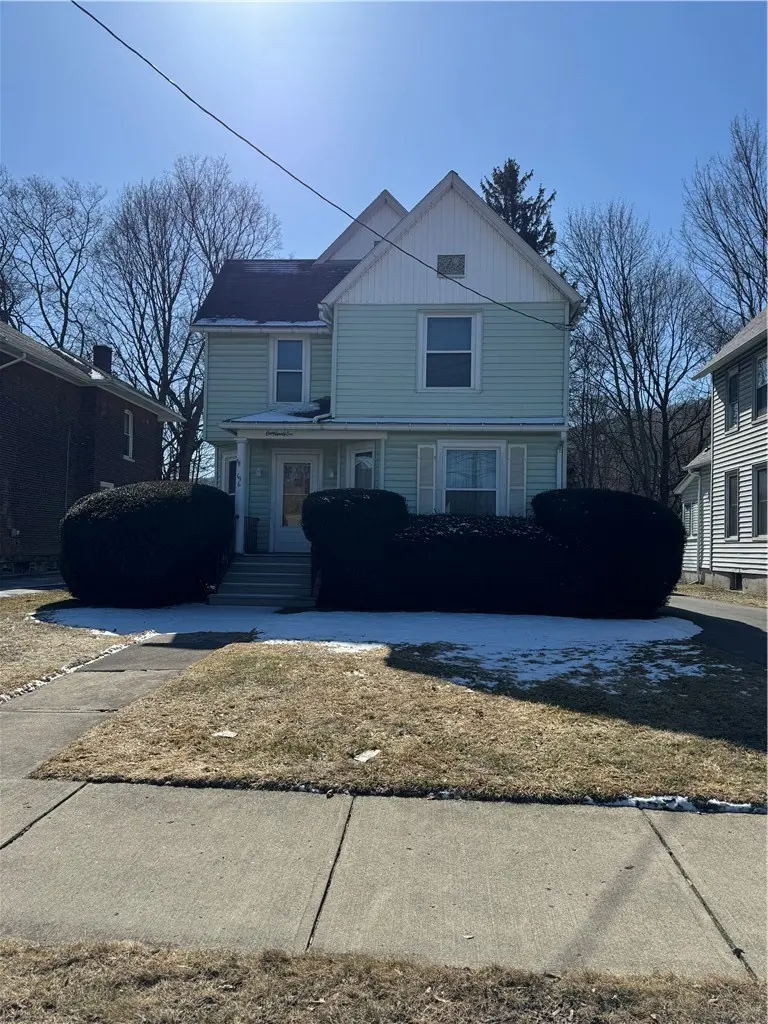
196 W Pulteney St · Corning, NY
Flood risk 1/10 · Minimal
- FEMA flood zone
- X
- Chance of flooding over 30 yrs
- 0.0%
- Est. flood insurance / yr
- $473 – $860
Fire risk 3/10 · Minor
- Est. fire insurance / yr
- $691 – $1,283
Heat risk 3/10 · Minor
- Hot days now (above 95°F)
- 8 days/yr
- Hot days in 30 yrs
- 17 days/yr
Wind risk 1/10 · Minimal
- Chance of severe wind over 30 yrs
- 0.0%
Air-quality risk 1/10 · Minimal
- Unhealthy air days now
- 0 days/yr
- Unhealthy air days in 30 yrs
- 0 days/yr
Risk factors via First Street. Map © Google.
Why this score? — see what drove the B grade
The composite is a weighted blend of 9 inputs, each scored 0–100. Each bar is that input's sub-score; the figure is the points it added to the 100-point composite (weight × sub-score).
- Cash flow +25.8/30.0
- ARV discount +15.0/15.0
- DSCR +8.7/10.0
- 1% rule +7.6/10.0
- Livability +4.4/5.0
- Schools +4.2/10.0
- Rent growth +2.5/5.0
- Condition / age +2.5/5.0
- Appreciation +0.0/10.0
$144,900
🖨 Deal sheet 📄 Offer letter ✓ Due diligence
Listing remarks MLS
This 2 story home has been very well maintained. There are 2 bedrooms and a third that has been converted to a kitchenette. It easily can be converted back to a bedroom. There is a 1 car detached garage with a separate storage room attached to the back of the garage. The lot is oversized. House is located convenient to Corning, Riverside + Painted Post.
Key facts
- Convenient location
- Oversized lot
- Detached garage
Tags
Neighborhood map
What this means for you Summary
Snapshot
- This is a 3-bed/2.0-bath single-family listed at $145k.
Deal economics
- At list price, monthly cash flow is $354 ($4k/yr) — positive.
- The deal already cash-flows at list — no discount required.
- Meets the 1% rule at list price ($2k rent vs $145k).
- Recommended offer: $136k (6.0% below list) — sets the bar for market timing.
Location & tenants
- Location reads 87/100 on livability (#14 in NY, #334 nationally) — a professional / high-income tenant draw. Strengths: amenities A+, housing A+, health & safety A+; Watch: employment D.
- Corning City School District (town): math 44% / reading 53% proficiency, ranked #406 of 590 in NY (top 69%) — families likely to look elsewhere, expect single-tenant / working-renter base with shorter leases.
- Market conditions: 106 active listings in the ZIP; 4 comparable units currently listed for rent nearby; rentals lingering (median 44d on market — plan ~5-8 weeks vacancy on turnover, expect pricing pressure); 100% of comp listings sitting > 30 days — soft ceiling on asking rent; 196 units permitted in Steuben County in 2024 (0 in 5+ unit buildings).
Forward outlook
- Local home prices are declining (-3.0%/yr); year-one equity from $1k of loan paydown is wiped out by about $4k of value loss. Plan a longer hold.
- Steuben County population projected at -20% by 2050 — secular population decline; favor cash flow + early exit over multi-decade hold.
Negotiation context
- It's been on market 70 days — a 6% lower offer ($136k) is reasonable based on typical stale-listing flexibility.
Risks & watch-outs
- Watch-outs: built in 1910 — expect roof / HVAC / electrical / plumbing capex.
Questions for the listing agent
- It's been on market 70 days. Have you received any prior offers? Is the seller open to a 6% concession, seller financing, or rate buy-down credit?
- Built in 1910 — when were the roof, HVAC, electrical panel, plumbing, and water heater last replaced?
- Why hasn't it sold? Are there any deal-killer items the seller is aware of (foundation, flood, title, zoning, code violations)?
- Is there a deadline driving the sale (1031 exchange, divorce, estate, relocation)? That informs how much negotiation room exists.
- Schools are A-rated — typically a magnet for longer-tenancy family renters. What's the average tenant stay here, and is there a school-zone premium baked into asking?
- What's the average days-on-market for RENTAL listings here right now (not sales)? A rising rental-DOM trend means longer vacancies and softer asking-rent achievability than the comps imply.
- What's the recent tenant-quality profile in this submarket — average credit score on applications, eviction rate, late-payment / NSF rate, and stable-employment percentage? A property-management company in the area should have these aggregated.
- How much new for-sale + rental construction is in the pipeline within 1–3 miles? Heavy new supply typically softens prices + rents 12–24 months out; constrained supply supports both.
Investment metrics
- 1% rule
- 1.26% ✓
- Cap rate
- 9.22%
- Cash-on-cash
- 10.46%
- DSCR
- 1.47
- GRM
- 6.6
CMA / ARV
- ARV (median comp)
- $194,441
- List price
- $144,900
- Delta
- -25.48%
- Verdict
- UNDERPRICED
- Comps
- 20 within 1.0 mi
Show comp detail 12 sales within ~0.75 mi
| Address | Dist | Beds/Ba | Sqft | Sold | Price | $/sf | Match |
|---|---|---|---|---|---|---|---|
| 117 Reynolds Ave | 0.09mi | 3/1.5 | 1,619 (-2%) | 0mo | $225,000 | $139 | 90 |
| 156 Princeton Ave | 0.28mi | 3/1.5 | 1,660 (+0%) | 0mo | $235,000 | $142 | 84 |
| 148 W Pulteney St | 0.12mi | 4/2.0 (+1) | 1,585 (-4%) | 5mo | $60,000 | $38 | 78 |
| 19 W Hazel St | 0.46mi | 3/2.0 | 1,722 (+4%) | 1mo | $180,000 | $105 | 71 |
| 184 Sly Ave | 0.41mi | 3/2.0 | 1,740 (+5%) | 3mo | $40,000 | $23 | 70 |
| 307 Princeton Avenue Ext | 0.60mi | 3/1.0 | 1,644 (-0%) | 2mo | $193,500 | $118 | 65 |
| 239 W 1st St | 0.63mi | 3/2.0 | 1,680 (+2%) | 4mo | $170,000 | $101 | 65 |
| 258 Sly Ave | 0.53mi | 3/2.0 | 1,507 (-9%) | 5mo | $90,000 | $60 | 56 |
| 229 Cutler Ave | 0.45mi | 3/1.5 | 1,822 (+10%) | 5mo | $179,000 | $98 | 56 |
| 257 Bridge St | 0.58mi | 3/1.5 | 1,456 (-12%) | 6mo | $72,750 | $50 | 46 |
| 67 Perry Ave | 0.66mi | 2/1.5 (-1) | 1,832 (+11%) | 1mo | $55,000 | $30 | 43 |
| 25 Fero Ave | 0.63mi | 2/2.0 (-1) | 1,449 (-12%) | 6mo | $110,000 | $76 | 40 |
Match score weights: distance 35% · size 25% · config 20% · recency 20%. Top-matched comps best support the ARV.
Projected returns pro-forma
-3.0% appreciation · 3.0% rent growth · sell at horizon
- IRR
- -0.6%
- Equity multiple
- 0.98×
- Total profit
- $-878
- Equity at exit
- $21,605
- IRR
- 9.1%
- Equity multiple
- 1.70×
- Total profit
- $28,561
- Equity at exit
- $12,528
Cash invested: $40,572 (down + closing). Projections, not guarantees.
Landlord ↔ Tenant lean methodology
- Overall (STATE)
- 15 Strongly Tenant-Friendly
- State New York
- 15 Strongly Tenant-Friendly · D+10
- County
- — inherits STATE
- City
- — inherits STATE
ZIP-level market 14830
- Active inventory
- 106
- Price-to-rent
- 6.6×
Monthly cashflow live
- Estimated rent
- $1,822 medium interval (Pro) →
- Mortgage (P&I)
- −$760
- Tax from tax record
- −$266 /mo · $3,188/yr
- Insurance
- −$60
- HOA
- −$0
- Vacancy / Maint / Mgmt
- −$383
- Net cashflow
- $354
Break-even live
UW: 25.0% down · 7.5% · 30yr · 1.5% tax · 5.0% vac · 8.0% maint · 8.0% mgmt
Financing live
Cash to close
- Down payment
- $36,225
- Closing costs
- $4,347
- Reserves months
- —
- Total cash needed
- —
Loan-product check · same deal, 3 products live
Conventional
25% down · 7.5% · 30yr
- Down + closing
- —
- Monthly P&I
- —
- Monthly cashflow
- —
- DSCR
- —
- Eligible?
- —
Personal DTI + credit; lowest rate.
DSCR
20% down · 8.5% · 30yr
- Down + closing
- —
- Monthly P&I
- —
- Monthly cashflow
- —
- DSCR
- —
- Eligible?
- —
No personal income docs; deal must DSCR.
Hard money
10% down · 12.0% · 12mo
- Down + closing
- —
- Monthly P&I
- —
- Monthly cashflow
- —
- DSCR
- —
- Eligible?
- —
Short-term bridge; refi at stabilization.
Rent comps 4 comps
| Address | Beds | Baths | Sqft | Rent | $/sqft | DOM | Units | Dist |
|---|---|---|---|---|---|---|---|---|
| 209 Oneida Pl Corning, NY | 3.0 | 1.5 | 1200 | $2,000 | $1.67 | 43d | 1 | 0.16mi |
| 247 Princeton Ave Corning, NY | 3.0 | 1.0 | 1504 | $1,500 | $1.00 | 43d | 1 | 0.45mi |
| 137 Field St Corning, NY | 2.0–3.0 | 1.0 | 1125 | $1,345 | $1.20 | 43d | 3 | 0.48mi |
| 171 E 1st St Corning, NY | 3.0 | 2.5 | 1569 | $3,352 | $2.14 | 43d | 1 | 1.40mi |
Listing history 4 events
-
2026-05-11status Pending 355-char remark
Show marketing remark (355 chars)
This 2 story home has been very well maintained. There are 2 bedrooms and a third that has been converted to a kitchenette. It easily can be converted back to a bedroom. There is a 1 car detached garage with a separate storage room attached to the back of the garage. The lot is oversized. House is located convenient to Corning, Riverside + Painted Post.
-
2026-04-21price $144,900 355-char remark
Show marketing remark (355 chars)
This 2 story home has been very well maintained. There are 2 bedrooms and a third that has been converted to a kitchenette. It easily can be converted back to a bedroom. There is a 1 car detached garage with a separate storage room attached to the back of the garage. The lot is oversized. House is located convenient to Corning, Riverside + Painted Post.
-
2026-04-13price $154,900 355-char remark
Show marketing remark (355 chars)
This 2 story home has been very well maintained. There are 2 bedrooms and a third that has been converted to a kitchenette. It easily can be converted back to a bedroom. There is a 1 car detached garage with a separate storage room attached to the back of the garage. The lot is oversized. House is located convenient to Corning, Riverside + Painted Post.
-
2026-03-02$159,900 Active 355-char remark
Show marketing remark (355 chars)
This 2 story home has been very well maintained. There are 2 bedrooms and a third that has been converted to a kitchenette. It easily can be converted back to a bedroom. There is a 1 car detached garage with a separate storage room attached to the back of the garage. The lot is oversized. House is located convenient to Corning, Riverside + Painted Post.
ⓘ Source: listings_history table (triggers on properties + properties_extension) + one-shot
backfill from property_details.listing_events for pre-trigger history.
Tax reassessment forecast NY · Partial reset (capped growth)
- Current annual tax
- $3,188 · $266/mo
- Projected year-2 tax
- $3,188 · $266/mo
- Expected delta
- $0/yr ($0/mo · 0.0%)
ⓘ Screening estimate from a state-policy table — verify with the county assessor before closing.
Climate risk First Street
- Flood 1/10 Low FEMA zone X · 0% chance over 30 yrs
- Wildfire 3/10 Moderate
- Heat 3/10 Moderate 8 d/yr ≥95°F today · 17 d/yr by 30 yrs out
- Wind 1/10 Low 0% chance of damaging wind over 30 yrs
- Air quality 1/10 Low 0 unhealthy d/yr today · 0 by 30 yrs out
Nearby sold comps map
Loading sold comps map…
Walkable amenities ~0.75 mi
Loading nearby amenities…
Taxation est. · year 1
- Rental income
- $21,866
- − Mortgage interest
- −$8,117
- − Property taxes
- −$3,188
- − Insurance
- −$724
- − Repairs & maintenance
- −$1,749
- − Management
- −$1,749
- − Depreciation
- −$4,215
- Taxable income
- $2,123
- Est. tax owed @ 24.0%
- −$510
- After-tax cash flow
- $3,734/yr
For passive investors: Depreciation is non-cash, so a rental often shows a tax loss while cash-flowing — sheltering income. Rental losses are passive: they offset passive income freely, and up to $25,000/yr can offset ordinary (W-2) income if you actively participate and your MAGI is under $100k (phasing out to $0 by $150k); unused losses carry forward. On sale, claimed depreciation is recaptured at up to 25%, and gains may owe capital-gains tax (a 1031 exchange can defer both). Figures are a year-1 estimate at your 24.0% rate — not tax advice; consult a CPA.
Schools (NCES district)
- District
- Corning City School District
- NCES district ID
- 3608400
- Math proficiency
- 44% ▼ -12.00%
- Reading proficiency
- 53% ▲ 4.00%
- Median HH income
- $53,042
- Composite
- 41.8/100
- National rank
- #3392
- State rank
- #406 of 590 in NY
Livability — Corning
- Score
- 87/100
- State rank
- #14
- US rank
- #334
Category grades
Schools grade is shown separately in the Schools card above.
Census & demographics
- Census place
- Corning, NY
- County
- Steuben County · 41,193 people
- City population
- 19,015
- Metro
- Corning, NY
- Population (ZIP)
- 19,015
- Household income
- $73,263
- Rent vs Own
- Severe rent burden
- 565.0
Population outlook (Steuben County) Hauer SSP2
- Today (2025)
- 93,062 people
- By 2030
- 89,793 · -3.5%
- By 2040
- 82,353 · -11.5%
- By 2050
- 74,286 · -20.2%
- By 2075
- 55,589 · -40.3%
- By 2100
- 37,587 · -59.6%
Race, ethnicity, and origin ACS 2023
- Neighborhood character
- Predominantly White (91%)
- Race & ethnicity
- White 91% Two or more races 3% Black 3% Hispanic / Latino 3% Asian 2%
- Common ancestry
- Romanian 4% Slovak 3% Lithuanian 2%
- Foreign-born
- 5% · Canada, China
- Languages at home
- 95% English-only · Russian/Polish/Slavic 1% Spanish 1% Other Asian/Pacific 1%
Political lean MEDSL · Steuben
- 2024 margin
- Solid R (+31.8) · D 34.1% · R 65.9%
- 2008→2024 swing
- -15.0pp toward R · 2008: -16.8pp · 2024: -31.8pp
- All cycles
- 2024: R+31.8 2020: R+29.6 2016: R+36.2 2012: R+16.4 2008: R+16.8
Not yet ingested
- Civics
- —
Market trends
- HPI YoY
- ▼ -94.59%
- Current HPI
- 173.9857
- Rent YoY
- —
- Metro
- Corning, NY
- State GDP YoY
- ▲ 2.60%
- F500 in state
- 92
Industry mix (Fortune 500 HQ in NY)
| Industry | F500 HQs | Revenue |
|---|---|---|
| Financial Services | 10 | $950B |
|
||
| Consumer Goods | 9 | $162B |
|
||
| Insurance | 4 | $225B |
|
||
| Telecommunications | 2 | $144B |
|
||
| Pharmaceuticals | 2 | $112B |
|
||
| Media / Entertainment | 2 | $69B |
|
||
Price history
-9.4% since first listed4 events — show timeline
- 2026-05-11 Pending — UNYREIS
- 2026-04-21 Price Changed $144,900 UNYREIS
- 2026-04-13 Price Changed $154,900 UNYREIS
- 2026-03-02 Listed $159,900 UNYREIS
Property tax history
+4.5%/yrLatest (2025): $3,188 · -2.4% YoY. Source: county tax records.
Cash-flow waterfall
monthlySold comps — $/sqft
last 12 mo · ≤1 miLoading sold comps…