1500 Held Dr #100 · Modesto, CA
Flood risk 1/10 · Minimal
- FEMA flood zone
- X (unshaded)
- Chance of flooding over 30 yrs
- 0.0%
- Est. flood insurance / yr
- $507 – $1,088
Fire risk 7/10 · Major
- Est. fire insurance / yr
- $659 – $1,223
Heat risk 7/10 · Major
- Hot days now (above 102°F)
- 7 days/yr
- Hot days in 30 yrs
- 15 days/yr
Wind risk 1/10 · Minimal
- Chance of severe wind over 30 yrs
- —
Air-quality risk 10/10 · Severe
- Unhealthy air days now
- 36 days/yr
- Unhealthy air days in 30 yrs
- 39 days/yr
Risk factors via First Street. Map © Google.
Why this score? — see what drove the C+ grade
The composite is a weighted blend of 9 inputs, each scored 0–100. Each bar is that input's sub-score; the figure is the points it added to the 100-point composite (weight × sub-score).
- Cash flow +30.0/30.0
- 1% rule +10.0/10.0
- DSCR +10.0/10.0
- ARV discount +3.7/15.0
- Livability +3.2/5.0
- Rent growth +2.8/5.0
- Condition / age +2.5/5.0
- Schools +2.2/10.0
- Appreciation +0.0/10.0
$100,000
🖨 Deal sheet 📄 Offer letter ✓ Due diligence
Listing remarks
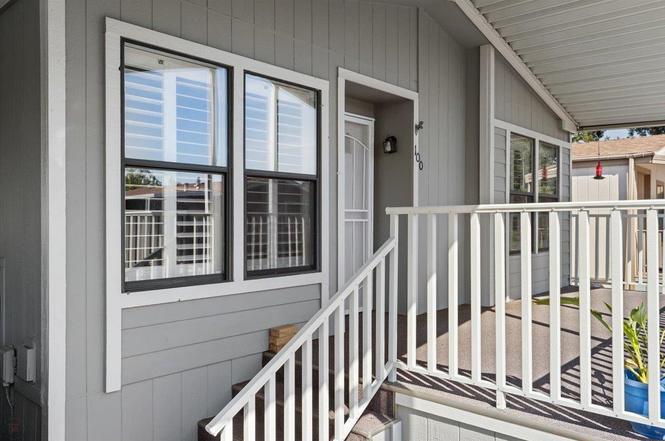
Welcome to easy, low-maintenance living in the desirable 55+ community of The Grove Senior Park! This charming 2-bedroom, 2-bathroom mobile home offers comfort, convenience, and a warm neighborhood atmosphere perfect for relaxed senior living in Modesto. Offered at $105,000 Step inside to discover an airy interior highlighted by vaulted ceilings and a freshly painted interior that creates a bright and inviting atmosphere from the moment you enter. The thoughtful floor plan provides both privacy and functionality, ideal for everyday living or hosting visiting family and friends. Enjoy your morning coffee on the covered front porch, a peaceful space to relax and connect with neighbors. A nice
Key facts
- Covered front porch
- Parking
- Built 1990
Tags
Neighborhood map
What this means for you Summary
Snapshot
- This is a 2-bed/2.0-bath manufactured listed at $100k.
Deal economics
- At list price, monthly cash flow is $930 ($11k/yr) — positive.
- The deal already cash-flows at list — no discount required.
- Meets the 1% rule at list price ($2k rent vs $100k).
- Recommended offer: $97k (3.0% below list) — sets the bar for market timing.
- Cap rate 17.5% vs local median 3.2% in Modesto — top-decile yield for the area; either an underpriced asset or a hidden risk that comps aren't pricing in. Stress-test before assuming the spread holds.
Location & tenants
- Location reads 63/100 on livability (#451 in CA) — a middle-class / working-renter tenant base. Strengths: housing A+; Watch: amenities C-, schools D+, health & safety D+.
- Empire Union Elementary (suburban): math 25% / reading 25% proficiency, ranked #398 of 517 in CA (top 77%) — low school quality limits family demand, transient renter base, plan for 1-2y turnover; 67% free/reduced lunch — lower-income household profile, screen leases tightly.
- Market conditions: Rents rising (+1.3%/yr); 222 active listings in the ZIP; 2 comparable units currently listed for rent nearby; solid renter incomes; 923 units permitted in Stanislaus County in 2024 (63 in 5+ unit buildings).
Forward outlook
- Local home prices are declining (-3.0%/yr); year-one equity from $691 of loan paydown is wiped out by about $3k of value loss. Plan a longer hold.
- Stanislaus County population projected at +14% by 2050 — modest demand growth; plan on rents tracking national, not racing it.
- At projected returns (-3.0% appreciation + 1.3% rent growth), your $28k cash investment doubles in ~4 years — after that, you're playing with house money.
Negotiation context
- It's been on market 38 days — a 3% lower offer ($97k) is reasonable based on typical stale-listing flexibility.
Risks & watch-outs
- Climate carrying-cost: major wildfire risk; extreme-heat days projected 7→15/yr by 2055 (HVAC capex compounding) — expect insurance premiums to compound above CPI over the hold.
Questions for the listing agent
- It's been on market 38 days. Have you received any prior offers? Is the seller open to a 3% concession, seller financing, or rate buy-down credit?
- Is there a deadline driving the sale (1031 exchange, divorce, estate, relocation)? That informs how much negotiation room exists.
- Schools are D-rated, which usually means shorter tenancies and higher turnover. Who's the typical renter profile here, and what's been the actual vacancy rate?
- Crime grade is F in this area — have there been break-ins, vandalism, or insurance claims at this property in the last 3 years? What carrier currently insures it and at what premium?
- What's the average days-on-market for RENTAL listings here right now (not sales)? A rising rental-DOM trend means longer vacancies and softer asking-rent achievability than the comps imply.
- What's the recent tenant-quality profile in this submarket — average credit score on applications, eviction rate, late-payment / NSF rate, and stable-employment percentage? A property-management company in the area should have these aggregated.
- How much new for-sale + rental construction is in the pipeline within 1–3 miles? Heavy new supply typically softens prices + rents 12–24 months out; constrained supply supports both.
Investment metrics
- 1% rule
- 2.05% ✓
- Cap rate
- 17.46%
- Cash-on-cash
- 39.88%
- DSCR
- 2.77
- GRM
- 4.1
CMA / ARV
- ARV (on-the-fly)
- $92,160
- Comps found
- 11
Show comp detail 11 sales within ~0.75 mi
| Address | Dist | Beds/Ba | Sqft | Sold | Price | $/sf | Match |
|---|---|---|---|---|---|---|---|
| 1500 Held Dr #90 | 0.09mi | 2/2.0 | 1,129 (-2%) | 6mo | $121,900 | $108 | 87 |
| 1500 Held Dr #124 | 0.00mi | 3/2.0 (+1) | 1,152 (0%) | 11mo | $84,900 | $74 | 86 |
| 1500 Held Dr #83 | 0.00mi | 2/2.0 | 1,152 (0%) | 20mo | $91,000 | $79 | 83 |
| 1500 Held Dr #137 | 0.00mi | 3/2.0 (+1) | 1,100 (-4%) | 7mo | $60,000 | $55 | 82 |
| 4400 Spartans Ln | 0.18mi | 3/2.0 (+1) | 1,152 (0%) | 6mo | $111,800 | $97 | 81 |
| 1500 Held Dr #135 | 0.09mi | 2/2.0 | 1,248 (+8%) | 8mo | $100,000 | $80 | 76 |
| 1517 Panthers Ln | 0.16mi | 3/2.0 (+1) | 1,248 (+8%) | 11mo | $111,000 | $89 | 64 |
| 1500 Held Dr #81 | 0.00mi | 3/2.0 (+1) | 1,323 (+15%) | 8mo | $50,000 | $38 | 64 |
| 4405 S Raiders Way #91 | 0.20mi | 3/2.0 (+1) | 1,206 (+5%) | 22mo | $177,000 | $147 | 59 |
| 4404 Trojans Way | 0.24mi | 3/2.0 (+1) | 1,230 (+7%) | 20mo | $208,000 | $169 | 56 |
| 1441 Playground Way | 0.17mi | 3/2.0 (+1) | 1,300 (+13%) | 16mo | $80,000 | $62 | 52 |
Match score weights: distance 35% · size 25% · config 20% · recency 20%. Top-matched comps best support the ARV.
Projected returns pro-forma
-3.0% appreciation · 1.28% rent growth · sell at horizon
- IRR
- 34.3%
- Equity multiple
- 2.41×
- Total profit
- $39,596
- Equity at exit
- $14,910
- IRR
- 40.2%
- Equity multiple
- 4.47×
- Total profit
- $97,069
- Equity at exit
- $8,646
Cash invested: $28,000 (down + closing). Projections, not guarantees.
Landlord ↔ Tenant lean methodology
- Overall (STATE)
- 18 Strongly Tenant-Friendly
- State California
- 18 Strongly Tenant-Friendly · D+13
- County
- — inherits STATE
- City
- — inherits STATE
ZIP-level market 95355
- Rents YoY
- 1.3%
- Active inventory
- 222
- Price-to-rent
- 4.1×
Monthly cashflow live
- Estimated rent
- $2,053 medium interval (Pro) →
- Mortgage (P&I)
- −$524
- Tax est. 1.5%
- −$125 /mo · $1,500/yr
- Insurance
- −$42
- HOA
- −$0
- Vacancy / Maint / Mgmt
- −$431
- Net cashflow
- $930
Break-even live
UW: 25.0% down · 7.5% · 30yr · 1.5% tax · 5.0% vac · 8.0% maint · 8.0% mgmt
Financing live
Cash to close
- Down payment
- $25,000
- Closing costs
- $3,000
- Reserves months
- —
- Total cash needed
- —
Loan-product check · same deal, 3 products live
Conventional
25% down · 7.5% · 30yr
- Down + closing
- —
- Monthly P&I
- —
- Monthly cashflow
- —
- DSCR
- —
- Eligible?
- —
Personal DTI + credit; lowest rate.
DSCR
20% down · 8.5% · 30yr
- Down + closing
- —
- Monthly P&I
- —
- Monthly cashflow
- —
- DSCR
- —
- Eligible?
- —
No personal income docs; deal must DSCR.
Hard money
10% down · 12.0% · 12mo
- Down + closing
- —
- Monthly P&I
- —
- Monthly cashflow
- —
- DSCR
- —
- Eligible?
- —
Short-term bridge; refi at stabilization.
Rent comps 2 comps
| Address | Beds | Baths | Sqft | Rent | $/sqft | DOM | Units | Dist |
|---|---|---|---|---|---|---|---|---|
| 1108 Cedar Creek Dr #1 Modesto, CA | 2.0 | 2.0 | 1064 | $1,999 | $1.88 | 14d | 1 | 0.91mi |
| 1500 Lakewood Ave Modesto, CA | 1.0–2.0 | 1.0–2.0 | 820 | $1,900 | $2.32 | 14d | 7 | 1.43mi |
Climate risk First Street
- Flood 1/10 Low FEMA zone X (unshaded) · 0% chance over 30 yrs
- Wildfire 7/10 Severe
- Heat 7/10 Severe 7 d/yr ≥102°F today · 15 d/yr by 30 yrs out
- Wind 1/10 Low
- Air quality 10/10 Extreme 36 unhealthy d/yr today · 39 by 30 yrs out
Nearby sold comps map
Loading sold comps map…
Walkable amenities ~0.75 mi
Loading nearby amenities…
Taxation est. · year 1
- Rental income
- $24,631
- − Mortgage interest
- −$5,602
- − Property taxes
- −$1,500
- − Insurance
- −$500
- − Repairs & maintenance
- −$1,970
- − Management
- −$1,970
- − Depreciation
- −$2,909
- Taxable income
- $10,179
- Est. tax owed @ 24.0%
- −$2,443
- After-tax cash flow
- $8,722/yr
For passive investors: Depreciation is non-cash, so a rental often shows a tax loss while cash-flowing — sheltering income. Rental losses are passive: they offset passive income freely, and up to $25,000/yr can offset ordinary (W-2) income if you actively participate and your MAGI is under $100k (phasing out to $0 by $150k); unused losses carry forward. On sale, claimed depreciation is recaptured at up to 25%, and gains may owe capital-gains tax (a 1031 exchange can defer both). Figures are a year-1 estimate at your 24.0% rate — not tax advice; consult a CPA.
Schools (NCES district)
- District
- Empire Union Elementary
- NCES district ID
- 0612690
- Math proficiency
- 25% ▼ -6.00%
- Reading proficiency
- 25% ▼ -14.00%
- Median HH income
- $49,808
- Composite
- 22.05/100
- National rank
- #8193
- State rank
- #398 of 517 in CA
Livability — Modesto
- Score
- 63/100
- State rank
- #451
- US rank
- #15229
Category grades
Schools grade is shown separately in the Schools card above.
Census & demographics
- Census place
- Modesto, CA
- County
- Stanislaus County · 445,786 people
- City population
- 225,261
- Metro
- Modesto, CA
- Population (ZIP)
- 60,710
- Household income
- $86,849
- Rent vs Own
- Severe rent burden
- 2521.0
Population outlook (Stanislaus County) Hauer SSP2
- Today (2025)
- 579,493 people
- By 2030
- 598,000 · +3.2%
- By 2040
- 630,930 · +8.9%
- By 2050
- 658,300 · +13.6%
- By 2075
- 712,363 · +22.9%
- By 2100
- 719,805 · +24.2%
Race, ethnicity, and origin ACS 2023
- Neighborhood character
- Diverse neighborhood (Simpson 0.66)
- Race & ethnicity
- White 48% Hispanic / Latino 33% Two or more races 18% Asian 8% Black 4% Native American 1%
- Hispanic origin (detail)
- Mexican 29% Puerto Rican 2%
- Common ancestry
- Russian 3% Italian 3% Lithuanian 2%
- Foreign-born
- 15% · Canada, China, Vietnam
- Languages at home
- 73% English-only · Spanish 16% Other Indo-European 4% Tagalog/Filipino 1%
Political lean MEDSL · Stanislaus
- 2024 margin
- R (+11.0) · D 43.2% · R 54.2% · Other 2.6%
- 2008→2024 swing
- -12.7pp toward R · 2008: 1.7pp · 2024: -11.0pp
- All cycles
- 2024: R+11.0 2020: D+0.8 2016: D+0.6 2012: D+0.7 2008: D+1.7
Not yet ingested
- Civics
- —
Market trends
- HPI YoY
- ▼ -458.02%
- Current HPI
- 277.8565
- Rent YoY
- ▲ 1.28%
- Metro
- Modesto, CA
- State GDP YoY
- ▲ 3.21%
- F500 in state
- 116
Industry mix (Fortune 500 HQ in CA)
| Industry | F500 HQs | Revenue |
|---|---|---|
| Technology | 27 | $1,492B |
|
||
| Financial Services | 3 | $174B |
|
||
| Retail | 3 | $44B |
|
||
| Insurance | 3 | $26B |
|
||
| Media / Entertainment | 2 | $115B |
|
||
| Pharmaceuticals / Biotech | 2 | $62B |
|
||
Cash-flow waterfall
monthlySold comps — $/sqft
last 12 mo · ≤1 miLoading sold comps…