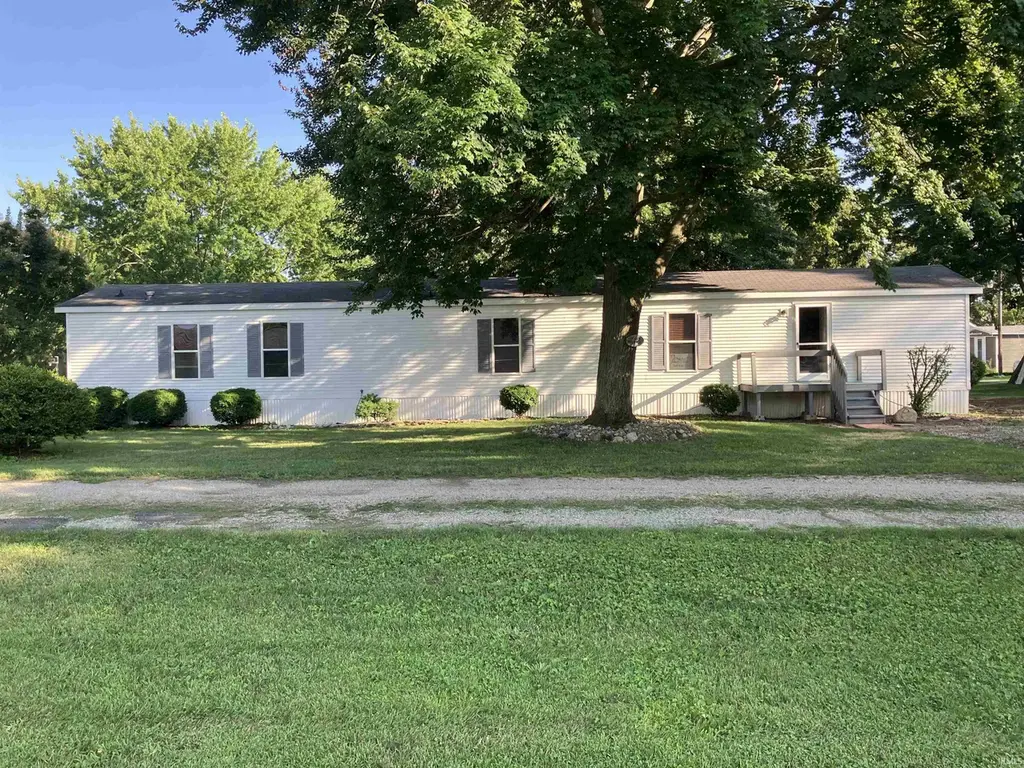
15 Lane 420 Jimmerson Lk · Jimmerson Lake, IN
Flood risk 1/10 · Minimal
- FEMA flood zone
- X (unshaded)
- Chance of flooding over 30 yrs
- 0.0%
- Est. flood insurance / yr
- $507 – $1,088
Fire risk 1/10 · Minimal
- Est. fire insurance / yr
- $717 – $1,331
Heat risk 2/10 · Minimal
- Hot days now (above 98°F)
- 7 days/yr
- Hot days in 30 yrs
- 16 days/yr
Wind risk 2/10 · Minimal
- Chance of severe wind over 30 yrs
- —
Air-quality risk 2/10 · Minimal
- Unhealthy air days now
- 1 days/yr
- Unhealthy air days in 30 yrs
- 2 days/yr
Risk factors via First Street. Map © Google.
Why this score? — see what drove the C- grade
The composite is a weighted blend of 9 inputs, each scored 0–100. Each bar is that input's sub-score; the figure is the points it added to the 100-point composite (weight × sub-score).
- Cash flow +15.8/30.0
- ARV discount +15.0/15.0
- DSCR +4.9/10.0
- 1% rule +4.5/10.0
- Schools +3.9/10.0
- Rent growth +2.5/5.0
- Livability +2.5/5.0
- Condition / age +2.5/5.0
- Appreciation +0.0/10.0
$135,000
🖨 Deal sheet 📄 Offer letter ✓ Due diligence
Listing remarks
BUILD ON TWO LOTS OR WAIT TILL YOUR READY!! Up in Lake Views & Boat Slip. Here is a great inexpensive way to access the Lake James Chain. The outdoor living at this home is simply amazing! A spacious lot perfect for entertaining & has stellar views of Jimmerson Lake. Inside you will find an open concept home, great for entertaining! There are so many possibilities with this extra large lot. Sale includes 4 lots. The kitchen has plenty of built-ins for storage. Newer water heater and furnace. Buena Vista is a golf cart friendly neighborhood that make navigating to park and beach easy. There are 2 bedrooms & 2 full baths. The Master bedroom has a walk in closet and
Key facts
- Lake views
- Open concept
- Spacious lot
Tags
Property features AI
Finance
- Other: Subdivision: Buena Vista
- Financial info:
- HOA & community: Homeowners association with annual fee (approximately $250/year); Community playground
Exterior
- Parking: Off-street parking; Gravel parking area
- Security:
- Utilities: Private well water; No public sewer
- Home design: Manufactured home (residential);
- Construction: Vinyl siding
- Exterior features: Corner lot; Located on Jimmerson Lake; Lot dimensions approximately 90 x 180
Interior
- Kitchen:
- Bedrooms:
- Flooring: Laminate flooring; Vinyl flooring
- Bathrooms: 2 full bathrooms (both on the main level)
- Heating & cooling: Natural gas heating; No central cooling
- Interior features: Fireplace (1); Basement with exterior entry; Main-level laundry
- Laundry & utility: Laundry on the main level; Water heater (energy-efficient feature)
Neighborhood map
What this means for you Summary
Snapshot
- This is a 3-bed/2.0-bath manufactured listed at $135k.
Deal economics
- At list price, monthly cash flow is $61 ($727/yr) — positive.
- The deal already cash-flows at list — no discount required.
- To meet the 1% rule (rent ≥ 1% of price), the offer needs to be $128k (4.9% below list).
- Recommended offer: $128k (4.9% below list) — sets the bar for 1% rule.
Location & tenants
- Location reads: area grade C — affects rentability + tenant quality, not the cash-flow math above.
- Fremont Community Schools (rural): math 42% / reading 48% proficiency, ranked #94 of 301 in IN (top 31%) — families likely to look elsewhere, expect single-tenant / working-renter base with shorter leases.
- Zoned schools: Fremont Elementary School (math 47% / reading 42%, grade F, #379 of 994 statewide, top 41%, 395 students, 47% FRL); Fremont Middle School (math 35% / reading 41%, grade F, #136 of 330 statewide, top 44%, 298 students, 46% FRL); Fremont High School (math 57% / reading 87%, grade B+, #12 of 369 statewide, top 4%, 292 students, 34% FRL).
- Market conditions: 61 active listings in the ZIP; 209 units permitted in Steuben County in 2024 (72 in 5+ unit buildings).
Forward outlook
- Local home prices are declining (-3.0%/yr); year-one equity from $933 of loan paydown is wiped out by about $4k of value loss. Plan a longer hold.
- Steuben County population projected at -13% by 2050 — secular population decline; favor cash flow + early exit over multi-decade hold.
Negotiation context
- It's been on market 53 days — a 3% lower offer ($131k) is reasonable based on typical stale-listing flexibility.
- 2 sale attempts; this cycle's ask has dropped $20k (13%) from the opening price — seller is motivated, your offer sets the floor, not the list.
Questions for the listing agent
- It's been on market 53 days. Have you received any prior offers? Is the seller open to a 5% concession, seller financing, or rate buy-down credit?
- What does the HOA fee cover, when was the last increase, and are there any pending special assessments or reserve-fund shortfalls?
- Is there a deadline driving the sale (1031 exchange, divorce, estate, relocation)? That informs how much negotiation room exists.
- What's the average days-on-market for RENTAL listings here right now (not sales)? A rising rental-DOM trend means longer vacancies and softer asking-rent achievability than the comps imply.
- What's the recent tenant-quality profile in this submarket — average credit score on applications, eviction rate, late-payment / NSF rate, and stable-employment percentage? A property-management company in the area should have these aggregated.
- How much new for-sale + rental construction is in the pipeline within 1–3 miles? Heavy new supply typically softens prices + rents 12–24 months out; constrained supply supports both.
Investment metrics
- 1% rule
- 0.95% ✗
- Cap rate
- 6.83%
- Cash-on-cash
- 1.92%
- DSCR
- 1.09
- GRM
- 8.8
CMA / ARV
- ARV (median comp)
- $215,000
- List price
- $135,000
- Delta
- -37.21%
- Verdict
- UNDERPRICED
- Comps
- 5 within 1.0 mi
Show comp detail 4 sales within ~0.75 mi
| Address | Dist | Beds/Ba | Sqft | Sold | Price | $/sf | Match |
|---|---|---|---|---|---|---|---|
| 215 Lane 360 Jimmerson Lk | 0.38mi | 2/2.0 (-1) | 1,188 (+12%) | 1mo | $229,900 | $194 | 57 |
| 255 Ln 591 Lake James Ln | 0.69mi | 3/2.0 | 1,152 (+8%) | 3mo | $285,000 | $247 | 52 |
| 115 355 Ln | 0.44mi | 2/1.5 (-1) | 1,152 (+8%) | 9mo | $45,000 | $39 | 52 |
| 220 Lane 360 Jimmerson Lk | 0.40mi | 2/2.0 (-1) | 924 (-13%) | 11mo | $119,000 | $129 | 45 |
Match score weights: distance 35% · size 25% · config 20% · recency 20%. Top-matched comps best support the ARV.
Projected returns pro-forma
-3.0% appreciation · 3.0% rent growth · sell at horizon
- IRR
- -13.2%
- Equity multiple
- 0.52×
- Total profit
- $-17,984
- Equity at exit
- $20,129
- IRR
- -4.2%
- Equity multiple
- 0.72×
- Total profit
- $-10,559
- Equity at exit
- $11,672
Cash invested: $37,800 (down + closing). Projections, not guarantees.
Landlord ↔ Tenant lean methodology
- Overall (STATE)
- 90 Strongly Landlord-Friendly
- State Indiana
- 90 Strongly Landlord-Friendly · R+11
- County
- — inherits STATE
- City
- — inherits STATE
ZIP-level market 46737
- Home prices YoY
- -34.7%
- Active inventory
- 61
- Price-to-rent
- 8.8×
Monthly cashflow live
- Estimated rent
- $1,284 medium interval (Pro) →
- Mortgage (P&I)
- −$708
- Tax est. 1.5%
- −$169 /mo · $2,025/yr
- Insurance
- −$56
- HOA
- −$21
- Vacancy / Maint / Mgmt
- −$270
- Net cashflow
- $61
Break-even live
UW: 25.0% down · 7.5% · 30yr · 1.5% tax · 5.0% vac · 8.0% maint · 8.0% mgmt
Financing live
Cash to close
- Down payment
- $33,750
- Closing costs
- $4,050
- Reserves months
- —
- Total cash needed
- —
Loan-product check · same deal, 3 products live
Conventional
25% down · 7.5% · 30yr
- Down + closing
- —
- Monthly P&I
- —
- Monthly cashflow
- —
- DSCR
- —
- Eligible?
- —
Personal DTI + credit; lowest rate.
DSCR
20% down · 8.5% · 30yr
- Down + closing
- —
- Monthly P&I
- —
- Monthly cashflow
- —
- DSCR
- —
- Eligible?
- —
No personal income docs; deal must DSCR.
Hard money
10% down · 12.0% · 12mo
- Down + closing
- —
- Monthly P&I
- —
- Monthly cashflow
- —
- DSCR
- —
- Eligible?
- —
Short-term bridge; refi at stabilization.
HOA detail
- Monthly dues
- $21 · $252/yr
- Likely covers
- water
Listing history 19 events
-
2026-06-17status $135,000 Pending 53 DOM
-
2026-06-16days on market $135,000 Active 53 DOM
-
2026-06-15days on market $135,000 Active 52 DOM
-
2026-06-14days on market $135,000 Active 50 DOM
-
2026-06-12days on market $135,000 Active 49 DOM
-
2026-06-09days on market $135,000 Active 46 DOM
-
2026-06-08pricedays on market $135,000 Active 45 DOM
-
2026-06-07days on market $145,000 Active 44 DOM
-
2026-06-07days on market $145,000 Active 43 DOM
-
2026-06-04days on market $145,000 Active 40 DOM
-
2026-06-02days on market $145,000 Active 39 DOM
-
2026-06-01days on market $145,000 Active 38 DOM
-
2026-05-31days on market $145,000 Active 37 DOM
-
2026-05-31days on market $145,000 Active 36 DOM
-
2026-04-24$155,000 Active 824-char remark
-
2025-10-19price $160,000
-
2025-09-20price $175,000
-
2025-07-20price $190,000
-
2025-07-04$205,000 Active
ⓘ Source: listings_history table (triggers on properties + properties_extension) + one-shot
backfill from property_details.listing_events for pre-trigger history.
Climate risk First Street
- Flood 1/10 Low FEMA zone X (unshaded) · 0% chance over 30 yrs
- Wildfire 1/10 Low
- Heat 2/10 Low 7 d/yr ≥98°F today · 16 d/yr by 30 yrs out
- Wind 2/10 Low
- Air quality 2/10 Low 1 unhealthy d/yr today · 2 by 30 yrs out
Nearby sold comps map
Loading sold comps map…
Walkable amenities ~0.75 mi
Loading nearby amenities…
Taxation est. · year 1
- Rental income
- $15,411
- − Mortgage interest
- −$7,562
- − Property taxes
- −$2,025
- − Insurance
- −$675
- − Repairs & maintenance
- −$1,233
- − Management
- −$1,233
- − HOA
- −$252
- − Depreciation
- −$3,927
- Taxable loss
- −$1,496
- Est. tax savings @ 24.0%
- +$359
- After-tax cash flow
- $1,086/yr
For passive investors: Depreciation is non-cash, so a rental often shows a tax loss while cash-flowing — sheltering income. Rental losses are passive: they offset passive income freely, and up to $25,000/yr can offset ordinary (W-2) income if you actively participate and your MAGI is under $100k (phasing out to $0 by $150k); unused losses carry forward. On sale, claimed depreciation is recaptured at up to 25%, and gains may owe capital-gains tax (a 1031 exchange can defer both). Figures are a year-1 estimate at your 24.0% rate — not tax advice; consult a CPA.
Schools (NCES district)
- District
- Fremont Community Schools
- NCES district ID
- 1803780
- Math proficiency
- 42% ▼ -12.00%
- Reading proficiency
- 48% ▼ -5.00%
- Median HH income
- $54,625
- Composite
- 39.06/100
- National rank
- #4055
- State rank
- #94 of 301 in IN
Livability — Jimmerson Lake
No livability data for this city. (Only ~50 U.S. cities are tracked.)
Census & demographics
- Census place
- Jimmerson Lake, IN
- Population (ZIP)
- 7,076
Population outlook (Steuben County) Hauer SSP2
- Today (2025)
- 34,334 people
- By 2030
- 33,801 · -1.6%
- By 2040
- 32,076 · -6.6%
- By 2050
- 30,022 · -12.6%
- By 2075
- 25,626 · -25.4%
- By 2100
- 21,257 · -38.1%
Race, ethnicity, and origin ACS 2023
- Neighborhood character
- Predominantly White (94%)
- Race & ethnicity
- White 94% Two or more races 4% Hispanic / Latino 2%
- Common ancestry
- Romanian 4% Slovak 3% Lithuanian 2%
- Foreign-born
- 1% · Canada
- Languages at home
- 98% English-only · Spanish 2%
Political lean MEDSL · Steuben
- 2024 margin
- Solid R (+42.1) · D 28.1% · R 70.2% · Other 1.6%
- 2008→2024 swing
- -32.3pp toward R · 2008: -9.8pp · 2024: -42.1pp
- All cycles
- 2024: R+42.1 2020: R+42.2 2016: R+44.0 2012: R+27.0 2008: R+9.8
Not yet ingested
- Civics
- —
Market trends
- HPI YoY
- ▼ -115.57%
- Current HPI
- 217.7195
- Rent YoY
- —
- Metro
- —
- State GDP YoY
- ▲ 2.90%
- F500 in state
- 18
Industry mix (Fortune 500 HQ in IN)
| Industry | F500 HQs | Revenue |
|---|---|---|
| Industrial Machinery | 2 | $37B |
|
||
| Healthcare | 1 | $177B |
|
||
| Pharmaceuticals | 1 | $45B |
|
||
| Metals / Steel | 1 | $18B |
|
||
| Agriculture | 1 | $17B |
|
||
| Packaging | 1 | $12B |
|
||
Price history
-34.1% since first listed8 events — show timeline
- 2026-06-16 Pending — IRMLS
- 2026-06-08 Price Changed $135,000 IRMLS
- 2026-05-23 Price Changed $145,000 IRMLS
- 2026-04-24 Listed $155,000 IRMLS
- 2025-10-19 Price Changed $160,000 IRMLS
- 2025-09-20 Price Changed $175,000 IRMLS
- 2025-07-20 Price Changed $190,000 IRMLS
- 2025-07-04 Listed $205,000 IRMLS
Property tax history
+5.3%/yrLatest (2024): $118 · +7.4% YoY. Source: county tax records.
Cash-flow waterfall
monthlySold comps — $/sqft
last 12 mo · ≤1 miLoading sold comps…