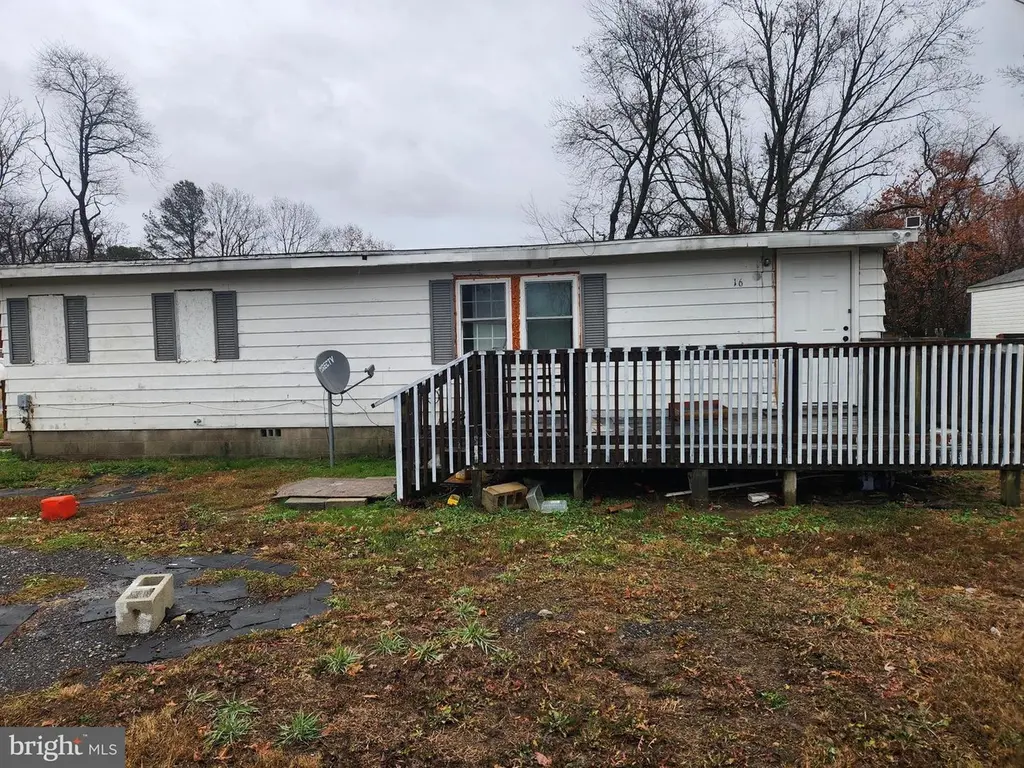
16 Berg Aly · Woodside East, DE
Flood risk 1/10 · Minimal
- FEMA flood zone
- X (unshaded)
- Chance of flooding over 30 yrs
- 0.0%
- Est. flood insurance / yr
- $507 – $1,088
Fire risk 1/10 · Minimal
- Est. fire insurance / yr
- $476 – $884
Heat risk 8/10 · Major
- Hot days now (above 103°F)
- 7 days/yr
- Hot days in 30 yrs
- 16 days/yr
Wind risk 6/10 · Moderate
- Chance of severe wind over 30 yrs
- 70.0%
Air-quality risk 2/10 · Minimal
- Unhealthy air days now
- 1 days/yr
- Unhealthy air days in 30 yrs
- 2 days/yr
Risk factors via First Street. Map © Google.
Why this score? — see what drove the B grade
The composite is a weighted blend of 9 inputs, each scored 0–100. Each bar is that input's sub-score; the figure is the points it added to the 100-point composite (weight × sub-score).
- Cash flow +30.0/30.0
- ARV discount +15.0/15.0
- DSCR +10.0/10.0
- 1% rule +8.3/10.0
- Schools +3.3/10.0
- Livability +2.7/5.0
- Rent growth +2.5/5.0
- Condition / age +2.5/5.0
- Appreciation +0.0/10.0
$120,000
🖨 Deal sheet (PDF) 📄 Offer letter ✓ Due diligence
Listing remarks MLS
Property being sold 'AS IS, WHERE IS'. No repairs will be done. NOTE: Hold Harmless must be signed prior to showing.
Key facts
- 0.28 acre lot
- Built 1968
- Listed 530 days
Neighborhood map
What this means for you Summary
Snapshot
- This is a 2-bed/1.0-bath manufactured listed at $120k.
Deal economics
- At list price, monthly cash flow is $550 ($7k/yr) — positive.
- The deal already cash-flows at list — no discount required.
- Meets the 1% rule at list price ($2k rent vs $120k).
- Recommended offer: $106k (12.0% below list) — sets the bar for market timing.
- Cap rate 11.8% vs local median 3.9% in Woodside East — top-decile yield for the area; either an underpriced asset or a hidden risk that comps aren't pricing in. Stress-test before assuming the spread holds.
Location & tenants
- Location reads 53/100 on livability (#73 in DE) — a working-class tenant base; expect higher turnover. Strengths: cost of living A+, crime A; Watch: employment D+, schools D-, amenities F.
- Caesar Rodney School District (suburban): math 26% / reading 49% proficiency, ranked #9 of 26 in DE (top 35%) — families likely to look elsewhere, expect single-tenant / working-renter base with shorter leases.
- Market conditions: 126 active listings in the ZIP; 1,201 units permitted in Kent County in 2024 (116 in 5+ unit buildings).
Forward outlook
- Local home prices are declining (-3.0%/yr); year-one equity from $830 of loan paydown is wiped out by about $4k of value loss. Plan a longer hold.
- Kent County population projected at +22% by 2050 — long-run rental-demand tailwind backs the buy-and-hold thesis.
- At projected returns (-3.0% appreciation + 3.0% rent growth), your $34k cash investment doubles in ~7 years — after that, you're playing with house money.
Negotiation context
- It's been on market 531 days — a 12% lower offer ($106k) is reasonable based on typical stale-listing flexibility.
- Current owner paid $9k; list at $120k implies a 1190% gain — meaningful room to come down on a strong offer.
Risks & watch-outs
- Climate carrying-cost: major wind risk, 70% chance of damaging wind over 30y; extreme-heat days projected 7→16/yr by 2055 (HVAC capex compounding) — expect insurance premiums to compound above CPI over the hold.
Questions for the listing agent
- It's been on market 531 days. Have you received any prior offers? Is the seller open to a 12% concession, seller financing, or rate buy-down credit?
- Built in 1968 — when were the roof, HVAC, electrical panel, plumbing, and water heater last replaced?
- Why hasn't it sold? Are there any deal-killer items the seller is aware of (foundation, flood, title, zoning, code violations)?
- Is there a deadline driving the sale (1031 exchange, divorce, estate, relocation)? That informs how much negotiation room exists.
- Schools are D-rated, which usually means shorter tenancies and higher turnover. Who's the typical renter profile here, and what's been the actual vacancy rate?
- What's the average days-on-market for RENTAL listings here right now (not sales)? A rising rental-DOM trend means longer vacancies and softer asking-rent achievability than the comps imply.
- What's the recent tenant-quality profile in this submarket — average credit score on applications, eviction rate, late-payment / NSF rate, and stable-employment percentage? A property-management company in the area should have these aggregated.
- How much new for-sale + rental construction is in the pipeline within 1–3 miles? Heavy new supply typically softens prices + rents 12–24 months out; constrained supply supports both.
Investment metrics
- 1% rule
- 1.33% ✓
- Cap rate
- 11.80%
- Cash-on-cash
- 19.66%
- DSCR
- 1.87
- GRM
- 6.3
CMA / ARV
- ARV (median comp)
- $214,970
- List price
- $120,000
- Delta
- -44.18%
- Verdict
- UNDERPRICED
- Comps
- 12 within 1.0 mi
Show comp detail 3 sales within ~0.75 mi
| Address | Dist | Beds/Ba | Sqft | Sold | Price | $/sf | Match |
|---|---|---|---|---|---|---|---|
| 235 Stevenson Dr | 0.07mi | 2/1.0 | 780 (0%) | 19mo | $52,500 | $67 | 81 |
| 105 S Draper Cir | 0.11mi | 2/1.0 | 720 (-8%) | 14mo | $73,000 | $101 | 71 |
| 84 Bertha Dr | 0.43mi | 2/1.0 | 732 (-6%) | 22mo | $55,000 | $75 | 51 |
Match score weights: distance 35% · size 25% · config 20% · recency 20%. Top-matched comps best support the ARV.
Projected returns pro-forma
-3.0% appreciation · 3.0% rent growth · sell at horizon
- IRR
- 11.7%
- Equity multiple
- 1.46×
- Total profit
- $15,561
- Equity at exit
- $17,892
- IRR
- 20.6%
- Equity multiple
- 2.74×
- Total profit
- $58,492
- Equity at exit
- $10,375
Cash invested: $33,600 (down + closing). Projections, not guarantees.
Landlord ↔ Tenant lean methodology
- Overall (STATE)
- 70 Landlord-Friendly
- State Delaware
- 70 Landlord-Friendly · D+7
- County
- — inherits STATE
- City
- — inherits STATE
ZIP-level market 19962
- Home prices YoY
- -29.4%
- Active inventory
- 126
- Price-to-rent
- 6.3×
Monthly cashflow live
- Estimated rent
- $1,596 medium interval (Pro) →
- Mortgage (P&I)
- −$629
- Tax from tax record
- −$31 /mo · $378/yr
- Insurance
- −$50
- HOA
- −$0
- Vacancy / Maint / Mgmt
- −$335
- Net cashflow
- $550
Break-even live
Sensitivity live
| Price | -10% $618 | -5% $584 | +0% $550 | +5% $516 | +10% $482 |
|---|---|---|---|---|---|
| Rent | -10% $424 | -5% $487 | +0% $550 | +5% $613 | +10% $677 |
| Rate | -1.0pp $611 | -0.5pp $581 | base $550 | +0.5pp $519 | +1.0pp $488 |
UW: 25.0% down · 7.5% · 30yr · 1.5% tax · 5.0% vac · 8.0% maint · 8.0% mgmt
Financing live
Cash to close
- Down payment
- $30,000
- Closing costs
- $3,600
- Reserves months
- —
- Total cash needed
- —
Loan-product check · same deal, 3 products live
Conventional
25% down · 7.5% · 30yr
- Down + closing
- —
- Monthly P&I
- —
- Monthly cashflow
- —
- DSCR
- —
- Eligible?
- —
Personal DTI + credit; lowest rate.
DSCR
20% down · 8.5% · 30yr
- Down + closing
- —
- Monthly P&I
- —
- Monthly cashflow
- —
- DSCR
- —
- Eligible?
- —
No personal income docs; deal must DSCR.
Hard money
10% down · 12.0% · 12mo
- Down + closing
- —
- Monthly P&I
- —
- Monthly cashflow
- —
- DSCR
- —
- Eligible?
- —
Short-term bridge; refi at stabilization.
Listing history 19 events
-
2026-06-21days on market $120,000 Active 531 DOM
-
2026-06-19days on market $120,000 Active 529 DOM
-
2026-06-18days on market $120,000 Active 528 DOM
-
2026-06-17days on market $120,000 Active 527 DOM
-
2026-06-16days on market $120,000 Active 526 DOM
-
2026-06-15days on market $120,000 Active 525 DOM
-
2026-06-14days on market $120,000 Active 523 DOM
-
2026-06-13days on market $120,000 Active 522 DOM
-
2026-06-10days on market $120,000 Active 520 DOM
-
2026-06-09days on market $120,000 Active 519 DOM
-
2026-06-08days on market $120,000 Active 518 DOM
-
2026-06-07days on market $120,000 Active 517 DOM
-
2026-06-02days on market $120,000 Active 512 DOM
-
2026-06-01days on market $120,000 Active 511 DOM
-
2026-05-31days on market $120,000 Active 510 DOM
-
2026-05-30days on market $120,000 Active 509 DOM
-
2025-01-06$120,000 Active 117-char remark
Show marketing remark (117 chars)
Property being sold 'AS IS, WHERE IS'. No repairs will be done. NOTE: Hold Harmless must be signed prior to showing.
-
2014-01-28soldstatus $9,300
-
1991-08-01soldstatus $5,500
ⓘ Source: listings_history table (triggers on properties + properties_extension) + one-shot
backfill from property_details.listing_events for pre-trigger history.
Tax reassessment forecast DE · Partial reset (capped growth)
- Current annual tax
- $378 · $31/mo
- Projected year-2 tax
- $537 · $45/mo
- Expected delta
- +$159/yr (+$13/mo · 42.1%)
ⓘ Screening estimate from a state-policy table — verify with the county assessor before closing.
Climate risk First Street
- Flood 1/10 Low FEMA zone X (unshaded) · 0% chance over 30 yrs
- Wildfire 1/10 Low
- Heat 8/10 Severe 7 d/yr ≥103°F today · 16 d/yr by 30 yrs out
- Wind 6/10 Major 70% chance of damaging wind over 30 yrs
- Air quality 2/10 Low 1 unhealthy d/yr today · 2 by 30 yrs out
Nearby sold comps map
Loading sold comps map…
Walkable amenities ~0.75 mi
Loading nearby amenities…
Taxation est. · year 1
- Rental income
- $19,157
- − Mortgage interest
- −$6,722
- − Property taxes
- −$378
- − Insurance
- −$600
- − Repairs & maintenance
- −$1,533
- − Management
- −$1,533
- − Depreciation
- −$3,491
- Taxable income
- $4,901
- Est. tax owed @ 24.0%
- −$1,176
- After-tax cash flow
- $5,428/yr
For passive investors: Depreciation is non-cash, so a rental often shows a tax loss while cash-flowing — sheltering income. Rental losses are passive: they offset passive income freely, and up to $25,000/yr can offset ordinary (W-2) income if you actively participate and your MAGI is under $100k (phasing out to $0 by $150k); unused losses carry forward. On sale, claimed depreciation is recaptured at up to 25%, and gains may owe capital-gains tax (a 1031 exchange can defer both). Figures are a year-1 estimate at your 24.0% rate — not tax advice; consult a CPA.
Schools (NCES district)
- District
- Caesar Rodney School District
- NCES district ID
- 1000180
- Math proficiency
- 26% ▼ -21.00%
- Reading proficiency
- 49% ▼ -14.00%
- Median HH income
- $61,187
- Composite
- 33.4/100
- National rank
- #5475
- State rank
- #9 of 26 in DE
Livability — Woodside East
- Score
- 53/100
- State rank
- #73
- US rank
- #24275
Category grades
Schools grade is shown separately in the Schools card above.
Census & demographics
- Census place
- Woodside East, DE
- Population (ZIP)
- 12,618
Population outlook (Kent County) Hauer SSP2
- Today (2025)
- 194,477 people
- By 2030
- 204,351 · +5.1%
- By 2040
- 222,135 · +14.2%
- By 2050
- 236,483 · +21.6%
- By 2075
- 266,327 · +36.9%
- By 2100
- 275,335 · +41.6%
Race, ethnicity, and origin ACS 2023
- Neighborhood character
- Diverse neighborhood (Simpson 0.61)
- Race & ethnicity
- White 58% Black 23% Two or more races 10% Hispanic / Latino 6% Asian 4% Native American 2%
- Hispanic origin (detail)
- Mexican 1% Puerto Rican 3%
- Common ancestry
- Swiss 4% Italian 3% Iranian 2%
- Foreign-born
- 8% · Canada
- Languages at home
- 91% English-only · Spanish 4% Other Indo-European 2% Tagalog/Filipino 2%
Political lean MEDSL · Kent
- 2024 margin
- Toss-up / Even · D 50.2% · R 48.2% · Other 1.7%
- 2008→2024 swing
- -7.8pp toward R · 2008: 9.8pp · 2024: 2.0pp
- All cycles
- 2024: D+2.0 2020: D+4.1 2016: R+4.9 2012: D+4.9 2008: D+9.8
Not yet ingested
- Civics
- —
Market trends
- HPI YoY
- ▼ -77.63%
- Current HPI
- 186.7318
- Rent YoY
- —
- Metro
- —
- State GDP YoY
- —
- F500 in state
- 0
Price history
+2081.8% since first listed3 events — show timeline
- 2025-01-06 Listed $120,000 BRIGHT MLS
- 2014-01-28 Sold (Public Records) $9,300 Public Records
- 1991-08-01 Sold (Public Records) $5,500 Public Records
Property tax history
+6.8%/yrLatest (2025): $378 · +1.3% YoY. Source: county tax records.
Cash-flow waterfall
monthlySold comps — $/sqft
last 12 mo · ≤1 miLoading sold comps…