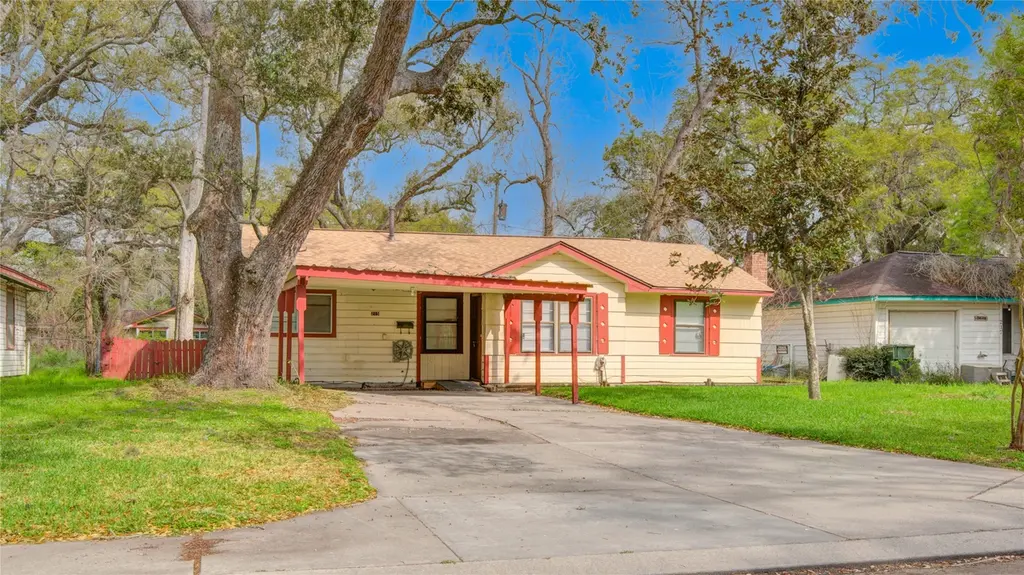
215 Cypress St · Lake Jackson, TX
Flood risk 6/10 · Moderate
- FEMA flood zone
- X
- Chance of flooding over 30 yrs
- 0.57%
- Est. flood insurance / yr
- $507 – $1,088
Fire risk 3/10 · Minor
- Est. fire insurance / yr
- $1,222 – $2,270
Heat risk 10/10 · Severe
- Hot days now (above 114°F)
- 7 days/yr
- Hot days in 30 yrs
- 26 days/yr
Wind risk 9/10 · Severe
- Chance of severe wind over 30 yrs
- 99.0%
Air-quality risk 2/10 · Minimal
- Unhealthy air days now
- 1 days/yr
- Unhealthy air days in 30 yrs
- 1 days/yr
Risk factors via First Street. Map © Google.
Why this score? — see what drove the C grade
The composite is a weighted blend of 9 inputs, each scored 0–100. Each bar is that input's sub-score; the figure is the points it added to the 100-point composite (weight × sub-score).
- Cash flow +21.2/30.0
- ARV discount +12.6/15.0
- DSCR +6.7/10.0
- 1% rule +6.2/10.0
- Livability +3.9/5.0
- Schools +3.7/10.0
- Condition / age +2.5/5.0
- Rent growth +2.2/5.0
- Appreciation +0.0/10.0
$155,000
🖨 Deal sheet 📄 Offer letter ✓ Due diligence
Listing remarks MLS
Investor Special! This spacious 4-bedroom, 2-bath home is packed with potential and ready for the right buyer to bring it to life. Whether you're looking to flip, rent, or customize your next project, this property offers plenty of room to work with. Fully fenced-in backyard—great for privacy, pets, or future landscaping. Handy storage shed perfect for tools, equipment, or hobby space. Generous square footage and a layout that invites creativity, this is the kind of opportunity investors keep an eye out for. A little vision will go a long way here. Schedule your showing today!
Key facts
- Handy storage shed
- 8,698 sq ft lot
- Parking
Tags
Neighborhood map
What this means for you Summary
Snapshot
- This is a 4-bed/1.0-bath single-family listed at $155k.
Deal economics
- At list price, monthly cash flow is $223 ($3k/yr) — positive.
- The deal already cash-flows at list — no discount required.
- Meets the 1% rule at list price ($2k rent vs $155k).
- Recommended offer: $141k (9.0% below list) — sets the bar for market timing.
- Cap rate 8.0% vs local median 3.8% in Lake Jackson — top-decile yield for the area; either an underpriced asset or a hidden risk that comps aren't pricing in. Stress-test before assuming the spread holds.
Location & tenants
- Location reads 78/100 on livability (#76 in TX, #2,709 nationally) — a middle-class / working-renter tenant base. Strengths: employment A+, cost of living A+, housing A+; Watch: amenities C-, commute F.
- Brazosport ISD (suburban): math 43% / reading 41% proficiency, ranked #305 of 826 in TX (top 37%) — families likely to look elsewhere, expect single-tenant / working-renter base with shorter leases.
- Market conditions: Rents soft (-1.1%/yr); 224 active listings in the ZIP; 4 comparable units currently listed for rent nearby; rentals lingering (median 44d on market — plan ~5-8 weeks vacancy on turnover, expect pricing pressure); 75% of comp listings sitting > 30 days — soft ceiling on asking rent; solid renter incomes; 3,960 units permitted in Brazoria County in 2024 (593 in 5+ unit buildings).
Forward outlook
- Local home prices are declining (-3.0%/yr); year-one equity from $1k of loan paydown is wiped out by about $5k of value loss. Plan a longer hold.
- Brazoria County population projected at +44% by 2050 — long-run rental-demand tailwind backs the buy-and-hold thesis.
Negotiation context
- It's been on market 93 days — a 9% lower offer ($141k) is reasonable based on typical stale-listing flexibility.
- 4 sale attempts since 17y ago with the ask held roughly flat each time — persistent listings suggest the price (not the market) is what's stuck; bring a comps-based counter.
Risks & watch-outs
- Watch-outs: built in 1953 — expect roof / HVAC / electrical / plumbing capex.
- Climate carrying-cost: major flood risk; severe wind risk, 99% chance of damaging wind over 30y; extreme-heat days projected 7→26/yr by 2055 (HVAC capex compounding) — expect insurance premiums to compound above CPI over the hold.
Questions for the listing agent
- It's been on market 93 days. Have you received any prior offers? Is the seller open to a 9% concession, seller financing, or rate buy-down credit?
- Built in 1953 — when were the roof, HVAC, electrical panel, plumbing, and water heater last replaced?
- Why hasn't it sold? Are there any deal-killer items the seller is aware of (foundation, flood, title, zoning, code violations)?
- Is there a deadline driving the sale (1031 exchange, divorce, estate, relocation)? That informs how much negotiation room exists.
- What's the average days-on-market for RENTAL listings here right now (not sales)? A rising rental-DOM trend means longer vacancies and softer asking-rent achievability than the comps imply.
- What's the recent tenant-quality profile in this submarket — average credit score on applications, eviction rate, late-payment / NSF rate, and stable-employment percentage? A property-management company in the area should have these aggregated.
- How much new for-sale + rental construction is in the pipeline within 1–3 miles? Heavy new supply typically softens prices + rents 12–24 months out; constrained supply supports both.
Investment metrics
- 1% rule
- 1.12% ✓
- Cap rate
- 8.02%
- Cash-on-cash
- 6.16%
- DSCR
- 1.27
- GRM
- 7.5
CMA / ARV
- ARV (median comp)
- $174,832
- List price
- $155,000
- Delta
- -11.34%
- Verdict
- UNDERPRICED
- Comps
- 20 within 1.0 mi
Show comp detail 12 sales within ~0.75 mi
| Address | Dist | Beds/Ba | Sqft | Sold | Price | $/sf | Match |
|---|---|---|---|---|---|---|---|
| 244 Caladium St | 0.20mi | 4/2.0 | 1,275 (+6%) | 0mo | $205,000 | $161 | 77 |
| 513 Gardenia St | 0.17mi | 3/1.0 (-1) | 1,250 (+4%) | 11mo | $199,900 | $160 | 72 |
| 846 Magnolia St | 0.25mi | 4/2.0 | 1,144 (-5%) | 10mo | $189,900 | $166 | 68 |
| 207 Cypress St | 0.06mi | 3/1.0 (-1) | 1,321 (+9%) | 12mo | $185,000 | $140 | 66 |
| 419 Narcissus St | 0.38mi | 3/2.0 (-1) | 1,273 (+5%) | 3mo | $225,000 | $177 | 62 |
| 216 N Shady Oaks St | 0.54mi | 3/1.0 (-1) | 1,278 (+6%) | 1mo | $175,000 | $137 | 59 |
| 54 Blackgum Ct | 0.70mi | 3/2.0 (-1) | 1,229 (+2%) | 1mo | $244,900 | $199 | 55 |
| 841 Magnolia St | 0.26mi | 3/1.0 (-1) | 1,026 (-15%) | 5mo | $150,000 | $146 | 54 |
| 504 Elm St | 0.63mi | 3/1.0 (-1) | 1,189 (-2%) | 12mo | $150,000 | $126 | 53 |
| 420 Azalea St | 0.66mi | 3/1.0 (-1) | 1,334 (+10%) | 2mo | $100,000 | $75 | 46 |
| 225 Laurel St | 0.36mi | 3/1.0 (-1) | 1,030 (-15%) | 10mo | $160,000 | $155 | 45 |
| 119 Mulberry St | 0.66mi | 3/2.0 (-1) | 1,324 (+10%) | 9mo | $199,900 | $151 | 37 |
Match score weights: distance 35% · size 25% · config 20% · recency 20%. Top-matched comps best support the ARV.
Projected returns pro-forma
-3.0% appreciation · 0.0% rent growth · sell at horizon
- IRR
- -10.4%
- Equity multiple
- 0.63×
- Total profit
- $-15,923
- Equity at exit
- $23,111
- IRR
- -6.2%
- Equity multiple
- 0.66×
- Total profit
- $-14,895
- Equity at exit
- $13,402
Cash invested: $43,400 (down + closing). Projections, not guarantees.
Landlord ↔ Tenant lean methodology
- Overall (STATE)
- 87 Strongly Landlord-Friendly
- State Texas
- 87 Strongly Landlord-Friendly · R+5
- County
- — inherits STATE
- City
- — inherits STATE
ZIP-level market 77566
- Home prices YoY
- -25.2%
- Rents YoY
- -1.1%
- Active inventory
- 224
- Price-to-rent
- 7.5×
Monthly cashflow live
- Estimated rent
- $1,730 medium interval (Pro) →
- Mortgage (P&I)
- −$813
- Tax from tax record
- −$266 /mo · $3,196/yr
- Insurance
- −$65
- HOA
- −$0
- Vacancy / Maint / Mgmt
- −$363
- Net cashflow
- $223
Break-even live
UW: 25.0% down · 7.5% · 30yr · 1.5% tax · 5.0% vac · 8.0% maint · 8.0% mgmt
Financing live
Cash to close
- Down payment
- $38,750
- Closing costs
- $4,650
- Reserves months
- —
- Total cash needed
- —
Loan-product check · same deal, 3 products live
Conventional
25% down · 7.5% · 30yr
- Down + closing
- —
- Monthly P&I
- —
- Monthly cashflow
- —
- DSCR
- —
- Eligible?
- —
Personal DTI + credit; lowest rate.
DSCR
20% down · 8.5% · 30yr
- Down + closing
- —
- Monthly P&I
- —
- Monthly cashflow
- —
- DSCR
- —
- Eligible?
- —
No personal income docs; deal must DSCR.
Hard money
10% down · 12.0% · 12mo
- Down + closing
- —
- Monthly P&I
- —
- Monthly cashflow
- —
- DSCR
- —
- Eligible?
- —
Short-term bridge; refi at stabilization.
Rent comps 4 comps
| Address | Beds | Baths | Sqft | Rent | $/sqft | DOM | Units | Dist |
|---|---|---|---|---|---|---|---|---|
| 460 TX-332 Lake Jackson, TX | 1.0–3.0 | 1.0–2.0 | 836 | $1,453 | $1.74 | 43d | 17 | 0.44mi |
| 460 TX-332 Lake Jackson, TX | 1.0–3.0 | 1.0–2.0 | 836 | $1,203 | $1.44 | 3d | 11 | 0.44mi |
| 214 Oleander St Lake Jackson, TX | 3.0 | 2.0 | 1423 | $2,000 | $1.41 | 43d | 1 | 1.09mi |
| 6 Brazoswood Dr Clute, TX | 3.0 | 2.0 | 1167 | $1,300 | $1.11 | 43d | 1 | 1.48mi |
Listing history 22 events
-
2026-06-18days on market $155,000 Active 93 DOM
-
2026-06-17days on market $155,000 Active 92 DOM
-
2026-06-16days on market $155,000 Active 91 DOM
-
2026-06-15days on market $155,000 Active 90 DOM
-
2026-06-13days on market $155,000 Active 88 DOM
-
2026-06-09days on market $155,000 Active 84 DOM
-
2026-06-08days on market $155,000 Active 83 DOM
-
2026-06-07days on market $155,000 Active 82 DOM
-
2026-06-04days on market $155,000 Active 79 DOM
-
2026-06-03days on market $155,000 Active 78 DOM
-
2026-06-02days on market $155,000 Active 77 DOM
-
2026-06-01days on market $155,000 Active 76 DOM
-
2026-05-31days on market $155,000 Active 75 DOM
-
2026-04-13status Active 589-char remark
Show marketing remark (589 chars)
Investor Special! This spacious 4-bedroom, 2-bath home is packed with potential and ready for the right buyer to bring it to life. Whether you're looking to flip, rent, or customize your next project, this property offers plenty of room to work with. Fully fenced-in backyard—great for privacy, pets, or future landscaping. Handy storage shed perfect for tools, equipment, or hobby space. Generous square footage and a layout that invites creativity, this is the kind of opportunity investors keep an eye out for. A little vision will go a long way here. Schedule your showing today!
-
2026-04-02status Pending 589-char remark
Show marketing remark (589 chars)
Investor Special! This spacious 4-bedroom, 2-bath home is packed with potential and ready for the right buyer to bring it to life. Whether you're looking to flip, rent, or customize your next project, this property offers plenty of room to work with. Fully fenced-in backyard—great for privacy, pets, or future landscaping. Handy storage shed perfect for tools, equipment, or hobby space. Generous square footage and a layout that invites creativity, this is the kind of opportunity investors keep an eye out for. A little vision will go a long way here. Schedule your showing today!
-
2026-03-17$155,000 Active 589-char remark
Show marketing remark (589 chars)
Investor Special! This spacious 4-bedroom, 2-bath home is packed with potential and ready for the right buyer to bring it to life. Whether you're looking to flip, rent, or customize your next project, this property offers plenty of room to work with. Fully fenced-in backyard—great for privacy, pets, or future landscaping. Handy storage shed perfect for tools, equipment, or hobby space. Generous square footage and a layout that invites creativity, this is the kind of opportunity investors keep an eye out for. A little vision will go a long way here. Schedule your showing today!
-
2010-04-02historical
-
2009-11-10$92,500
-
2009-11-04historical
-
2009-05-20$95,700
-
2008-02-13soldstatus
-
2004-09-10soldstatus
ⓘ Source: listings_history table (triggers on properties + properties_extension) + one-shot
backfill from property_details.listing_events for pre-trigger history.
Tax reassessment forecast TX · Resets to sale price
- Current annual tax
- $3,196 · $266/mo
- Projected year-2 tax
- $3,196 · $266/mo
- Expected delta
- $0/yr ($0/mo · -0.0%)
ⓘ Screening estimate from a state-policy table — verify with the county assessor before closing.
Climate risk First Street
- Flood 6/10 Major FEMA zone X · 57% chance over 30 yrs
- Wildfire 3/10 Moderate
- Heat 10/10 Extreme 7 d/yr ≥114°F today · 26 d/yr by 30 yrs out
- Wind 9/10 Extreme 99% chance of damaging wind over 30 yrs
- Air quality 2/10 Low 1 unhealthy d/yr today · 1 by 30 yrs out
Nearby sold comps map
Loading sold comps map…
Walkable amenities ~0.75 mi
Loading nearby amenities…
Taxation est. · year 1
- Rental income
- $20,759
- − Mortgage interest
- −$8,682
- − Property taxes
- −$3,196
- − Insurance
- −$775
- − Repairs & maintenance
- −$1,661
- − Management
- −$1,661
- − Depreciation
- −$4,509
- Taxable income
- $275
- Est. tax owed @ 24.0%
- −$66
- After-tax cash flow
- $2,608/yr
For passive investors: Depreciation is non-cash, so a rental often shows a tax loss while cash-flowing — sheltering income. Rental losses are passive: they offset passive income freely, and up to $25,000/yr can offset ordinary (W-2) income if you actively participate and your MAGI is under $100k (phasing out to $0 by $150k); unused losses carry forward. On sale, claimed depreciation is recaptured at up to 25%, and gains may owe capital-gains tax (a 1031 exchange can defer both). Figures are a year-1 estimate at your 24.0% rate — not tax advice; consult a CPA.
Schools (NCES district)
- District
- Brazosport ISD
- NCES district ID
- 4811190
- Math proficiency
- 43% ▼ -6.00%
- Reading proficiency
- 41% ▼ -2.00%
- Median HH income
- $57,024
- Composite
- 36.84/100
- National rank
- #4557
- State rank
- #305 of 826 in TX
Livability — Lake Jackson
- Score
- 78/100
- State rank
- #76
- US rank
- #2709
Category grades
Schools grade is shown separately in the Schools card above.
Census & demographics
- Census place
- Lake Jackson, TX
- County
- Brazoria County · 374,982 people
- City population
- 30,246
- Metro
- Houston-The Woodlands-Sugar Land, TX
- Population (ZIP)
- 30,246
- Household income
- $92,586
- Rent vs Own
- Severe rent burden
- 1126.0
Population outlook (Brazoria County) Hauer SSP2
- Today (2025)
- 420,414 people
- By 2030
- 457,585 · +8.8%
- By 2040
- 532,232 · +26.6%
- By 2050
- 605,399 · +44.0%
- By 2075
- 779,358 · +85.4%
- By 2100
- 883,759 · +110.2%
Race, ethnicity, and origin ACS 2023
- Neighborhood character
- Diverse neighborhood (Simpson 0.56)
- Race & ethnicity
- White 60% Hispanic / Latino 28% Two or more races 16% Black 7% Asian 2%
- Hispanic origin (detail)
- Mexican 24%
- Common ancestry
- Lithuanian 3% Serbian 2% Italian 1%
- Foreign-born
- 8% · Canada, South Korea
- Languages at home
- 83% English-only · Spanish 15% Arabic 1% Tagalog/Filipino 1%
Political lean MEDSL · Brazoria
- 2024 margin
- R (+19.7) · D 39.5% · R 59.2% · Other 1.3%
- 2008→2024 swing
- +9.9pp toward D · 2008: -29.6pp · 2024: -19.7pp
- All cycles
- 2024: R+19.7 2020: R+18.2 2016: R+24.6 2012: R+34.2 2008: R+29.6
Not yet ingested
- Civics
- —
Market trends
- HPI YoY
- ▼ -84.81%
- Current HPI
- 251.8234
- Rent YoY
- ▼ -1.11%
- Metro
- Houston-The Woodlands-Sugar Land, TX
- State GDP YoY
- ▲ 3.95%
- F500 in state
- 110
Industry mix (Fortune 500 HQ in TX)
| Industry | F500 HQs | Revenue |
|---|---|---|
| Energy | 16 | $1,198B |
|
||
| Technology | 5 | $198B |
|
||
| Engineering / Construction | 4 | $72B |
|
||
| Energy Services | 3 | $60B |
|
||
| Utilities | 3 | $41B |
|
||
| Healthcare | 2 | $330B |
|
||
Price history
+62.0% since first listed9 events — show timeline
- 2026-04-13 Relisted — HARMLS
- 2026-04-02 Pending — HARMLS
- 2026-03-17 Listed $155,000 HARMLS
- 2010-04-02 Listing Removed — HARMLS
- 2009-11-10 Listed $92,500 HARMLS
- 2009-11-04 Listing Removed — HARMLS
- 2009-05-20 Listed $95,700 HARMLS
- 2008-02-13 Sold (Public Records) — Public Records
- 2004-09-10 Sold (Public Records) — Public Records
Property tax history
+4.2%/yrLatest (2025): $3,196 · -0.3% YoY. Source: county tax records.
Cash-flow waterfall
monthlySold comps — $/sqft
last 12 mo · ≤1 miLoading sold comps…