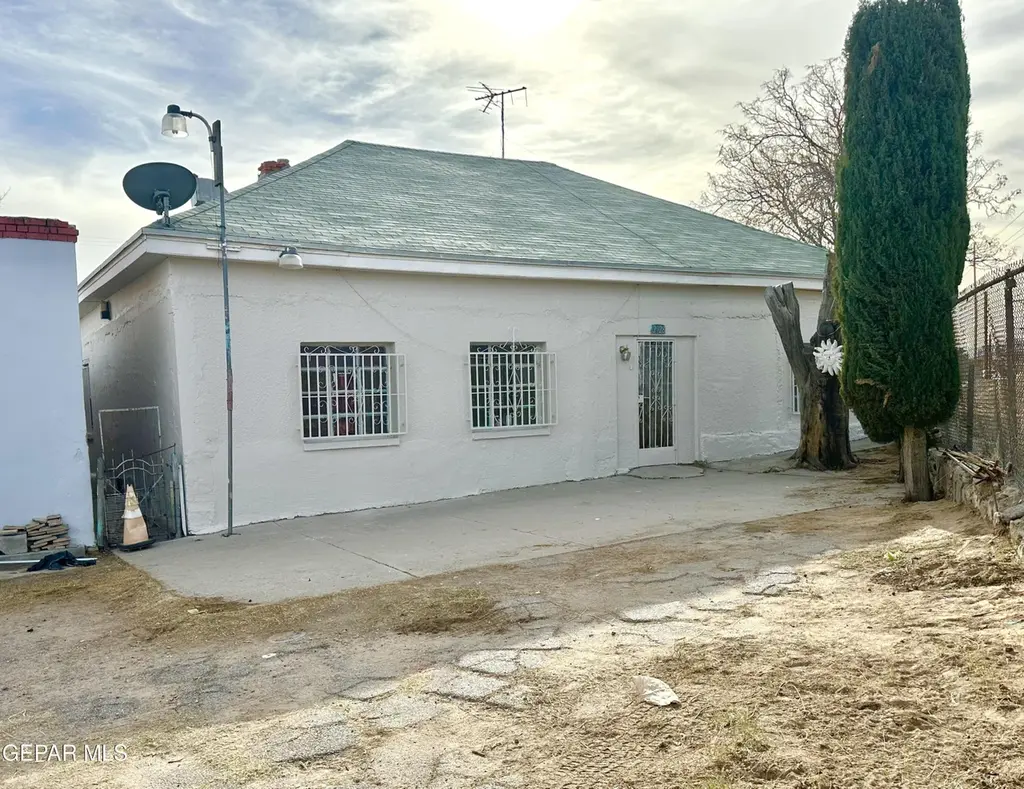
2928 E San Antonio Ave · El Paso, TX
Flood risk 4/10 · Minor
- FEMA flood zone
- X
- Chance of flooding over 30 yrs
- 0.23%
- Est. flood insurance / yr
- $507 – $1,088
Fire risk 1/10 · Minimal
- Est. fire insurance / yr
- $1,222 – $2,270
Heat risk 6/10 · Moderate
- Hot days now (above 102°F)
- 7 days/yr
- Hot days in 30 yrs
- 25 days/yr
Wind risk 1/10 · Minimal
- Chance of severe wind over 30 yrs
- —
Air-quality risk 2/10 · Minimal
- Unhealthy air days now
- 1 days/yr
- Unhealthy air days in 30 yrs
- 1 days/yr
Risk factors via First Street. Map © Google.
Why this score? — see what drove the B- grade
The composite is a weighted blend of 9 inputs, each scored 0–100. Each bar is that input's sub-score; the figure is the points it added to the 100-point composite (weight × sub-score).
- Cash flow +22.9/30.0
- Appreciation +10.0/10.0
- ARV discount +7.5/15.0
- DSCR +7.4/10.0
- 1% rule +7.0/10.0
- Livability +4.0/5.0
- Schools +2.7/10.0
- Rent growth +2.5/5.0
- Condition / age +2.5/5.0
$200,000
🖨 Deal sheet 📄 Offer letter ✓ Due diligence
Listing remarks MLS
Wonderful single level duplex home with a third unit in the back. Each unit offers a unique opportunity for distribution of space. The main home features a duplex. Each unit offers a single bedroom and a large dining room which can be a possible second bedroom conversion. Each unit in the main home also features a wonderful living area and 1 spacious restroom with a tub and shower. Both kitchens are very good size, ideal for wonderful meals. The third unit is in the backyard and it features a wonderful bedroom, a full bathroom and a spacious living room. The kitchen is ideal for the space and it is flooded with tons of natural light. Located in an area with close proximity to the freeway and commercial areas. It is also with close proximity to a park. Preview Today!
Key facts
- 7,000 sq ft lot
- Built 1930
- Listed 822 days
Neighborhood map
What this means for you Summary
Snapshot
- This is a ?-bed/2.0-bath single-family listed at $200k.
Deal economics
- At list price, monthly cash flow is $352 ($4k/yr) — positive.
- The deal already cash-flows at list — no discount required.
- Meets the 1% rule at list price ($2k rent vs $200k).
- Recommended offer: $176k (12.0% below list) — sets the bar for market timing.
Location & tenants
- Location reads 81/100 on livability (#23 in TX, #1,375 nationally) — a professional / high-income tenant draw. Strengths: commute A+, cost of living A+, housing A+; Watch: employment D+.
- El Paso ISD (urban): math 27% / reading 37% proficiency, ranked #591 of 826 in TX (top 72%) — families likely to look elsewhere, expect single-tenant / working-renter base with shorter leases; 65% free/reduced lunch — lower-income household profile, screen leases tightly.
- Market conditions: 60 active listings in the ZIP; 5 comparable units currently listed for rent nearby; rentals at typical pace (median 24d on market — plan ~3-4 weeks tenant-placement turnaround); 2,196 units permitted in El Paso County in 2024 (143 in 5+ unit buildings).
Forward outlook
- In year one you build about $21k of equity ($1k loan paydown + $20k appreciation (10.0% local appreciation)).
- El Paso County population projected at +10% by 2050 — modest demand growth; plan on rents tracking national, not racing it.
- At projected returns (10.0% appreciation + 3.0% rent growth), your $56k cash investment doubles in ~3 years — after that, you're playing with house money.
- By year 2, paydown + projected appreciation supports a ~$34k cash-out refi (75% LTV) — recoverable capital for the next deal without selling this one.
Negotiation context
- It's been on market 823 days — a 12% lower offer ($176k) is reasonable based on typical stale-listing flexibility.
- 2 sale attempts since 3y ago with the ask held roughly flat each time — persistent listings suggest the price (not the market) is what's stuck; bring a comps-based counter.
Risks & watch-outs
- Watch-outs: built in 1930 — expect roof / HVAC / electrical / plumbing capex.
- Climate carrying-cost: extreme-heat days projected 7→25/yr by 2055 (HVAC capex compounding) — expect insurance premiums to compound above CPI over the hold.
Questions for the listing agent
- It's been on market 823 days. Have you received any prior offers? Is the seller open to a 12% concession, seller financing, or rate buy-down credit?
- Built in 1930 — when were the roof, HVAC, electrical panel, plumbing, and water heater last replaced?
- Why hasn't it sold? Are there any deal-killer items the seller is aware of (foundation, flood, title, zoning, code violations)?
- Is there a deadline driving the sale (1031 exchange, divorce, estate, relocation)? That informs how much negotiation room exists.
- Schools are B-rated — typically a magnet for longer-tenancy family renters. What's the average tenant stay here, and is there a school-zone premium baked into asking?
- What's the average days-on-market for RENTAL listings here right now (not sales)? A rising rental-DOM trend means longer vacancies and softer asking-rent achievability than the comps imply.
- What's the recent tenant-quality profile in this submarket — average credit score on applications, eviction rate, late-payment / NSF rate, and stable-employment percentage? A property-management company in the area should have these aggregated.
- How much new for-sale + rental construction is in the pipeline within 1–3 miles? Heavy new supply typically softens prices + rents 12–24 months out; constrained supply supports both.
Investment metrics
- 1% rule
- 1.20% ✓
- Cap rate
- 8.40%
- Cash-on-cash
- 7.53%
- DSCR
- 1.34
- GRM
- 6.9
CMA / ARV
No comps found within radius.
Projected returns pro-forma
10.0% appreciation · 3.0% rent growth · sell at horizon
- IRR
- 29.8%
- Equity multiple
- 3.35×
- Total profit
- $131,452
- Equity at exit
- $180,176
- IRR
- 25.9%
- Equity multiple
- 7.60×
- Total profit
- $369,772
- Equity at exit
- $388,556
Cash invested: $56,000 (down + closing). Projections, not guarantees.
Landlord ↔ Tenant lean methodology
- Overall (STATE)
- 87 Strongly Landlord-Friendly
- State Texas
- 87 Strongly Landlord-Friendly · R+5
- County
- — inherits STATE
- City
- — inherits STATE
ZIP-level market 79905
- Home prices YoY
- 12.8%
- Active inventory
- 60
- Price-to-rent
- 6.9×
Monthly cashflow live
- Estimated rent
- $2,404 high interval (Pro) →
- Mortgage (P&I)
- −$1,049
- Tax from tax record
- −$415 /mo · $4,981/yr
- Insurance
- −$83
- HOA
- −$0
- Vacancy / Maint / Mgmt
- −$505
- Net cashflow
- $352
Break-even live
UW: 25.0% down · 7.5% · 30yr · 1.5% tax · 5.0% vac · 8.0% maint · 8.0% mgmt
Financing live
Cash to close
- Down payment
- $50,000
- Closing costs
- $6,000
- Reserves months
- —
- Total cash needed
- —
Loan-product check · same deal, 3 products live
Conventional
25% down · 7.5% · 30yr
- Down + closing
- —
- Monthly P&I
- —
- Monthly cashflow
- —
- DSCR
- —
- Eligible?
- —
Personal DTI + credit; lowest rate.
DSCR
20% down · 8.5% · 30yr
- Down + closing
- —
- Monthly P&I
- —
- Monthly cashflow
- —
- DSCR
- —
- Eligible?
- —
No personal income docs; deal must DSCR.
Hard money
10% down · 12.0% · 12mo
- Down + closing
- —
- Monthly P&I
- —
- Monthly cashflow
- —
- DSCR
- —
- Eligible?
- —
Short-term bridge; refi at stabilization.
Rent comps 5 comps
| Address | Beds | Baths | Sqft | Rent | $/sqft | DOM | Units | Dist |
|---|---|---|---|---|---|---|---|---|
| 3004 E Yandell Dr El Paso, TX | 2.0 | 1.0 | 1400 | $1,600 | $1.14 | 14d | 1 | 0.79mi |
| 1519 Golden Hill Ter El Paso, TX | 2.0 | 2.5 | 1600 | $2,750 | $1.72 | 43d | 6 | 1.17mi |
| 1519 Golden Hill Ter Unit 8 El Paso, TX | 2.0 | 2.5 | 1650 | $2,950 | $1.79 | 23d | 1 | 1.17mi |
| 1519 Golden Hill Ter Unit 5 El Paso, TX | 2.0 | 2.5 | 1550 | $2,550 | $1.65 | 23d | 1 | 1.17mi |
| 1805 Gurss Pl El Paso, TX | 3.0 | 1.5 | 2198 | $2,400 | $1.09 | 2d | 1 | 1.48mi |
Listing history 19 events
-
2026-06-18days on market $200,000 Active 823 DOM
-
2026-06-17days on market $200,000 Active 822 DOM
-
2026-06-16days on market $200,000 Active 821 DOM
-
2026-06-15days on market $200,000 Active 820 DOM
-
2026-06-13days on market $200,000 Active 818 DOM
-
2026-06-13days on market $200,000 Active 817 DOM
-
2026-06-10days on market $200,000 Active 815 DOM
-
2026-06-09days on market $200,000 Active 814 DOM
-
2026-06-08days on market $200,000 Active 813 DOM
-
2026-06-07days on market $200,000 Active 812 DOM
-
2026-06-05days on market $200,000 Active 809 DOM
-
2026-06-03days on market $200,000 Active 808 DOM
-
2026-06-03days on market $200,000 Active 807 DOM
-
2026-06-01days on market $200,000 Active 806 DOM
-
2026-05-31days on market $200,000 Active 805 DOM
-
2024-03-17$200,000 Active 792-char remark
Show marketing remark (792 chars)
Wonderful single level duplex home with a third unit in the back. Each unit offers a unique opportunity for distribution of space. The main home features a duplex. Each unit offers a single bedroom and a large dining room which can be a possible second bedroom conversion. Each unit in the main home also features a wonderful living area and 1 spacious restroom with a tub and shower. Both kitchens are very good size, ideal for wonderful meals. The third unit is in the backyard and it features a wonderful bedroom, a full bathroom and a spacious living room. The kitchen is ideal for the space and it is flooded with tons of natural light. Located in an area with close proximity to the freeway and commercial areas. It is also with close proximity to a park. Preview Today!
-
2023-11-02historical
-
2023-06-02$167,200 Active
-
1977-10-01soldstatus
ⓘ Source: listings_history table (triggers on properties + properties_extension) + one-shot
backfill from property_details.listing_events for pre-trigger history.
Tax reassessment forecast TX · Resets to sale price
- Current annual tax
- $4,981 · $415/mo
- Projected year-2 tax
- $4,981 · $415/mo
- Expected delta
- $0/yr ($0/mo · 0.0%)
ⓘ Screening estimate from a state-policy table — verify with the county assessor before closing.
Climate risk First Street
- Flood 4/10 Moderate FEMA zone X · 23% chance over 30 yrs
- Wildfire 1/10 Low
- Heat 6/10 Major 7 d/yr ≥102°F today · 25 d/yr by 30 yrs out
- Wind 1/10 Low
- Air quality 2/10 Low 1 unhealthy d/yr today · 1 by 30 yrs out
Nearby sold comps map
Loading sold comps map…
Walkable amenities ~0.75 mi
Loading nearby amenities…
Taxation est. · year 1
- Rental income
- $28,842
- − Mortgage interest
- −$11,203
- − Property taxes
- −$4,981
- − Insurance
- −$1,000
- − Repairs & maintenance
- −$2,307
- − Management
- −$2,307
- − Depreciation
- −$5,818
- Taxable income
- $1,225
- Est. tax owed @ 24.0%
- −$294
- After-tax cash flow
- $3,924/yr
For passive investors: Depreciation is non-cash, so a rental often shows a tax loss while cash-flowing — sheltering income. Rental losses are passive: they offset passive income freely, and up to $25,000/yr can offset ordinary (W-2) income if you actively participate and your MAGI is under $100k (phasing out to $0 by $150k); unused losses carry forward. On sale, claimed depreciation is recaptured at up to 25%, and gains may owe capital-gains tax (a 1031 exchange can defer both). Figures are a year-1 estimate at your 24.0% rate — not tax advice; consult a CPA.
Schools (NCES district)
- District
- El Paso ISD
- NCES district ID
- 4818300
- Math proficiency
- 27% ▼ -24.00%
- Reading proficiency
- 37% ▼ -7.00%
- Median HH income
- $38,704
- Composite
- 26.75/100
- National rank
- #7138
- State rank
- #591 of 826 in TX
Livability — El Paso
- Score
- 81/100
- State rank
- #23
- US rank
- #1375
Category grades
Schools grade is shown separately in the Schools card above.
Census & demographics
- Census place
- El Paso, TX
- City population
- 630,223
- Population (ZIP)
- 22,062
Population outlook (El Paso County) Hauer SSP2
- Today (2025)
- 897,899 people
- By 2030
- 922,694 · +2.8%
- By 2040
- 960,492 · +7.0%
- By 2050
- 982,919 · +9.5%
- By 2075
- 997,266 · +11.1%
- By 2100
- 900,630 · +0.3%
Race, ethnicity, and origin ACS 2023
- Neighborhood character
- Predominantly Hispanic (93%)
- Race & ethnicity
- Hispanic / Latino 93% Two or more races 50% White 2% Native American 1% Pacific Islander 1%
- Hispanic origin (detail)
- Mexican 89%
- Foreign-born
- 32% · Canada
- Languages at home
- 14% English-only · Spanish 86%
Political lean MEDSL · El Paso
- 2024 margin
- D (+15.1) · D 57.0% · R 41.8% · Other 1.2%
- 2008→2024 swing
- -17.4pp toward R · 2008: 32.5pp · 2024: 15.1pp
- All cycles
- 2024: D+15.1 2020: D+35.1 2016: D+43.2 2012: D+32.6 2008: D+32.5
Not yet ingested
- Civics
- —
Market trends
- HPI YoY
- ▲ 29.29%
- Current HPI
- 258.3487
- Rent YoY
- —
- Metro
- —
- State GDP YoY
- ▲ 3.95%
- F500 in state
- 110
Industry mix (Fortune 500 HQ in TX)
| Industry | F500 HQs | Revenue |
|---|---|---|
| Energy | 16 | $1,198B |
|
||
| Technology | 5 | $198B |
|
||
| Engineering / Construction | 4 | $72B |
|
||
| Energy Services | 3 | $60B |
|
||
| Utilities | 3 | $41B |
|
||
| Healthcare | 2 | $330B |
|
||
Price history
+19.6% since first listed4 events — show timeline
- 2024-03-17 Listed $200,000 GEPARMLS
- 2023-11-02 Listing Removed — GEPARMLS
- 2023-06-02 Listed $167,200 GEPARMLS
- 1977-10-01 Sold (Public Records) — Public Records
Property tax history
+11.3%/yrLatest (2025): $4,981 · +79.5% YoY. Source: county tax records.
Cash-flow waterfall
monthlySold comps — $/sqft
last 12 mo · ≤1 miLoading sold comps…