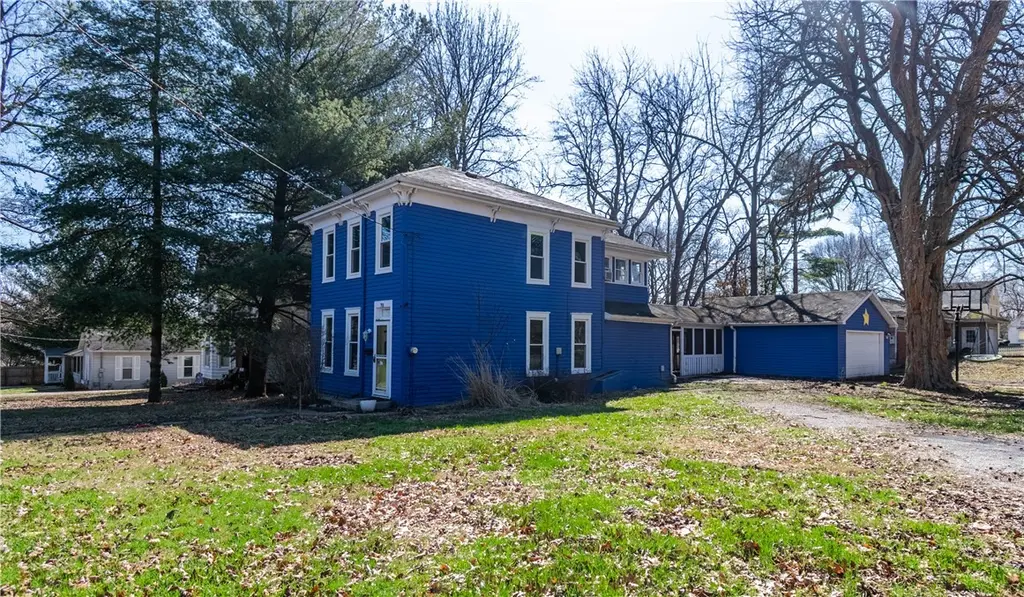
701 E 3rd St · Pana, IL
Flood risk 1/10 · Minimal
- FEMA flood zone
- X (unshaded)
- Chance of flooding over 30 yrs
- 0.0%
- Est. flood insurance / yr
- $473 – $860
Fire risk 1/10 · Minimal
- Est. fire insurance / yr
- $804 – $1,492
Heat risk 4/10 · Minor
- Hot days now (above 105°F)
- 7 days/yr
- Hot days in 30 yrs
- 20 days/yr
Wind risk 2/10 · Minimal
- Chance of severe wind over 30 yrs
- 2.0%
Air-quality risk 2/10 · Minimal
- Unhealthy air days now
- 1 days/yr
- Unhealthy air days in 30 yrs
- 2 days/yr
Risk factors via First Street. Map © Google.
Why this score? — see what drove the B- grade
The composite is a weighted blend of 9 inputs, each scored 0–100. Each bar is that input's sub-score; the figure is the points it added to the 100-point composite (weight × sub-score).
- Cash flow +26.0/30.0
- ARV discount +12.4/15.0
- DSCR +8.7/10.0
- 1% rule +8.2/10.0
- Livability +3.2/5.0
- Rent growth +2.5/5.0
- Condition / age +2.5/5.0
- Schools +2.1/10.0
- Appreciation +0.0/10.0
$65,000
🖨 Deal sheet 📄 Offer letter ✓ Due diligence
Listing remarks MLS
Sitting on a large corner lot, this 3 bed 2 bath home is waiting for the right owner to bring it back to it's original beauty. Think of this as a blank slate to create your next dream home!
Key facts
- 0.23 acre lot
- 2 garage spots
- Built 1920
Neighborhood map
What this means for you Summary
Snapshot
- This is a 3-bed/3.0-bath single-family listed at $65k.
Deal economics
- At list price, monthly cash flow is $161 ($2k/yr) — positive.
- The deal already cash-flows at list — no discount required.
- Meets the 1% rule at list price ($855 rent vs $65k).
- Recommended offer: $59k (9.0% below list) — sets the bar for market timing.
- Cap rate 9.3% vs local median 6.4% in Pana — top-decile yield for the area; either an underpriced asset or a hidden risk that comps aren't pricing in. Stress-test before assuming the spread holds.
Location & tenants
- Location reads 65/100 on livability (#599 in IL) — a middle-class / working-renter tenant base. Strengths: crime A+, cost of living A+, housing A+; Watch: schools F, amenities F, commute F.
- Pana CUSD 8 (town): math 20% / reading 29% proficiency, ranked #360 of 620 in IL (top 58%) — low school quality limits family demand, transient renter base, plan for 1-2y turnover.
- Market conditions: 66 active listings in the ZIP; 26 units permitted in Christian County in 2024 (0 in 5+ unit buildings).
Forward outlook
- Local home prices are declining (-3.0%/yr); year-one equity from $449 of loan paydown is wiped out by about $2k of value loss. Plan a longer hold.
- Christian County population projected at -24% by 2050 — secular population decline; favor cash flow + early exit over multi-decade hold.
Negotiation context
- It's been on market 91 days — a 9% lower offer ($59k) is reasonable based on typical stale-listing flexibility.
- 3 sale attempts since 12y ago; this cycle's ask has dropped $20k (24%) from the opening price — seller is motivated, your offer sets the floor, not the list.
Risks & watch-outs
- Watch-outs: property tax is 2.7% of price; built in 1920 — expect roof / HVAC / electrical / plumbing capex.
Questions for the listing agent
- It's been on market 91 days. Have you received any prior offers? Is the seller open to a 9% concession, seller financing, or rate buy-down credit?
- Built in 1920 — when were the roof, HVAC, electrical panel, plumbing, and water heater last replaced?
- Property tax is high relative to price — has the assessment been appealed recently, and will the sale trigger a re-assessment?
- Why hasn't it sold? Are there any deal-killer items the seller is aware of (foundation, flood, title, zoning, code violations)?
- Is there a deadline driving the sale (1031 exchange, divorce, estate, relocation)? That informs how much negotiation room exists.
- Schools are F-rated, which usually means shorter tenancies and higher turnover. Who's the typical renter profile here, and what's been the actual vacancy rate?
- What's the average days-on-market for RENTAL listings here right now (not sales)? A rising rental-DOM trend means longer vacancies and softer asking-rent achievability than the comps imply.
- What's the recent tenant-quality profile in this submarket — average credit score on applications, eviction rate, late-payment / NSF rate, and stable-employment percentage? A property-management company in the area should have these aggregated.
- How much new for-sale + rental construction is in the pipeline within 1–3 miles? Heavy new supply typically softens prices + rents 12–24 months out; constrained supply supports both.
Investment metrics
- 1% rule
- 1.32% ✓
- Cap rate
- 9.27%
- Cash-on-cash
- 10.63%
- DSCR
- 1.47
- GRM
- 6.3
CMA / ARV
- ARV (median comp)
- $72,992
- List price
- $65,000
- Delta
- -10.95%
- Verdict
- UNDERPRICED
- Comps
- 20 within 1.0 mi
Show comp detail 12 sales within ~0.75 mi
| Address | Dist | Beds/Ba | Sqft | Sold | Price | $/sf | Match |
|---|---|---|---|---|---|---|---|
| 117 Macarthur Blvd | 0.26mi | 3/1.0 | 770 (-4%) | 1mo | $88,400 | $115 | 73 |
| 136 Macarthur Blvd | 0.29mi | 3/1.0 | 816 (+2%) | 10mo | $70,000 | $86 | 67 |
| 112 Patton St | 0.29mi | 2/1.0 (-1) | 816 (+2%) | 4mo | $54,900 | $67 | 67 |
| 414 Maple St | 0.32mi | 3/1.0 | 800 (0%) | 14mo | $84,900 | $106 | 66 |
| 610 S Spruce St | 0.30mi | 2/1.0 (-1) | 768 (-4%) | 4mo | $24,200 | $32 | 63 |
| 708 E 5th St | 0.15mi | 2/1.0 (-1) | 758 (-5%) | 11mo | $65,000 | $86 | 62 |
| 108 Macarthur Blvd | 0.24mi | 2/1.0 (-1) | 768 (-4%) | 10mo | $14,500 | $19 | 61 |
| 115 Macarthur Blvd | 0.26mi | 2/1.0 (-1) | 720 (-10%) | 4mo | $49,900 | $69 | 55 |
| 900 E 1st St | 0.25mi | 2/1.0 (-1) | 720 (-10%) | 6mo | $69,000 | $96 | 54 |
| 106 Macarthur Blvd | 0.24mi | 2/1.0 (-1) | 860 (+8%) | 16mo | $78,000 | $91 | 50 |
| 4 W 6th St | 0.70mi | 2/1.0 (-1) | 748 (-6%) | 13mo | $25,000 | $33 | 32 |
| 304 N Poplar St | 0.65mi | 2/1.0 (-1) | 864 (+8%) | 19mo | $95,000 | $110 | 27 |
Match score weights: distance 35% · size 25% · config 20% · recency 20%. Top-matched comps best support the ARV.
Projected returns pro-forma
-3.0% appreciation · 3.0% rent growth · sell at horizon
- IRR
- -0.3%
- Equity multiple
- 0.99×
- Total profit
- $-211
- Equity at exit
- $9,692
- IRR
- 9.4%
- Equity multiple
- 1.73×
- Total profit
- $13,255
- Equity at exit
- $5,620
Cash invested: $18,200 (down + closing). Projections, not guarantees.
Landlord ↔ Tenant lean methodology
- Overall (STATE)
- 43 Moderately Tenant-Leaning
- State Illinois
- 43 Moderately Tenant-Leaning · D+7
- County
- — inherits STATE
- City
- — inherits STATE
ZIP-level market 62557
- Home prices YoY
- -18.5%
- Active inventory
- 66
- Price-to-rent
- 6.3×
Monthly cashflow live
- Estimated rent
- $855 medium interval (Pro) →
- Mortgage (P&I)
- −$341
- Tax from tax record
- −$147 /mo · $1,759/yr
- Insurance
- −$27
- HOA
- −$0
- Vacancy / Maint / Mgmt
- −$180
- Net cashflow
- $161
Break-even live
UW: 25.0% down · 7.5% · 30yr · 1.5% tax · 5.0% vac · 8.0% maint · 8.0% mgmt
Financing live
Cash to close
- Down payment
- $16,250
- Closing costs
- $1,950
- Reserves months
- —
- Total cash needed
- —
Loan-product check · same deal, 3 products live
Conventional
25% down · 7.5% · 30yr
- Down + closing
- —
- Monthly P&I
- —
- Monthly cashflow
- —
- DSCR
- —
- Eligible?
- —
Personal DTI + credit; lowest rate.
DSCR
20% down · 8.5% · 30yr
- Down + closing
- —
- Monthly P&I
- —
- Monthly cashflow
- —
- DSCR
- —
- Eligible?
- —
No personal income docs; deal must DSCR.
Hard money
10% down · 12.0% · 12mo
- Down + closing
- —
- Monthly P&I
- —
- Monthly cashflow
- —
- DSCR
- —
- Eligible?
- —
Short-term bridge; refi at stabilization.
Listing history 21 events
-
2026-06-19days on market $65,000 Active 91 DOM
-
2026-06-10days on market $65,000 Active 90 DOM
-
2026-06-09days on market $65,000 Active 89 DOM
-
2026-06-08days on market $65,000 Active 88 DOM
-
2026-06-07days on market $65,000 Active 87 DOM
-
2026-06-05days on market $65,000 Active 84 DOM
-
2026-06-03days on market $65,000 Active 83 DOM
-
2026-06-02days on market $65,000 Active 82 DOM
-
2026-06-01days on market $65,000 Active 81 DOM
-
2026-05-31days on market $65,000 Active 80 DOM
-
2026-05-30days on market $65,000 Active 79 DOM
-
2026-04-17price $65,000 189-char remark
Show marketing remark (189 chars)
Sitting on a large corner lot, this 3 bed 2 bath home is waiting for the right owner to bring it back to it's original beauty. Think of this as a blank slate to create your next dream home!
-
2026-03-12$85,000 Active 189-char remark
Show marketing remark (189 chars)
Sitting on a large corner lot, this 3 bed 2 bath home is waiting for the right owner to bring it back to it's original beauty. Think of this as a blank slate to create your next dream home!
-
2021-09-24soldstatus $67,000
-
2016-04-20soldstatus $40,000
-
2016-04-19soldstatus $40,000 566-char remark
Show marketing remark (566 chars)
This historical 2-story home sits on a 84' x 120' corner lot in the historical part of Pana. The home has been all updated with the wiring, plumbing and roof. The entire interior has been newly painted. Most of the flooring has the original hardwood flooring in place. Also present is the beautiful original stair case. Has a 13.6' x 8' sun room. The screened-in breeze way is attached to the 2-car garage which has a new insulated over head door. A large walk in closet is with the large bedroom. PRICE HAS BEEN DROPED TO $55,000.00. SELLER IS MOTIVATED TO SELL.
-
2016-04-19soldstatus $40,000
Show marketing remark (566 chars)
This historical 2-story home sits on a 84' x 120' corner lot in the historical part of Pana. The home has been all updated with the wiring, plumbing and roof. The entire interior has been newly painted. Most of the flooring has the original hardwood flooring in place. Also present is the beautiful original stair case. Has a 13.6' x 8' sun room. The screened-in breeze way is attached to the 2-car garage which has a new insulated over head door. A large walk in closet is with the large bedroom. PRICE HAS BEEN DROPED TO $55,000.00. SELLER IS MOTIVATED TO SELL.
-
2014-08-08$55,000 566-char remark
Show marketing remark (566 chars)
This historical 2-story home sits on a 84' x 120' corner lot in the historical part of Pana. The home has been all updated with the wiring, plumbing and roof. The entire interior has been newly painted. Most of the flooring has the original hardwood flooring in place. Also present is the beautiful original stair case. Has a 13.6' x 8' sun room. The screened-in breeze way is attached to the 2-car garage which has a new insulated over head door. A large walk in closet is with the large bedroom. PRICE HAS BEEN DROPED TO $55,000.00. SELLER IS MOTIVATED TO SELL.
-
2014-08-08$55,000
Show marketing remark (566 chars)
This historical 2-story home sits on a 84' x 120' corner lot in the historical part of Pana. The home has been all updated with the wiring, plumbing and roof. The entire interior has been newly painted. Most of the flooring has the original hardwood flooring in place. Also present is the beautiful original stair case. Has a 13.6' x 8' sun room. The screened-in breeze way is attached to the 2-car garage which has a new insulated over head door. A large walk in closet is with the large bedroom. PRICE HAS BEEN DROPED TO $55,000.00. SELLER IS MOTIVATED TO SELL.
-
2013-12-23historical
-
1995-03-01soldstatus $52,000
ⓘ Source: listings_history table (triggers on properties + properties_extension) + one-shot
backfill from property_details.listing_events for pre-trigger history.
Tax reassessment forecast IL · Partial reset (capped growth)
- Current annual tax
- $1,759 · $147/mo
- Projected year-2 tax
- $1,759 · $147/mo
- Expected delta
- $0/yr ($0/mo · 0.0%)
ⓘ Screening estimate from a state-policy table — verify with the county assessor before closing.
Climate risk First Street
- Flood 1/10 Low FEMA zone X (unshaded) · 0% chance over 30 yrs
- Wildfire 1/10 Low
- Heat 4/10 Moderate 7 d/yr ≥105°F today · 20 d/yr by 30 yrs out
- Wind 2/10 Low 2% chance of damaging wind over 30 yrs
- Air quality 2/10 Low 1 unhealthy d/yr today · 2 by 30 yrs out
Nearby sold comps map
Loading sold comps map…
Walkable amenities ~0.75 mi
Loading nearby amenities…
Taxation est. · year 1
- Rental income
- $10,264
- − Mortgage interest
- −$3,641
- − Property taxes
- −$1,759
- − Insurance
- −$325
- − Repairs & maintenance
- −$821
- − Management
- −$821
- − Depreciation
- −$1,891
- Taxable income
- $1,007
- Est. tax owed @ 24.0%
- −$242
- After-tax cash flow
- $1,693/yr
For passive investors: Depreciation is non-cash, so a rental often shows a tax loss while cash-flowing — sheltering income. Rental losses are passive: they offset passive income freely, and up to $25,000/yr can offset ordinary (W-2) income if you actively participate and your MAGI is under $100k (phasing out to $0 by $150k); unused losses carry forward. On sale, claimed depreciation is recaptured at up to 25%, and gains may owe capital-gains tax (a 1031 exchange can defer both). Figures are a year-1 estimate at your 24.0% rate — not tax advice; consult a CPA.
Schools (NCES district)
- District
- Pana CUSD 8
- NCES district ID
- 1730630
- Math proficiency
- 20% ▼ -4.00%
- Reading proficiency
- 29% ▼ -7.00%
- Median HH income
- $42,385
- Composite
- 20.88/100
- National rank
- #8493
- State rank
- #360 of 620 in IL
Livability — Pana
- Score
- 65/100
- State rank
- #599
- US rank
- #12409
Category grades
Schools grade is shown separately in the Schools card above.
Census & demographics
- Census place
- Pana, IL
- Population (ZIP)
- 6,859
Population outlook (Christian County) Hauer SSP2
- Today (2025)
- 31,182 people
- By 2030
- 29,787 · -4.5%
- By 2040
- 26,793 · -14.1%
- By 2050
- 23,757 · -23.8%
- By 2075
- 17,333 · -44.4%
- By 2100
- 11,573 · -62.9%
Race, ethnicity, and origin ACS 2023
- Neighborhood character
- Predominantly White (91%)
- Race & ethnicity
- White 91% Hispanic / Latino 5% Two or more races 3% Black 1%
- Common ancestry
- Lithuanian 4% Slovak 3% Romanian 3%
- Foreign-born
- 1% · Canada
Political lean MEDSL · Christian
- 2024 margin
- Solid R (+46.7) · D 25.9% · R 72.6% · Other 1.5%
- 2008→2024 swing
- -40.4pp toward R · 2008: -6.3pp · 2024: -46.7pp
- All cycles
- 2024: R+46.7 2020: R+44.6 2016: R+42.7 2012: R+23.1 2008: R+6.3
Not yet ingested
- Civics
- —
Market trends
- HPI YoY
- ▼ -30.82%
- Current HPI
- 135.6938
- Rent YoY
- —
- Metro
- —
- State GDP YoY
- ▲ 1.59%
- F500 in state
- 60
Industry mix (Fortune 500 HQ in IL)
| Industry | F500 HQs | Revenue |
|---|---|---|
| Insurance | 4 | $201B |
|
||
| Consumer Goods | 4 | $87B |
|
||
| Industrial Machinery | 3 | $64B |
|
||
| Healthcare | 2 | $55B |
|
||
| Retail / Pharmacy | 1 | $148B |
|
||
| Agriculture / Food | 1 | $86B |
|
||
Price history
+25.0% since first listed10 events — show timeline
- 2026-04-17 Price Changed $65,000 CIBR
- 2026-03-12 Listed $85,000 CIBR
- 2021-09-24 Sold (Public Records) $67,000 Public Records
- 2016-04-20 Sold (Public Records) $40,000 Public Records
- 2016-04-19 Sold (MLS) $40,000 MRED as Distributed by MLS Grid
- 2016-04-19 Sold (MLS) $40,000 CIBR
- 2014-08-08 Listed $55,000 MRED as Distributed by MLS Grid
- 2014-08-08 Listed $55,000 CIBR
- 2013-12-23 Listing Removed — MRED as Distributed by MLS Grid
- 1995-03-01 Sold (Public Records) $52,000 Public Records
Property tax history
+5.2%/yrLatest (2024): $1,759 · +6.2% YoY. Source: county tax records.
Cash-flow waterfall
monthlySold comps — $/sqft
last 12 mo · ≤1 miLoading sold comps…