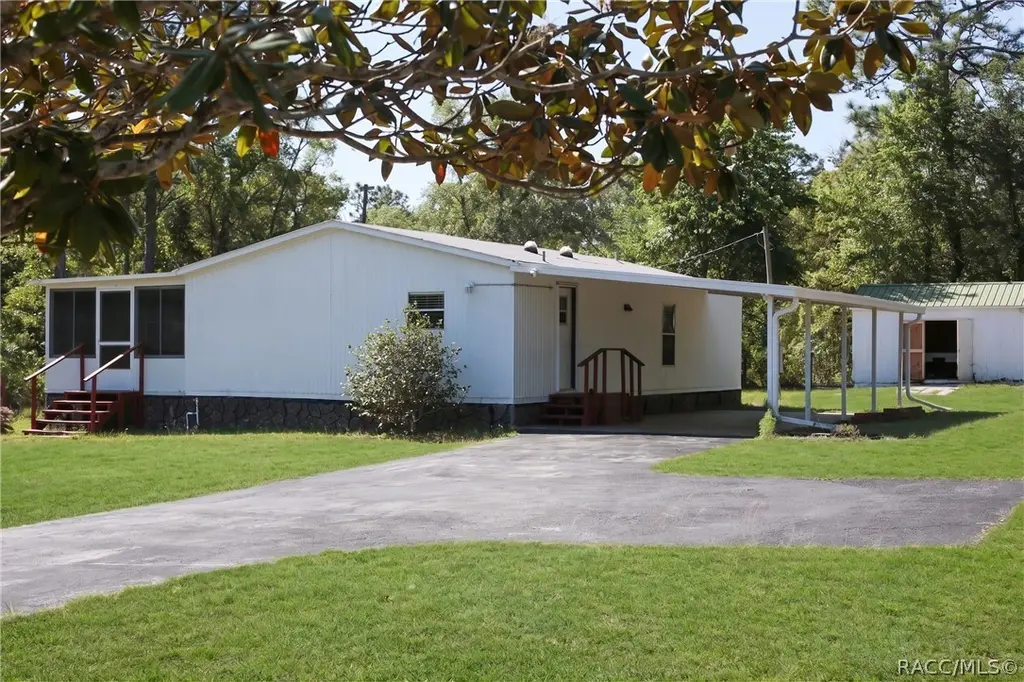
7444 S Cindy Pt · Sugarmill Woods, FL
Flood risk 5/10 · Moderate
- FEMA flood zone
- X (unshaded)
- Chance of flooding over 30 yrs
- 0.23%
- Est. flood insurance / yr
- $507 – $1,088
Fire risk 5/10 · Moderate
- Est. fire insurance / yr
- $947 – $1,759
Heat risk 10/10 · Severe
- Hot days now (above 108°F)
- 7 days/yr
- Hot days in 30 yrs
- 25 days/yr
Wind risk 9/10 · Severe
- Chance of severe wind over 30 yrs
- 99.0%
Air-quality risk 1/10 · Minimal
- Unhealthy air days now
- 0 days/yr
- Unhealthy air days in 30 yrs
- 0 days/yr
Risk factors via First Street. Map © Google.
Why this score? — see what drove the D+ grade
The composite is a weighted blend of 9 inputs, each scored 0–100. Each bar is that input's sub-score; the figure is the points it added to the 100-point composite (weight × sub-score).
- Cash flow +22.3/30.0
- DSCR +7.1/10.0
- 1% rule +5.1/10.0
- Schools +4.1/10.0
- Livability +3.0/5.0
- Rent growth +2.5/5.0
- Condition / age +2.5/5.0
- ARV discount +0.0/15.0
- Appreciation +0.0/10.0
$179,000
🖨 Deal sheet 📄 Offer letter ✓ Due diligence
Listing remarks MLS
Well Cared for 3 Bedroom/2 Bath Mobile Home. Located in Desirable Green Acres. Peaceful Setting on . 50 Acre, Relax in the 12 x 40 Sunroom, Open Floor Plan, New flooring Throughout. Call to see it Today !!
Key facts
- Master suite
- Quiet cul-de-sac
- Private bath
Tags
Property features AI
Exterior
- Parking: Paved driveway; Attached carport; Total 1 parking space
- Utilities: Private well water; Septic tank sewer
- Home design: Manufactured home (double wide); Residential property
- Construction: Membrane (rubber) roof
- Exterior features: Level lot; Paved road access; No pool
Interior
- Kitchen: Electric range and oven; Refrigerator; Dishwasher not listed
- Flooring: Laminate flooring; Tile flooring
- Bathrooms: 2 full bathrooms
- Heating & cooling: Heat pump heating; Central air conditioning
- Interior features: Dryer, Washer, Electric Oven, Electric Range, Refrigerator; Laminate and tile floors; Central air conditioning; Heat pump heating; 8 total rooms
- Laundry & utility: Washer and dryer included
Neighborhood map
What this means for you Summary
Snapshot
- This is a 3-bed/2.0-bath manufactured listed at $179k.
Deal economics
- At list price, monthly cash flow is $294 ($4k/yr) — positive.
- The deal already cash-flows at list — no discount required.
- Meets the 1% rule at list price ($2k rent vs $179k).
- Recommended offer: $174k (3.0% below list) — sets the bar for market timing.
- Cap rate 8.3% vs local median 4.0% in Sugarmill Woods — top-decile yield for the area; either an underpriced asset or a hidden risk that comps aren't pricing in. Stress-test before assuming the spread holds.
Location & tenants
- Location reads 59/100 on livability (#825 in FL) — a working-class tenant base; expect higher turnover. Strengths: cost of living A+, housing A+, crime B+; Watch: health & safety C-, amenities F, commute F.
- Citrus (rural): math 49% / reading 50% proficiency, ranked #44 of 73 in FL (top 60%) — families likely to look elsewhere, expect single-tenant / working-renter base with shorter leases.
- Zoned schools: Homosassa Elementary School (math 62% / reading 47%, grade C, #892 of 2,144 statewide, top 44%, 411 students, 78% FRL); Crystal River Middle School (math 49% / reading 47%, grade C-, #286 of 571 statewide, top 50%, 900 students, 64% FRL); Crystal River High School (math 31% / reading 44%, grade F, #336 of 667 statewide, top 51%, 1,249 students, 56% FRL).
- Market conditions: 582 active listings in the ZIP; 1 comparable units currently listed for rent nearby; 2,443 units permitted in Citrus County in 2024 (0 in 5+ unit buildings).
- This rent runs 37% of the median local income ($59k/yr) — at the standard rent-burdened threshold; future hikes will face affordability resistance.
Forward outlook
- Local home prices are declining (-3.0%/yr); year-one equity from $1k of loan paydown is wiped out by about $5k of value loss. Plan a longer hold.
- Citrus County population projected to shrink 10% by 2050 — rents likely to lag national; underwrite the cash flow, not the appreciation.
Negotiation context
- It's been on market 57 days — a 3% lower offer ($174k) is reasonable based on typical stale-listing flexibility.
- 3 sale attempts since 15y ago with the ask held roughly flat each time — persistent listings suggest the price (not the market) is what's stuck; bring a comps-based counter.
- Current owner paid $46k; list at $179k implies a 289% gain — meaningful room to come down on a strong offer.
Risks & watch-outs
- Climate carrying-cost: moderate flood risk; severe wind risk, 99% chance of damaging wind over 30y; moderate wildfire risk; extreme-heat days projected 7→25/yr by 2055 (HVAC capex compounding) — expect insurance premiums to compound above CPI over the hold.
Questions for the listing agent
- It's been on market 57 days. Have you received any prior offers? Is the seller open to a 3% concession, seller financing, or rate buy-down credit?
- Is there a deadline driving the sale (1031 exchange, divorce, estate, relocation)? That informs how much negotiation room exists.
- Schools are F-rated, which usually means shorter tenancies and higher turnover. Who's the typical renter profile here, and what's been the actual vacancy rate?
- The area grade is low — what's the realistic commute time and amenity access for the typical tenant pool here? Any planned neighborhood developments (good or bad) we should know about?
- What's the average days-on-market for RENTAL listings here right now (not sales)? A rising rental-DOM trend means longer vacancies and softer asking-rent achievability than the comps imply.
- What's the recent tenant-quality profile in this submarket — average credit score on applications, eviction rate, late-payment / NSF rate, and stable-employment percentage? A property-management company in the area should have these aggregated.
- How much new for-sale + rental construction is in the pipeline within 1–3 miles? Heavy new supply typically softens prices + rents 12–24 months out; constrained supply supports both.
Investment metrics
- 1% rule
- 1.01% ✓
- Cap rate
- 8.26%
- Cash-on-cash
- 7.04%
- DSCR
- 1.31
- GRM
- 8.3
CMA / ARV
- ARV (on-the-fly)
- $143,520
- Comps found
- 6
Show comp detail 6 sales within ~0.75 mi
| Address | Dist | Beds/Ba | Sqft | Sold | Price | $/sf | Match |
|---|---|---|---|---|---|---|---|
| 7305 S Threshold Pt | 0.41mi | 3/2.0 | 960 (+4%) | 2mo | $190,000 | $198 | 72 |
| 7471 S Nancy Pt | 0.06mi | 2/1.5 (-1) | 1,016 (+10%) | 8mo | $100,000 | $98 | 66 |
| 7400 S Mindy Pt | 0.58mi | 2/2.0 (-1) | 896 (-3%) | 3mo | $120,000 | $134 | 61 |
| 7227 S Finale Pt | 0.26mi | 2/1.0 (-1) | 784 (-15%) | 1mo | $169,600 | $216 | 53 |
| 6195 W Cardinal St | 0.72mi | 2/2.0 (-1) | 960 (+4%) | 7mo | $70,000 | $73 | 48 |
| 7112 Finale Pt. Pt | 0.34mi | 2/1.5 (-1) | 784 (-15%) | 8mo | $122,100 | $156 | 46 |
Match score weights: distance 35% · size 25% · config 20% · recency 20%. Top-matched comps best support the ARV.
Projected returns pro-forma
-3.0% appreciation · 3.0% rent growth · sell at horizon
- IRR
- -5.5%
- Equity multiple
- 0.79×
- Total profit
- $-10,321
- Equity at exit
- $26,689
- IRR
- 4.1%
- Equity multiple
- 1.30×
- Total profit
- $14,969
- Equity at exit
- $15,477
Cash invested: $50,120 (down + closing). Projections, not guarantees.
Landlord ↔ Tenant lean methodology
- Overall (STATE)
- 87 Strongly Landlord-Friendly
- State Florida
- 87 Strongly Landlord-Friendly · R+3
- County
- — inherits STATE
- City
- — inherits STATE
ZIP-level market 34446
- Home prices YoY
- -10.4%
- Active inventory
- 582
- Price-to-rent
- 8.3×
Monthly cashflow live
- Estimated rent
- $1,805 medium interval (Pro) →
- Mortgage (P&I)
- −$939
- Tax from tax record
- −$119 /mo · $1,429/yr
- Insurance
- −$75
- HOA
- −$0
- Vacancy / Maint / Mgmt
- −$379
- Net cashflow
- $294
Break-even live
UW: 25.0% down · 7.5% · 30yr · 1.5% tax · 5.0% vac · 8.0% maint · 8.0% mgmt
Financing live
Cash to close
- Down payment
- $44,750
- Closing costs
- $5,370
- Reserves months
- —
- Total cash needed
- —
Loan-product check · same deal, 3 products live
Conventional
25% down · 7.5% · 30yr
- Down + closing
- —
- Monthly P&I
- —
- Monthly cashflow
- —
- DSCR
- —
- Eligible?
- —
Personal DTI + credit; lowest rate.
DSCR
20% down · 8.5% · 30yr
- Down + closing
- —
- Monthly P&I
- —
- Monthly cashflow
- —
- DSCR
- —
- Eligible?
- —
No personal income docs; deal must DSCR.
Hard money
10% down · 12.0% · 12mo
- Down + closing
- —
- Monthly P&I
- —
- Monthly cashflow
- —
- DSCR
- —
- Eligible?
- —
Short-term bridge; refi at stabilization.
Rent comps 1 comps
| Address | Beds | Baths | Sqft | Rent | $/sqft | DOM | Units | Dist |
|---|---|---|---|---|---|---|---|---|
| 17 Jamaica St Homosassa, FL | 2.0 | 2.0 | 1100 | $1,500 | $1.36 | 21d | 1 | 0.91mi |
Listing history 20 events
-
2026-06-17status $179,000 Pending 57 DOM
-
2026-06-16days on market $179,000 Active 57 DOM
-
2026-06-15days on market $179,000 Active 56 DOM
-
2026-06-14days on market $179,000 Active 54 DOM
-
2026-06-13days on market $179,000 Active 53 DOM
-
2026-06-09days on market $179,000 Active 50 DOM
-
2026-06-08days on market $179,000 Active 49 DOM
-
2026-06-07days on market $179,000 Active 48 DOM
-
2026-06-03days on market $179,000 Active 44 DOM
-
2026-06-02days on market $179,000 Active 43 DOM
-
2026-06-01days on market $179,000 Active 42 DOM
-
2026-05-31days on market $179,000 Active 41 DOM
-
2026-05-30days on market $179,000 Active 40 DOM
-
2026-04-20$179,000 Active
-
2014-05-22soldstatus $46,000 205-char remark
Show marketing remark (205 chars)
Well Cared for 3 Bedroom/2 Bath Mobile Home. Located in Desirable Green Acres. Peaceful Setting on . 50 Acre, Relax in the 12 x 40 Sunroom, Open Floor Plan, New flooring Throughout. Call to see it Today !!
-
2014-05-20soldstatus $46,000
-
2014-01-17$54,900 205-char remark
Show marketing remark (205 chars)
Well Cared for 3 Bedroom/2 Bath Mobile Home. Located in Desirable Green Acres. Peaceful Setting on . 50 Acre, Relax in the 12 x 40 Sunroom, Open Floor Plan, New flooring Throughout. Call to see it Today !!
-
2011-02-20soldstatus $34,500 241-char remark
Show marketing remark (241 chars)
Here is a Good Buy on Double Wide with Front Porch and Carport on 1/2 Acre Lot PLUS * * * Gated Fenced Yard with 20 X 12 Work Shop and other out building. It is OK to park your RV on this property. This mh is partialy furnished also !!!!!!
-
2011-01-12$36,900 241-char remark
Show marketing remark (241 chars)
Here is a Good Buy on Double Wide with Front Porch and Carport on 1/2 Acre Lot PLUS * * * Gated Fenced Yard with 20 X 12 Work Shop and other out building. It is OK to park your RV on this property. This mh is partialy furnished also !!!!!!
-
1994-03-01soldstatus $10,000
ⓘ Source: listings_history table (triggers on properties + properties_extension) + one-shot
backfill from property_details.listing_events for pre-trigger history.
Tax reassessment forecast FL · Resets to sale price
- Current annual tax
- $1,429 · $119/mo
- Projected year-2 tax
- $1,486 · $124/mo
- Expected delta
- +$57/yr (+$5/mo · 4.0%)
ⓘ Screening estimate from a state-policy table — verify with the county assessor before closing.
Climate risk First Street
- Flood 5/10 Major FEMA zone X (unshaded) · 23% chance over 30 yrs
- Wildfire 5/10 Major
- Heat 10/10 Extreme 7 d/yr ≥108°F today · 25 d/yr by 30 yrs out
- Wind 9/10 Extreme 99% chance of damaging wind over 30 yrs
- Air quality 1/10 Low 0 unhealthy d/yr today · 0 by 30 yrs out
Nearby sold comps map
Loading sold comps map…
Walkable amenities ~0.75 mi
Loading nearby amenities…
Taxation est. · year 1
- Rental income
- $21,665
- − Mortgage interest
- −$10,027
- − Property taxes
- −$1,429
- − Insurance
- −$895
- − Repairs & maintenance
- −$1,733
- − Management
- −$1,733
- − Depreciation
- −$5,207
- Taxable income
- $641
- Est. tax owed @ 24.0%
- −$154
- After-tax cash flow
- $3,374/yr
For passive investors: Depreciation is non-cash, so a rental often shows a tax loss while cash-flowing — sheltering income. Rental losses are passive: they offset passive income freely, and up to $25,000/yr can offset ordinary (W-2) income if you actively participate and your MAGI is under $100k (phasing out to $0 by $150k); unused losses carry forward. On sale, claimed depreciation is recaptured at up to 25%, and gains may owe capital-gains tax (a 1031 exchange can defer both). Figures are a year-1 estimate at your 24.0% rate — not tax advice; consult a CPA.
Schools (NCES district)
- District
- Citrus
- NCES district ID
- 1200270
- Math proficiency
- 49% ▼ -10.00%
- Reading proficiency
- 50% ▼ -6.00%
- Median HH income
- $38,618
- Composite
- 41.28/100
- National rank
- #3519
- State rank
- #44 of 73 in FL
Livability — Sugarmill Woods
- Score
- 59/100
- State rank
- #825
- US rank
- #20184
Category grades
Schools grade is shown separately in the Schools card above.
Census & demographics
- Census place
- Sugarmill Woods, FL
- County
- Citrus County · 111,314 people
- City population
- 18,797
- Metro
- Homosassa Springs, FL
- Population (ZIP)
- 19,102
- Household income
- $58,802
- Rent vs Own
- Severe rent burden
- 121.0
Population outlook (Citrus County) Hauer SSP2
- Today (2025)
- 138,622 people
- By 2030
- 136,886 · -1.3%
- By 2040
- 132,009 · -4.8%
- By 2050
- 125,196 · -9.7%
- By 2075
- 108,570 · -21.7%
- By 2100
- 84,454 · -39.1%
Race, ethnicity, and origin ACS 2023
- Neighborhood character
- Predominantly White (87%)
- Race & ethnicity
- White 87% Two or more races 8% Hispanic / Latino 6%
- Hispanic origin (detail)
- Mexican 2% Puerto Rican 3%
- Common ancestry
- Romanian 4% Lithuanian 4% Slovak 3%
- Foreign-born
- 5% · Canada
- Languages at home
- 95% English-only · Spanish 4%
Political lean MEDSL · Citrus
- 2024 margin
- Solid R (+45.9) · D 26.8% · R 72.6%
- 2008→2024 swing
- -29.8pp toward R · 2008: -16.1pp · 2024: -45.9pp
- All cycles
- 2024: R+45.9 2020: R+41.0 2016: R+39.7 2012: R+21.9 2008: R+16.1
Not yet ingested
- Civics
- —
Market trends
- HPI YoY
- ▼ -32.11%
- Current HPI
- 277.2576
- Rent YoY
- —
- Metro
- Homosassa Springs, FL
- State GDP YoY
- ▲ 3.28%
- F500 in state
- 36
Industry mix (Fortune 500 HQ in FL)
| Industry | F500 HQs | Revenue |
|---|---|---|
| Industrial Technology | 2 | $29B |
|
||
| Insurance | 2 | $17B |
|
||
| Retail | 1 | $60B |
|
||
| Technology Distribution | 1 | $58B |
|
||
| Homebuilding | 1 | $35B |
|
||
| Technology Manufacturing | 1 | $35B |
|
||
Price history
+1690.0% since first listed7 events — show timeline
- 2026-04-20 Listed $179,000 RACC
- 2014-05-22 Sold (MLS) $46,000 RACC
- 2014-05-20 Sold (Public Records) $46,000 Public Records
- 2014-01-17 Listed $54,900 RACC
- 2011-02-20 Sold (MLS) $34,500 RACC
- 2011-01-12 Listed $36,900 RACC
- 1994-03-01 Sold (Public Records) $10,000 Public Records
Property tax history
+26.9%/yrLatest (2025): $1,429 · +7.8% YoY. Source: county tax records.
Cash-flow waterfall
monthlySold comps — $/sqft
last 12 mo · ≤1 miLoading sold comps…