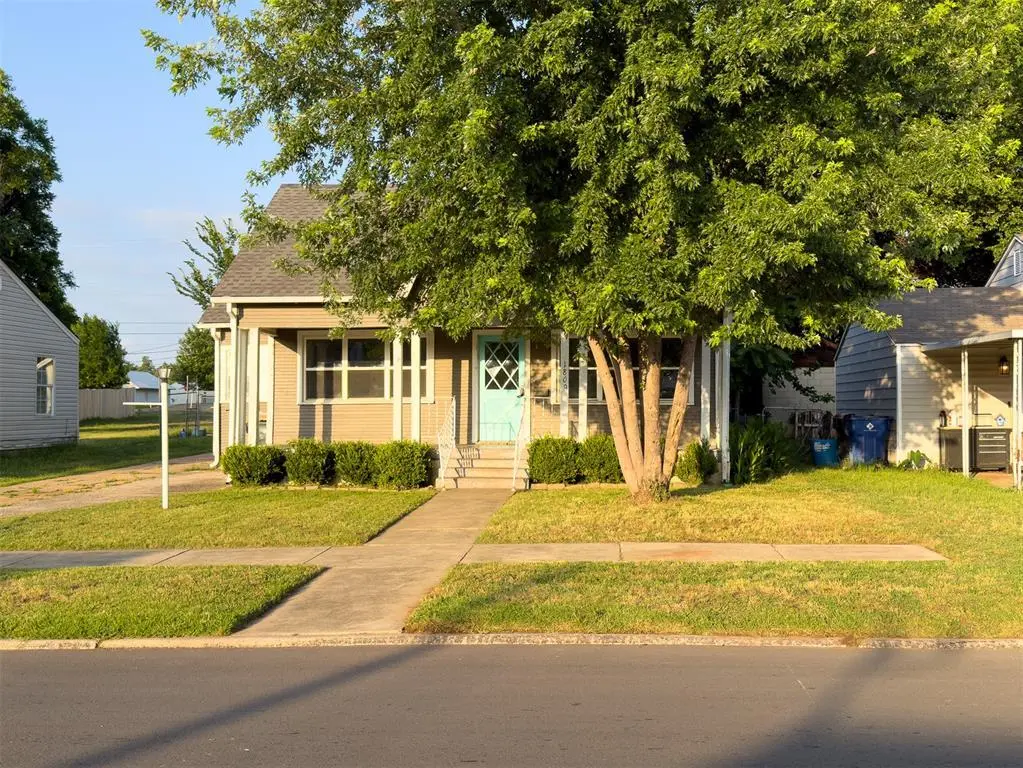
1809 S 14th St · Chickasha, OK
Flood risk No data
- FEMA flood zone
- —
- Chance of flooding over 30 yrs
- —
- Est. flood insurance / yr
- —
Fire risk No data
- Est. fire insurance / yr
- —
Heat risk No data
- Hot days now (above threshold)
- —
- Hot days in 30 yrs
- —
Wind risk No data
- Chance of severe wind over 30 yrs
- —
Air-quality risk No data
- Unhealthy air days now
- —
- Unhealthy air days in 30 yrs
- —
Risk factors via First Street. Map © Google.
Why this score? — see what drove the B- grade
The composite is a weighted blend of 9 inputs, each scored 0–100. Each bar is that input's sub-score; the figure is the points it added to the 100-point composite (weight × sub-score).
- Cash flow +27.3/30.0
- ARV discount +13.2/15.0
- DSCR +9.5/10.0
- 1% rule +6.6/10.0
- Livability +3.3/5.0
- Rent growth +2.5/5.0
- Condition / age +2.5/5.0
- Schools +2.1/10.0
- Appreciation +0.0/10.0
$114,000
🖨 Deal sheet 📄 Offer letter ✓ Due diligence
Listing remarks MLS
Super cute and extremely charming home! This one has been completely remodeled on the inside from top to bottom. Updates include paint, carpet, fixtures, kitchen and bath flooring, roof, windows, CH/A, and many more.....Three large bedrooms and a large living/dining room. The homes kitchen and living areas paired with the large backyard makes this home a great space for a family that likes to entertain. Come take a look because this one will not last long!!!
Key facts
- Covered front porch
- Fenced backyard
- Detached garage
Tags
Property features AI
Finance
- Other: Homestead not indicated; No storm shelter; Property level and details based on assessor; Directions: From 4th and Grand, head west on Grand to 14th Street. Turn right. Destination will be on the right in 0.2 miles.
- Financial info: Assumable loan: No; Current price listed (per listing): $114,000
- HOA & community: No mandatory association dues
Exterior
- Parking: 1-car garage
- Home design: Single family residence; One story; Faces west
- Construction: Frame and other construction materials; Composition roof; Conventional foundation; Existing property
- Exterior features: Interior lot
Interior
- Bedrooms: 3 bedrooms
- Bathrooms: 1 full bathroom; 1 half bathroom
- Heating & cooling: Electric heating
- Interior features: One living area; Covered porch
Neighborhood map
What this means for you Summary
Snapshot
- This is a 3-bed/2.0-bath single-family listed at $114k.
Deal economics
- At list price, monthly cash flow is $330 ($4k/yr) — positive.
- The deal already cash-flows at list — no discount required.
- Meets the 1% rule at list price ($1k rent vs $114k).
- Cap rate 9.8% vs local median 4.8% in Chickasha — top-decile yield for the area; either an underpriced asset or a hidden risk that comps aren't pricing in. Stress-test before assuming the spread holds.
Location & tenants
- Location reads 66/100 on livability (#117 in OK) — a middle-class / working-renter tenant base. Strengths: cost of living A+, housing A+; Watch: amenities F, commute F, health & safety F.
- Chickasha (town): math 23% / reading 27% proficiency, ranked #115 of 270 in OK (top 43%) — low school quality limits family demand, transient renter base, plan for 1-2y turnover; 64% free/reduced lunch — lower-income household profile, screen leases tightly.
- Zoned schools: Bill Wallace Ec Ctr (460 students, 0% FRL); Chickasha Hs (math 12% / reading 27%, grade F, #296 of 447 statewide, top 67%, 749 students, 0% FRL) — zoned schools average 0% FRL vs 64% district-wide (64 pts lower); this property's tenant base skews higher-income than the district average.
- Market conditions: 203 active listings in the ZIP; 13 comparable units currently listed for rent nearby; rentals leasing fast (median 2d on market — plan ~1-2 weeks tenant-placement turnaround); 224 units permitted in Grady County in 2024 (0 in 5+ unit buildings).
Forward outlook
- Local home prices are declining (-3.0%/yr); year-one equity from $788 of loan paydown is wiped out by about $3k of value loss. Plan a longer hold.
- Grady County population projected at +20% by 2050 — long-run rental-demand tailwind backs the buy-and-hold thesis.
- At projected returns (-3.0% appreciation + 3.0% rent growth), your $32k cash investment doubles in ~10 years — after that, you're playing with house money.
Negotiation context
- Only 10 days on market — expect competitive offers; lowballing is unlikely to land.
- 5 sale attempts since 22y ago with the ask held roughly flat each time — persistent listings suggest the price (not the market) is what's stuck; bring a comps-based counter.
- Current owner paid $60k; list at $114k implies a 90% gain — meaningful room to come down on a strong offer.
Risks & watch-outs
- Watch-outs: built in 1928 — expect roof / HVAC / electrical / plumbing capex.
Questions for the listing agent
- Built in 1928 — when were the roof, HVAC, electrical panel, plumbing, and water heater last replaced?
- Is there a deadline driving the sale (1031 exchange, divorce, estate, relocation)? That informs how much negotiation room exists.
- Schools are D-rated, which usually means shorter tenancies and higher turnover. Who's the typical renter profile here, and what's been the actual vacancy rate?
- What's the average days-on-market for RENTAL listings here right now (not sales)? A rising rental-DOM trend means longer vacancies and softer asking-rent achievability than the comps imply.
- What's the recent tenant-quality profile in this submarket — average credit score on applications, eviction rate, late-payment / NSF rate, and stable-employment percentage? A property-management company in the area should have these aggregated.
- How much new for-sale + rental construction is in the pipeline within 1–3 miles? Heavy new supply typically softens prices + rents 12–24 months out; constrained supply supports both.
Investment metrics
- 1% rule
- 1.16% ✓
- Cap rate
- 9.77%
- Cash-on-cash
- 12.42%
- DSCR
- 1.55
- GRM
- 7.2
CMA / ARV
- ARV (on-the-fly)
- $130,592
- Comps found
- 12
Show comp detail 12 sales within ~0.75 mi
| Address | Dist | Beds/Ba | Sqft | Sold | Price | $/sf | Match |
|---|---|---|---|---|---|---|---|
| 1012 Grand Ter | 0.33mi | 3/1.0 | 1,138 (-2%) | 1mo | $70,000 | $62 | 76 |
| 112 Taft Dr | 0.40mi | 3/2.0 | 1,201 (+3%) | 3mo | $170,000 | $142 | 74 |
| 709 W Alabama Ave | 0.49mi | 3/2.0 | 1,118 (-4%) | 1mo | $125,000 | $112 | 69 |
| 108 S 9th Street Cir | 0.54mi | 3/1.5 | 1,195 (+2%) | 3mo | $155,000 | $130 | 66 |
| 1127 S 10th St | 0.57mi | 2/1.5 (-1) | 1,162 (-0%) | 2mo | $105,000 | $90 | 64 |
| 1605 W Louisiana Ave | 0.64mi | 3/2.0 | 1,224 (+5%) | 4mo | $170,000 | $139 | 59 |
| 1909 W Louisiana Ave | 0.75mi | 3/2.0 | 1,211 (+4%) | 0mo | $199,000 | $164 | 58 |
| 926 S 9th St | 0.71mi | 3/1.5 | 1,122 (-4%) | 4mo | $115,000 | $102 | 56 |
| 1005 W Washington Ave | 0.65mi | 3/1.0 | 1,244 (+7%) | 3mo | $50,000 | $40 | 52 |
| 1020 S 14th St | 0.56mi | 2/1.0 (-1) | 1,063 (-9%) | 0mo | $96,000 | $90 | 50 |
| 1715 Arizona Ave | 0.49mi | 2/1.0 (-1) | 1,030 (-12%) | 3mo | $128,000 | $124 | 46 |
| 2418 S 16th St | 0.47mi | 2/1.0 (-1) | 1,012 (-13%) | 2mo | $75,000 | $74 | 45 |
Match score weights: distance 35% · size 25% · config 20% · recency 20%. Top-matched comps best support the ARV.
Projected returns pro-forma
-3.0% appreciation · 3.0% rent growth · sell at horizon
- IRR
- 2.1%
- Equity multiple
- 1.08×
- Total profit
- $2,547
- Equity at exit
- $16,998
- IRR
- 11.7%
- Equity multiple
- 1.92×
- Total profit
- $29,221
- Equity at exit
- $9,857
Cash invested: $31,920 (down + closing). Projections, not guarantees.
Landlord ↔ Tenant lean methodology
- Overall (STATE)
- 83 Strongly Landlord-Friendly
- State Oklahoma
- 83 Strongly Landlord-Friendly · R+20
- County
- — inherits STATE
- City
- — inherits STATE
ZIP-level market 73018
- Home prices YoY
- -21.1%
- Active inventory
- 203
- Price-to-rent
- 7.2×
Monthly cashflow live
- Estimated rent
- $1,327 high interval (Pro) →
- Mortgage (P&I)
- −$598
- Tax from tax record
- −$73 /mo · $873/yr
- Insurance
- −$48
- HOA
- −$0
- Vacancy / Maint / Mgmt
- −$279
- Net cashflow
- $330
Break-even live
UW: 25.0% down · 7.5% · 30yr · 1.5% tax · 5.0% vac · 8.0% maint · 8.0% mgmt
Financing live
Cash to close
- Down payment
- $28,500
- Closing costs
- $3,420
- Reserves months
- —
- Total cash needed
- —
Loan-product check · same deal, 3 products live
Conventional
25% down · 7.5% · 30yr
- Down + closing
- —
- Monthly P&I
- —
- Monthly cashflow
- —
- DSCR
- —
- Eligible?
- —
Personal DTI + credit; lowest rate.
DSCR
20% down · 8.5% · 30yr
- Down + closing
- —
- Monthly P&I
- —
- Monthly cashflow
- —
- DSCR
- —
- Eligible?
- —
No personal income docs; deal must DSCR.
Hard money
10% down · 12.0% · 12mo
- Down + closing
- —
- Monthly P&I
- —
- Monthly cashflow
- —
- DSCR
- —
- Eligible?
- —
Short-term bridge; refi at stabilization.
Rent comps 13 comps
| Address | Beds | Baths | Sqft | Rent | $/sqft | DOM | Units | Dist |
|---|---|---|---|---|---|---|---|---|
| 3507 W Mississippi Ave Chickasha, OK | 4.0 | 2.0 | 1240 | $1,474 | $1.19 | 1d | 1 | 0.54mi |
| 607 W Wisconsin Ave Chickasha, OK | 3.0 | 2.0 | 1270 | $1,395 | $1.10 | 10d | 1 | 0.56mi |
| 1024 S 13th St Chickasha, OK | 2.0 | 2.0 | 1265 | $925 | $0.73 | 10d | 1 | 0.58mi |
| 1008 S 14th St Chickasha, OK | 3.0 | 2.0 | 1485 | $1,395 | $0.94 | 1d | 1 | 0.61mi |
| 2220 W Utah Ave Unit 2220 Chickasha, OK | 2.0 | 1.0 | 910 | $1,055 | $1.16 | 1d | 1 | 0.69mi |
| 2226 W Utah Ave Chickasha, OK | 2.0 | 1.0 | 1000 | $1,055 | $1.05 | 14d | 1 | 0.70mi |
| 509 W Oregon Ave Chickasha, OK | 2.0 | 2.0 | 900 | $1,200 | $1.33 | 1d | 1 | 1.00mi |
| 1223 W Colorado Ave Chickasha, OK | 2.0 | 2.0 | 864 | $1,275 | $1.48 | 1d | 1 | 1.14mi |
| 1315 S Sheppard St Chickasha, OK | 2.0 | 2.0 | 864 | $1,250 | $1.45 | 3d | 1 | 1.15mi |
| 816 S 2nd St Chickasha, OK | 3.0 | 2.0 | 1047 | $1,100 | $1.05 | 1d | 1 | 1.15mi |
| 519 W Minnesota Ave Chickasha, OK | 2.0 | 2.0 | 1100 | $1,250 | $1.14 | 1d | 1 | 1.16mi |
| 2024 Taylor St Chickasha, OK | 3.0 | 2.0 | 1355 | $1,525 | $1.13 | 1d | 1 | 1.27mi |
| 2730 Valley View Cir Chickasha, OK | 2.0–3.0 | 2.0 | 1087 | $1,495 | $1.37 | 1d | 3 | 1.47mi |
Listing history 7 events
-
2026-06-18days on market $114,000 Active 10 DOM
-
2026-06-17days on market $114,000 Active 9 DOM
-
2026-06-16days on market $114,000 Active 8 DOM
-
2026-06-15days on market $114,000 Active 7 DOM
-
2026-06-13days on market $114,000 Active 5 DOM
-
2026-06-08remarks 699-char remark
-
2026-06-08$114,000 Active 1 DOM
ⓘ Source: listings_history table (triggers on properties + properties_extension) + one-shot
backfill from property_details.listing_events for pre-trigger history.
Tax reassessment forecast OK · Resets to sale price
- Current annual tax
- $873 · $73/mo
- Projected year-2 tax
- $1,026 · $86/mo
- Expected delta
- +$153/yr (+$13/mo · 17.5%)
ⓘ Screening estimate from a state-policy table — verify with the county assessor before closing.
Nearby sold comps map
Loading sold comps map…
Walkable amenities ~0.75 mi
Loading nearby amenities…
Taxation est. · year 1
- Rental income
- $15,926
- − Mortgage interest
- −$6,386
- − Property taxes
- −$873
- − Insurance
- −$570
- − Repairs & maintenance
- −$1,274
- − Management
- −$1,274
- − Depreciation
- −$3,316
- Taxable income
- $2,233
- Est. tax owed @ 24.0%
- −$536
- After-tax cash flow
- $3,429/yr
For passive investors: Depreciation is non-cash, so a rental often shows a tax loss while cash-flowing — sheltering income. Rental losses are passive: they offset passive income freely, and up to $25,000/yr can offset ordinary (W-2) income if you actively participate and your MAGI is under $100k (phasing out to $0 by $150k); unused losses carry forward. On sale, claimed depreciation is recaptured at up to 25%, and gains may owe capital-gains tax (a 1031 exchange can defer both). Figures are a year-1 estimate at your 24.0% rate — not tax advice; consult a CPA.
Schools (NCES district)
- District
- Chickasha
- NCES district ID
- 4007560
- Math proficiency
- 23% ▼ -11.00%
- Reading proficiency
- 27% ▼ -8.00%
- Median HH income
- $38,561
- Composite
- 20.95/100
- National rank
- #8476
- State rank
- #115 of 270 in OK
Livability — Chickasha
- Score
- 66/100
- State rank
- #117
- US rank
- #11902
Category grades
Schools grade is shown separately in the Schools card above.
Census & demographics
- Census place
- Chickasha, OK
- County
- Grady County · 20,505 people
- City population
- 20,505
- Metro
- Oklahoma City, OK
- Population (ZIP)
- 20,505
- Household income
- $56,484
- Rent vs Own
- Severe rent burden
- 685.0
Population outlook (Grady County) Hauer SSP2
- Today (2025)
- 59,962 people
- By 2030
- 62,513 · +4.3%
- By 2040
- 67,338 · +12.3%
- By 2050
- 71,719 · +19.6%
- By 2075
- 82,684 · +37.9%
- By 2100
- 89,387 · +49.1%
Race, ethnicity, and origin ACS 2023
- Neighborhood character
- Predominantly White (74%)
- Race & ethnicity
- White 74% Two or more races 11% Hispanic / Latino 9% Black 5% Native American 5%
- Hispanic origin (detail)
- Mexican 6%
- Common ancestry
- Slovak 2% Iranian 2% Italian 2%
- Foreign-born
- 2% · Canada
- Languages at home
- 96% English-only · Spanish 3%
Political lean MEDSL · Grady
- 2024 margin
- Solid R (+62.7) · D 17.9% · R 80.6% · Other 1.5%
- 2008→2024 swing
- -16.0pp toward R · 2008: -46.7pp · 2024: -62.7pp
- All cycles
- 2024: R+62.7 2020: R+62.3 2016: R+60.3 2012: R+51.2 2008: R+46.7
Not yet ingested
- Civics
- —
Market trends
- HPI YoY
- ▼ -66.82%
- Current HPI
- 249.6051
- Rent YoY
- —
- Metro
- Oklahoma City, OK
- State GDP YoY
- ▲ 1.55%
- F500 in state
- 6
Industry mix (Fortune 500 HQ in OK)
| Industry | F500 HQs | Revenue |
|---|---|---|
| Energy | 3 | $48B |
|
||
Price history
+215.2% since first listed12 events — show timeline
- 2026-06-08 Listed $114,000 MLSOK
- 2019-10-15 Sold (MLS) $60,000 MLSOK
- 2019-08-29 Pending — MLSOK
- 2019-06-26 Listed $75,000 MLSOK
- 2015-01-23 Sold (MLS) $28,500 MLSOK
- 2014-12-04 Listed $33,500 MLSOK
- 2005-09-20 Sold (Public Records) $55,000 Public Records
- 2005-09-20 Sold (MLS) $55,500 MLSOK
- 2005-05-11 Listed $54,500 MLSOK
- 2005-03-16 Sold (MLS) $24,500 MLSOK
- 2004-12-31 Listed $26,800 MLSOK
- 1997-12-19 Sold (Public Records) $36,166 Public Records
Property tax history
+2.8%/yrLatest (2025): $873 · +5.6% YoY. Source: county tax records.
Cash-flow waterfall
monthlySold comps — $/sqft
last 12 mo · ≤1 miLoading sold comps…