 Fourplex
4726 Kensington Pl · St. Louis, MO
Flood risk 6/10 · Moderate
- FEMA flood zone
- X (unshaded)
- Chance of flooding over 30 yrs
- 0.71%
- Est. flood insurance / yr
- $473 – $860
Fire risk 1/10 · Minimal
- Est. fire insurance / yr
- $1,054 – $1,958
Heat risk 5/10 · Moderate
- Hot days now (above 107°F)
- 7 days/yr
- Hot days in 30 yrs
- 21 days/yr
Wind risk 2/10 · Minimal
- Chance of severe wind over 30 yrs
- 1.0%
Air-quality risk 4/10 · Minor
- Unhealthy air days now
- 4 days/yr
- Unhealthy air days in 30 yrs
- 5 days/yr
Risk factors via First Street. Map © Google.
Why this score? — see what drove the D grade
The composite is a weighted blend of 9 inputs, each scored 0–100. Each bar is that input's sub-score; the figure is the points it added to the 100-point composite (weight × sub-score).
- Cash flow +15.0/30.0
- ARV discount +7.5/15.0
- 1% rule +5.0/10.0
- DSCR +5.0/10.0
- Rent growth +3.3/5.0
- Livability +2.5/5.0
- Condition / age +2.5/5.0
- Schools +1.2/10.0
- Appreciation +0.0/10.0
$60,000
🖨 Deal sheet 📄 Offer letter ✓ Due diligence
Multi-family units
County records classify this as Multi-Family (2-4 Unit). Listing-text estimate: 4 units. confirmed
Listing remarks MLS
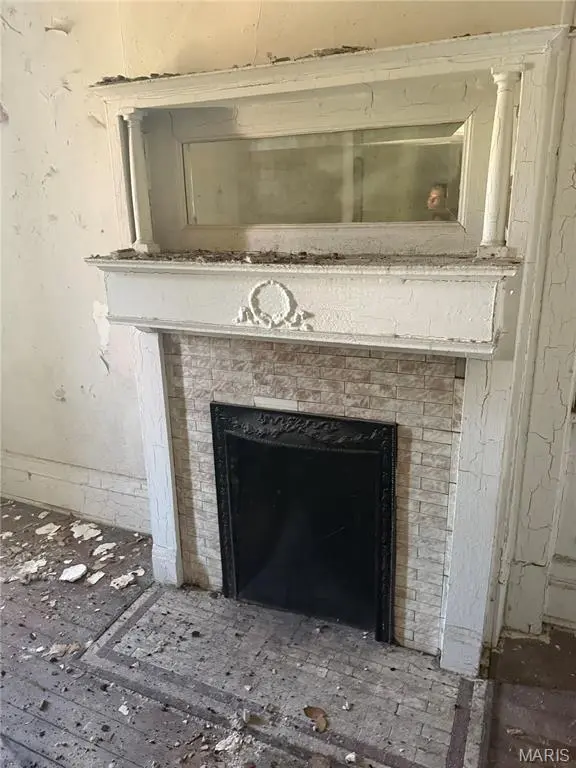
This 4-Family historic property on a quiet street offers an exciting investment opportunity in a rapidly developing area in the Central West End with ARV over $350K! All 2BR/1BA spacious units are over 1000 sq ft. Exterior tuck pointing has already been completed along with all new decking and back porches constructed with high-end timber.
Key facts
- Historic property
- New back decking
- 5,928 sq ft lot
Tags
Neighborhood map
What this means for you Summary
Snapshot
- This is a 4 × 2.0-bed/1.0-bath units multifamily listed at $60k.
Deal economics
- At list price, monthly cash flow is $5k ($56k/yr) — positive. Per door: $1k/mo.
- The deal already cash-flows at list — no discount required.
- Meets the 1% rule at list price ($6k rent vs $60k).
- Recommended offer: $53k (12.0% below list) — sets the bar for market timing.
- Cap rate 99.2% vs local median 5.0% in St. Louis — top-decile yield for the area; either an underpriced asset or a hidden risk that comps aren't pricing in. Stress-test before assuming the spread holds.
Location & tenants
- Location reads: area grade D — affects rentability + tenant quality, not the cash-flow math above.
- St. Louis City (urban): math 10% / reading 18% proficiency, ranked #312 of 324 in MO (top 96%) — low school quality limits family demand, transient renter base, plan for 1-2y turnover; 80% free/reduced lunch — lower-income household profile, screen leases tightly.
- Market conditions: Rents rising (+3.1%/yr); 152 active listings in the ZIP; 294 units permitted in St. Louis city in 2024 (227 in 5+ unit buildings).
- At $6,340/mo this rent would consume 138% of the median local household income ($55k/yr) (locally 2180% of renters already pay >50% of income on rent) — very limited rent-growth headroom before tenants either downsize or default.
Forward outlook
- Local home prices are declining (-3.0%/yr); year-one equity from $415 of loan paydown is wiped out by about $2k of value loss. Plan a longer hold.
- St. Louis County population projected to shrink 6% by 2050 — rents likely to lag national; underwrite the cash flow, not the appreciation.
- At projected returns (-3.0% appreciation + 3.1% rent growth), your $17k cash investment doubles in ~1 year — after that, you're playing with house money.
Negotiation context
- It's been on market 249 days — a 12% lower offer ($53k) is reasonable based on typical stale-listing flexibility.
- 6 sale attempts since 2y ago; this cycle's ask has dropped $65k (52%) from the opening price — seller is motivated, your offer sets the floor, not the list.
Risks & watch-outs
- Watch-outs: built in 1898 — expect roof / HVAC / electrical / plumbing capex.
- Climate carrying-cost: major flood risk; extreme-heat days projected 7→21/yr by 2055 (HVAC capex compounding) — expect insurance premiums to compound above CPI over the hold.
Questions for the listing agent
- It's been on market 249 days. Have you received any prior offers? Is the seller open to a 12% concession, seller financing, or rate buy-down credit?
- Can we see the unit-by-unit rent roll, current vacancy, and any below-market leases? What's the average tenancy length?
- What capital expenditures (roof, boiler, parking lot, exteriors) have been made in the last 5 years, and what's planned in the next 2?
- Built in 1898 — when were the roof, HVAC, electrical panel, plumbing, and water heater last replaced?
- Why hasn't it sold? Are there any deal-killer items the seller is aware of (foundation, flood, title, zoning, code violations)?
- Is there a deadline driving the sale (1031 exchange, divorce, estate, relocation)? That informs how much negotiation room exists.
- The area grade is low — what's the realistic commute time and amenity access for the typical tenant pool here? Any planned neighborhood developments (good or bad) we should know about?
- What's the average days-on-market for RENTAL listings here right now (not sales)? A rising rental-DOM trend means longer vacancies and softer asking-rent achievability than the comps imply.
- What's the recent tenant-quality profile in this submarket — average credit score on applications, eviction rate, late-payment / NSF rate, and stable-employment percentage? A property-management company in the area should have these aggregated.
- How much new apartment / multifamily construction is in the pipeline within 1–3 miles? Heavy new supply (>2% of stock underway) typically softens rents 12–24 months out; light construction supports rent growth.
Investment metrics
- 1% rule
- 10.57% ✓
- Cap rate
- 99.21%
- Cash-on-cash
- 331.86%
- DSCR
- 15.77
- GRM
- 0.8
CMA / ARV
- ARV (median comp)
- $149,922
- List price
- $60,000
- Delta
- -59.98%
- Verdict
- UNDERPRICED
- Comps
- 20 within 1.0 mi
Show comp detail 1 sale within ~0.75 mi
| Address | Dist | Beds/Ba | Sqft | Sold | Price | $/sf | Match |
|---|---|---|---|---|---|---|---|
| 5172 Kensington Ave | 0.73mi | 7/2.0 (-1) | 3,610 (-14%) | 17mo | $135,000 | $37 | 16 |
Match score weights: distance 35% · size 25% · config 20% · recency 20%. Top-matched comps best support the ARV.
Projected returns pro-forma
-3.0% appreciation · 3.1% rent growth · sell at horizon
- IRR
- —
- Equity multiple
- 18.08×
- Total profit
- $286,884
- Equity at exit
- $8,946
- IRR
- —
- Equity multiple
- 38.72×
- Total profit
- $633,722
- Equity at exit
- $5,188
Cash invested: $16,800 (down + closing). Projections, not guarantees.
Landlord ↔ Tenant lean methodology
- Overall (STATE)
- 81 Strongly Landlord-Friendly
- State Missouri
- 81 Strongly Landlord-Friendly · R+10
- County
- — inherits STATE
- City
- — inherits STATE
ZIP-level market 63108
- Home prices YoY
- -33.1%
- Rents YoY
- 3.1%
- Active inventory
- 152
- Price-to-rent
- 3.2×
Monthly cashflow live
- Estimated rent
- $6,340 high interval (Pro) →
- Mortgage (P&I)
- −$315
- Tax from tax record
- −$23 /mo · $276/yr
- Insurance
- −$25
- HOA
- −$0
- Vacancy / Maint / Mgmt
- −$1,331
- Net cashflow
- $4,646
Break-even live
4-unit breakdown (identical units grouped — click to expand)
| Units | Beds | Baths | Est. rent |
|---|---|---|---|
| 4× units | 2.0 | 1 | $6,340 |
| #1 | 2.0 | 1 | $1,585 |
| #2 | 2.0 | 1 | $1,585 |
| #3 | 2.0 | 1 | $1,585 |
| #4 | 2.0 | 1 | $1,585 |
| Total (4 units) | $6,340 | ||
UW: 25.0% down · 7.5% · 30yr · 1.5% tax · 5.0% vac · 8.0% maint · 8.0% mgmt
Financing live
Cash to close
- Down payment
- $15,000
- Closing costs
- $1,800
- Reserves months
- —
- Total cash needed
- —
Loan-product check · same deal, 3 products live
Conventional
25% down · 7.5% · 30yr
- Down + closing
- —
- Monthly P&I
- —
- Monthly cashflow
- —
- DSCR
- —
- Eligible?
- —
Personal DTI + credit; lowest rate.
DSCR
20% down · 8.5% · 30yr
- Down + closing
- —
- Monthly P&I
- —
- Monthly cashflow
- —
- DSCR
- —
- Eligible?
- —
No personal income docs; deal must DSCR.
Hard money
10% down · 12.0% · 12mo
- Down + closing
- —
- Monthly P&I
- —
- Monthly cashflow
- —
- DSCR
- —
- Eligible?
- —
Short-term bridge; refi at stabilization.
Listing history 24 events
-
2026-06-18days on market $60,000 Active 249 DOM
-
2026-06-17days on market $60,000 Active 248 DOM
-
2026-06-16days on market $60,000 Active 247 DOM
-
2026-06-15days on market $60,000 Active 246 DOM
-
2026-06-13days on market $60,000 Active 244 DOM
-
2026-06-09days on market $60,000 Active 240 DOM
-
2026-06-08days on market $60,000 Active 239 DOM
-
2026-06-08days on market $60,000 Active 238 DOM
-
2026-06-05days on market $60,000 Active 235 DOM
-
2026-06-03days on market $60,000 Active 234 DOM
-
2026-06-02days on market $60,000 Active 233 DOM
-
2026-06-01days on market $60,000 Active 232 DOM
-
2026-05-31days on market $60,000 Active 231 DOM
-
2026-05-01status Active 341-char remark
Show marketing remark (341 chars)
This 4-Family historic property on a quiet street offers an exciting investment opportunity in a rapidly developing area in the Central West End with ARV over $350K! All 2BR/1BA spacious units are over 1000 sq ft. Exterior tuck pointing has already been completed along with all new decking and back porches constructed with high-end timber.
-
2026-03-31status Active 341-char remark
Show marketing remark (341 chars)
This 4-Family historic property on a quiet street offers an exciting investment opportunity in a rapidly developing area in the Central West End with ARV over $350K! All 2BR/1BA spacious units are over 1000 sq ft. Exterior tuck pointing has already been completed along with all new decking and back porches constructed with high-end timber.
-
2026-02-10status Active 341-char remark
Show marketing remark (341 chars)
This 4-Family historic property on a quiet street offers an exciting investment opportunity in a rapidly developing area in the Central West End with ARV over $350K! All 2BR/1BA spacious units are over 1000 sq ft. Exterior tuck pointing has already been completed along with all new decking and back porches constructed with high-end timber.
-
2026-02-06status Active 341-char remark
Show marketing remark (341 chars)
This 4-Family historic property on a quiet street offers an exciting investment opportunity in a rapidly developing area in the Central West End with ARV over $350K! All 2BR/1BA spacious units are over 1000 sq ft. Exterior tuck pointing has already been completed along with all new decking and back porches constructed with high-end timber.
-
2026-01-19price $60,000 341-char remark
Show marketing remark (341 chars)
This 4-Family historic property on a quiet street offers an exciting investment opportunity in a rapidly developing area in the Central West End with ARV over $350K! All 2BR/1BA spacious units are over 1000 sq ft. Exterior tuck pointing has already been completed along with all new decking and back porches constructed with high-end timber.
-
2025-12-13price $70,000 341-char remark
Show marketing remark (341 chars)
This 4-Family historic property on a quiet street offers an exciting investment opportunity in a rapidly developing area in the Central West End with ARV over $350K! All 2BR/1BA spacious units are over 1000 sq ft. Exterior tuck pointing has already been completed along with all new decking and back porches constructed with high-end timber.
-
2025-11-18price $80,000 341-char remark
Show marketing remark (341 chars)
This 4-Family historic property on a quiet street offers an exciting investment opportunity in a rapidly developing area in the Central West End with ARV over $350K! All 2BR/1BA spacious units are over 1000 sq ft. Exterior tuck pointing has already been completed along with all new decking and back porches constructed with high-end timber.
-
2025-10-16price $95,000 341-char remark
Show marketing remark (341 chars)
This 4-Family historic property on a quiet street offers an exciting investment opportunity in a rapidly developing area in the Central West End with ARV over $350K! All 2BR/1BA spacious units are over 1000 sq ft. Exterior tuck pointing has already been completed along with all new decking and back porches constructed with high-end timber.
-
2025-09-22$125,000 Active 341-char remark
Show marketing remark (341 chars)
This 4-Family historic property on a quiet street offers an exciting investment opportunity in a rapidly developing area in the Central West End with ARV over $350K! All 2BR/1BA spacious units are over 1000 sq ft. Exterior tuck pointing has already been completed along with all new decking and back porches constructed with high-end timber.
-
2024-10-26historical
-
2024-10-10$65,000 Active
ⓘ Source: listings_history table (triggers on properties + properties_extension) + one-shot
backfill from property_details.listing_events for pre-trigger history.
Tax reassessment forecast MO · Resets to sale price
- Current annual tax
- $276 · $23/mo
- Projected year-2 tax
- $582 · $48/mo
- Expected delta
- +$306/yr (+$26/mo · 111.0%)
ⓘ Screening estimate from a state-policy table — verify with the county assessor before closing.
Climate risk First Street
- Flood 6/10 Major FEMA zone X (unshaded) · 71% chance over 30 yrs
- Wildfire 1/10 Low
- Heat 5/10 Major 7 d/yr ≥107°F today · 21 d/yr by 30 yrs out
- Wind 2/10 Low 100% chance of damaging wind over 30 yrs
- Air quality 4/10 Moderate 4 unhealthy d/yr today · 5 by 30 yrs out
Nearby sold comps map
Loading sold comps map…
Walkable amenities ~0.75 mi
Loading nearby amenities…
Taxation est. · year 1
- Rental income
- $76,080
- − Mortgage interest
- −$3,361
- − Property taxes
- −$276
- − Insurance
- −$300
- − Repairs & maintenance
- −$6,086
- − Management
- −$6,086
- − Depreciation
- −$1,745
- Taxable income
- $58,225
- Est. tax owed @ 24.0%
- −$13,974
- After-tax cash flow
- $41,778/yr
For passive investors: Depreciation is non-cash, so a rental often shows a tax loss while cash-flowing — sheltering income. Rental losses are passive: they offset passive income freely, and up to $25,000/yr can offset ordinary (W-2) income if you actively participate and your MAGI is under $100k (phasing out to $0 by $150k); unused losses carry forward. On sale, claimed depreciation is recaptured at up to 25%, and gains may owe capital-gains tax (a 1031 exchange can defer both). Figures are a year-1 estimate at your 24.0% rate — not tax advice; consult a CPA.
Schools (NCES district)
- District
- St. Louis City
- NCES district ID
- 2929280
- Math proficiency
- 10% ▼ -6.00%
- Reading proficiency
- 18% ▼ -3.00%
- Median HH income
- $35,685
- Composite
- 11.54/100
- National rank
- #9699
- State rank
- #312 of 324 in MO
Livability — St. Louis
No livability data for this city. (Only ~50 U.S. cities are tracked.)
Census & demographics
- Census place
- St. Louis, MO
- County
- Saint Louis City · 254,015 people
- City population
- 283,259
- Metro
- St. Louis, MO-IL
- Population (ZIP)
- 21,336
- Household income
- $55,147
- Rent vs Own
- Severe rent burden
- 2180.0
Population outlook (St. Louis County) Hauer SSP2
- Today (2025)
- 315,737 people
- By 2030
- 313,865 · -0.6%
- By 2040
- 305,439 · -3.3%
- By 2050
- 296,529 · -6.1%
- By 2075
- 271,028 · -14.2%
- By 2100
- 255,359 · -19.1%
Race, ethnicity, and origin ACS 2023
- Neighborhood character
- Diverse neighborhood (Simpson 0.62)
- Race & ethnicity
- White 54% Black 26% Asian 13% Hispanic / Latino 4% Two or more races 4%
- Common ancestry
- Lithuanian 4% Romanian 3% Iranian 2%
- Foreign-born
- 13% · China, Canada, South Korea
- Languages at home
- 85% English-only · Chinese 3% Other Asian/Pacific 3% Spanish 3%
Political lean MEDSL · St. Louis
- 2024 margin
- Solid D (+64.7) · D 81.4% · R 16.7% · Other 2.0%
- 2008→2024 swing
- -3.5pp toward R · 2008: 68.2pp · 2024: 64.7pp
- All cycles
- 2024: D+64.7 2020: D+66.2 2016: D+63.7 2012: D+66.6 2008: D+68.2
Not yet ingested
- Civics
- —
Market trends
- HPI YoY
- ▼ -111.22%
- Current HPI
- 225.1081
- Rent YoY
- ▲ 3.10%
- Metro
- St. Louis, MO-IL
- State GDP YoY
- ▲ 1.84%
- F500 in state
- 20
Industry mix (Fortune 500 HQ in MO)
| Industry | F500 HQs | Revenue |
|---|---|---|
| Healthcare | 1 | $163B |
|
||
| Insurance | 1 | $21B |
|
||
| Industrial Technology | 1 | $17B |
|
||
| Retail | 1 | $16B |
|
||
| Industrial Distribution | 1 | $10B |
|
||
| Utilities | 1 | $9B |
|
||
Price history
-7.7% since first listed11 events — show timeline
- 2026-05-01 Relisted — MARIS as Distributed by MLS Grid
- 2026-03-31 Relisted — MARIS as Distributed by MLS Grid
- 2026-02-10 Relisted — MARIS as Distributed by MLS Grid
- 2026-02-06 Relisted — MARIS as Distributed by MLS Grid
- 2026-01-19 Price Changed $60,000 MARIS as Distributed by MLS Grid
- 2025-12-13 Price Changed $70,000 MARIS as Distributed by MLS Grid
- 2025-11-18 Price Changed $80,000 MARIS as Distributed by MLS Grid
- 2025-10-16 Price Changed $95,000 MARIS as Distributed by MLS Grid
- 2025-09-22 Listed $125,000 MARIS as Distributed by MLS Grid
- 2024-10-26 Delisted — MARIS as Distributed by MLS Grid
- 2024-10-10 Listed $65,000 MARIS as Distributed by MLS Grid
Property tax history
+0.3%/yrLatest (2024): $276 · +4.6% YoY. Source: county tax records.
Cash-flow waterfall
monthlySold comps — $/sqft
last 12 mo · ≤1 miLoading sold comps…