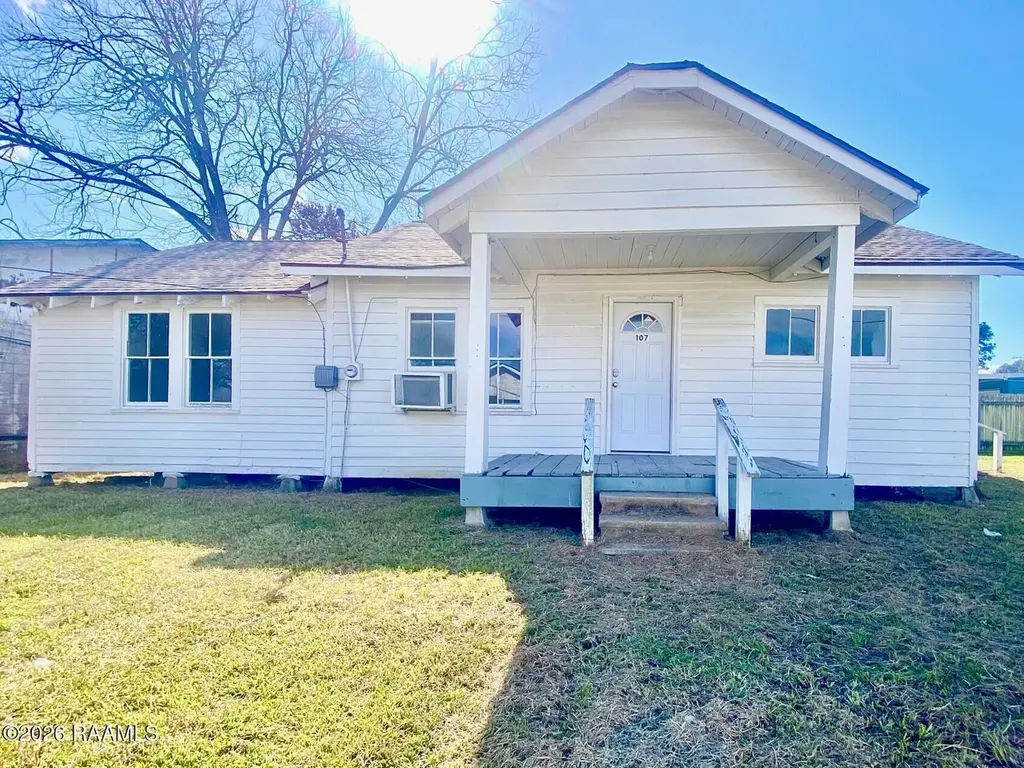
107 Murrel St · Abbeville, LA
Flood risk 6/10 · Moderate
- FEMA flood zone
- X (shaded)
- Chance of flooding over 30 yrs
- 0.73%
- Est. flood insurance / yr
- $507 – $1,088
Fire risk 3/10 · Minor
- Est. fire insurance / yr
- $1,269 – $2,357
Heat risk 10/10 · Severe
- Hot days now (above 108°F)
- 7 days/yr
- Hot days in 30 yrs
- 21 days/yr
Wind risk 9/10 · Severe
- Chance of severe wind over 30 yrs
- 99.0%
Air-quality risk 1/10 · Minimal
- Unhealthy air days now
- 0 days/yr
- Unhealthy air days in 30 yrs
- 0 days/yr
Risk factors via First Street. Map © Google.
Why this score? — see what drove the C grade
The composite is a weighted blend of 9 inputs, each scored 0–100. Each bar is that input's sub-score; the figure is the points it added to the 100-point composite (weight × sub-score).
- Cash flow +28.3/30.0
- DSCR +10.0/10.0
- 1% rule +6.6/10.0
- Schools +3.9/10.0
- Livability +3.4/5.0
- Rent growth +2.5/5.0
- Condition / age +2.5/5.0
- ARV discount +0.6/15.0
- Appreciation +0.0/10.0
$90,000
🖨 Deal sheet 📄 Offer letter ✓ Due diligence
Listing remarks
Great investment opportunity in Abbeville! This 3 bedroom, 1 bathroom home offers approximately 1,008 sq ft of living space and is currently tenant-occupied with rental income of $900 per month. Conveniently located near grocery stores, city parks, and local amenities, this property provides strong appeal for tenants seeking accessibility and convenience. The functional layout and established rental history make it an excellent option for investors looking to expand their portfolio with immediate cash flow. Whether you're a seasoned investor or just getting started, this income-producing property offers solid potential in a desirable location.
Key facts
- Tenant occupied
- Desirable location
- Income producing
Tags
Property features AI
Finance
- HOA & community: Nearby park; Playground
Exterior
- Parking: Open parking
- Utilities: Public sewer; City electric
- Home design: Single family residence; City street frontage on a paved road
- Construction: Wood siding frame construction; Composition roof
- Exterior features: Exterior lighting; Porch; Partial privacy fencing
Interior
- Kitchen: Gas stove
- Flooring: Vinyl plank flooring
- Bathrooms: 1 full bathroom
- Heating & cooling: Window air conditioning units; Other heating
- Interior features: Built-in features; Crown molding; Dual closets; Formica counters; Wood window frames
Neighborhood map
What this means for you Summary
Snapshot
- This is a 3-bed/1.0-bath single-family listed at $90k.
Deal economics
- At list price, monthly cash flow is $288 ($3k/yr) — positive.
- The deal already cash-flows at list — no discount required.
- Meets the 1% rule at list price ($1k rent vs $90k).
- Recommended offer: $87k (3.0% below list) — sets the bar for market timing.
- Cap rate 10.1% vs local median 6.6% in Abbeville — top-decile yield for the area; either an underpriced asset or a hidden risk that comps aren't pricing in. Stress-test before assuming the spread holds.
Location & tenants
- Location reads 68/100 on livability (#94 in LA) — a middle-class / working-renter tenant base. Strengths: cost of living A+, housing A+, health & safety A+; Watch: crime F, amenities F, commute F.
- Vermilion Parish (town): math 40% / reading 53% proficiency, ranked #15 of 98 in LA (top 15%) — families likely to look elsewhere, expect single-tenant / working-renter base with shorter leases.
- Zoned schools: Eaton Park Elementary School (439 students, 90% FRL); Abbeville High School (math 12% / reading 32%, grade F, #171 of 265 statewide, top 66%, 607 students, 81% FRL) — zoned schools average 86% FRL vs 53% district-wide (33 pts higher); higher-poverty schools than district average — tighter screening recommended.
- Zoned-school proficiency averages 22% at this address vs 46% district-wide (-24 pts) — the specific schools serving this property underperform the Vermilion Parish average; the district grade overstates school quality for this exact location.
- Market conditions: 180 active listings in the ZIP; 2 comparable units currently listed for rent nearby; 228 units permitted in Vermilion Parish in 2024 (0 in 5+ unit buildings).
Forward outlook
- Local home prices are declining (-3.0%/yr); year-one equity from $622 of loan paydown is wiped out by about $3k of value loss. Plan a longer hold.
- Vermilion County population projected at +10% by 2050 — modest demand growth; plan on rents tracking national, not racing it.
- At projected returns (-3.0% appreciation + 3.0% rent growth), your $25k cash investment doubles in ~9 years — after that, you're playing with house money.
Negotiation context
- It's been on market 48 days — a 3% lower offer ($87k) is reasonable based on typical stale-listing flexibility.
- 11 sale attempts since 4y ago with the ask held roughly flat each time — persistent listings suggest the price (not the market) is what's stuck; bring a comps-based counter.
- Current owner paid $52k; list at $90k implies a 73% gain — meaningful room to come down on a strong offer.
Risks & watch-outs
- Climate carrying-cost: major flood risk; severe wind risk, 99% chance of damaging wind over 30y; extreme-heat days projected 7→21/yr by 2055 (HVAC capex compounding) — expect insurance premiums to compound above CPI over the hold.
Questions for the listing agent
- It's been on market 48 days. Have you received any prior offers? Is the seller open to a 3% concession, seller financing, or rate buy-down credit?
- Is there a deadline driving the sale (1031 exchange, divorce, estate, relocation)? That informs how much negotiation room exists.
- Schools are B-rated — typically a magnet for longer-tenancy family renters. What's the average tenant stay here, and is there a school-zone premium baked into asking?
- Crime grade is F in this area — have there been break-ins, vandalism, or insurance claims at this property in the last 3 years? What carrier currently insures it and at what premium?
- What's the average days-on-market for RENTAL listings here right now (not sales)? A rising rental-DOM trend means longer vacancies and softer asking-rent achievability than the comps imply.
- What's the recent tenant-quality profile in this submarket — average credit score on applications, eviction rate, late-payment / NSF rate, and stable-employment percentage? A property-management company in the area should have these aggregated.
- How much new for-sale + rental construction is in the pipeline within 1–3 miles? Heavy new supply typically softens prices + rents 12–24 months out; constrained supply supports both.
Investment metrics
- 1% rule
- 1.16% ✓
- Cap rate
- 10.13%
- Cash-on-cash
- 13.72%
- DSCR
- 1.61
- GRM
- 7.2
CMA / ARV
- ARV (median comp)
- $78,014
- List price
- $90,000
- Delta
- 15.36%
- Verdict
- OVERPRICED
- Comps
- 20 within 1.0 mi
Show comp detail 7 sales within ~0.75 mi
| Address | Dist | Beds/Ba | Sqft | Sold | Price | $/sf | Match |
|---|---|---|---|---|---|---|---|
| 1203 S State St | 0.06mi | 3/2.0 | 1,055 (+5%) | 18mo | $107,000 | $101 | 70 |
| 710 Parkview Dr | 0.44mi | 3/1.5 | 1,000 (-1%) | 10mo | $35,000 | $35 | 68 |
| 700 S State Street St | 0.22mi | 3/1.0 | 1,115 (+11%) | 12mo | $76,000 | $68 | 62 |
| 801 S Jefferson St | 0.15mi | 2/1.0 (-1) | 857 (-15%) | 17mo | $60,000 | $70 | 49 |
| 408 S Bailey St | 0.62mi | 3/1.0 | 1,100 (+9%) | 10mo | $42,000 | $38 | 48 |
| 404 S St Valerie St | 0.52mi | 2/1.0 (-1) | 885 (-12%) | 7mo | $22,000 | $25 | 45 |
| 303 S Louisiana St | 0.56mi | 3/1.0 | 1,100 (+9%) | 19mo | $27,000 | $25 | 43 |
Match score weights: distance 35% · size 25% · config 20% · recency 20%. Top-matched comps best support the ARV.
Projected returns pro-forma
-3.0% appreciation · 3.0% rent growth · sell at horizon
- IRR
- 3.8%
- Equity multiple
- 1.15×
- Total profit
- $3,729
- Equity at exit
- $13,419
- IRR
- 13.3%
- Equity multiple
- 2.06×
- Total profit
- $26,723
- Equity at exit
- $7,782
Cash invested: $25,200 (down + closing). Projections, not guarantees.
Landlord ↔ Tenant lean methodology
- Overall (STATE)
- 90 Strongly Landlord-Friendly
- State Louisiana
- 90 Strongly Landlord-Friendly · R+12
- County
- — inherits STATE
- City
- — inherits STATE
ZIP-level market 70510
- Active inventory
- 180
- Price-to-rent
- 7.2×
Monthly cashflow live
- Estimated rent
- $1,041 medium interval (Pro) →
- Mortgage (P&I)
- −$472
- Tax from tax record
- −$25 /mo · $299/yr
- Insurance
- −$38
- HOA
- −$0
- Vacancy / Maint / Mgmt
- −$219
- Net cashflow
- $288
Break-even live
UW: 25.0% down · 7.5% · 30yr · 1.5% tax · 5.0% vac · 8.0% maint · 8.0% mgmt
Financing live
Cash to close
- Down payment
- $22,500
- Closing costs
- $2,700
- Reserves months
- —
- Total cash needed
- —
Loan-product check · same deal, 3 products live
Conventional
25% down · 7.5% · 30yr
- Down + closing
- —
- Monthly P&I
- —
- Monthly cashflow
- —
- DSCR
- —
- Eligible?
- —
Personal DTI + credit; lowest rate.
DSCR
20% down · 8.5% · 30yr
- Down + closing
- —
- Monthly P&I
- —
- Monthly cashflow
- —
- DSCR
- —
- Eligible?
- —
No personal income docs; deal must DSCR.
Hard money
10% down · 12.0% · 12mo
- Down + closing
- —
- Monthly P&I
- —
- Monthly cashflow
- —
- DSCR
- —
- Eligible?
- —
Short-term bridge; refi at stabilization.
Rent comps 2 comps
| Address | Beds | Baths | Sqft | Rent | $/sqft | DOM | Units | Dist |
|---|---|---|---|---|---|---|---|---|
| 301 E Lafayette St Unit 2 Abbeville, LA | 2.0 | 1.0 | 800 | $1,199 | $1.50 | 13d | 1 | 0.63mi |
| 407 Nugier St Abbeville, LA | 4.0 | 2.0 | 1374 | $695 | $0.51 | 43d | 1 | 1.28mi |
Listing history 35 events
-
2026-06-18days on market $90,000 Active 48 DOM
-
2026-06-17days on market $90,000 Active 47 DOM
-
2026-06-16days on market $90,000 Active 46 DOM
-
2026-06-15days on market $90,000 Active 45 DOM
-
2026-06-14days on market $90,000 Active 43 DOM
-
2026-06-13days on market $90,000 Active 42 DOM
-
2026-06-10days on market $90,000 Active 40 DOM
-
2026-06-09days on market $90,000 Active 39 DOM
-
2026-06-08days on market $90,000 Active 38 DOM
-
2026-06-07days on market $90,000 Active 37 DOM
-
2026-06-03days on market $90,000 Active 33 DOM
-
2026-06-02days on market $90,000 Active 32 DOM
-
2026-06-01days on market $90,000 Active 31 DOM
-
2026-05-31days on market $90,000 Active 30 DOM
-
2026-05-30days on market $90,000 Active 29 DOM
-
2026-05-01$90,000 Active 649-char remark
-
2025-08-22historical $900
-
2025-07-31$900
-
2025-07-26historical $900
-
2025-06-25$900
-
2025-06-21historical $900
-
2025-05-20$900
-
2025-03-09historical $900
-
2025-02-06$900
-
2025-02-06$100,000 Active
-
2024-10-08historical
-
2024-03-21$65,000 Active
-
2024-03-18$180,000 Active
-
2024-02-02historical $900
-
2024-01-15$900
-
2023-12-25historical $900
-
2023-12-03$900
-
2022-11-18soldstatus $52,000 Sold
-
2022-10-24status Pending
-
2022-10-11$59,000 Active
ⓘ Source: listings_history table (triggers on properties + properties_extension) + one-shot
backfill from property_details.listing_events for pre-trigger history.
Tax reassessment forecast LA · Resets to sale price
- Current annual tax
- $299 · $25/mo
- Projected year-2 tax
- $495 · $41/mo
- Expected delta
- +$196/yr (+$16/mo · 65.4%)
ⓘ Screening estimate from a state-policy table — verify with the county assessor before closing.
Climate risk First Street
- Flood 6/10 Major FEMA zone X (shaded) · 73% chance over 30 yrs
- Wildfire 3/10 Moderate
- Heat 10/10 Extreme 7 d/yr ≥108°F today · 21 d/yr by 30 yrs out
- Wind 9/10 Extreme 99% chance of damaging wind over 30 yrs
- Air quality 1/10 Low 0 unhealthy d/yr today · 0 by 30 yrs out
Nearby sold comps map
Loading sold comps map…
Walkable amenities ~0.75 mi
Loading nearby amenities…
Taxation est. · year 1
- Rental income
- $12,494
- − Mortgage interest
- −$5,041
- − Property taxes
- −$299
- − Insurance
- −$450
- − Repairs & maintenance
- −$1,000
- − Management
- −$1,000
- − Depreciation
- −$2,618
- Taxable income
- $2,086
- Est. tax owed @ 24.0%
- −$501
- After-tax cash flow
- $2,957/yr
For passive investors: Depreciation is non-cash, so a rental often shows a tax loss while cash-flowing — sheltering income. Rental losses are passive: they offset passive income freely, and up to $25,000/yr can offset ordinary (W-2) income if you actively participate and your MAGI is under $100k (phasing out to $0 by $150k); unused losses carry forward. On sale, claimed depreciation is recaptured at up to 25%, and gains may owe capital-gains tax (a 1031 exchange can defer both). Figures are a year-1 estimate at your 24.0% rate — not tax advice; consult a CPA.
Schools (NCES district)
- District
- Vermilion Parish
- NCES district ID
- 2201800
- Math proficiency
- 40% ▼ -38.00%
- Reading proficiency
- 53% ▼ -32.00%
- Median HH income
- $45,115
- Composite
- 39.37/100
- National rank
- #3974
- State rank
- #15 of 98 in LA
Livability — Abbeville
- Score
- 68/100
- State rank
- #94
- US rank
- #9800
Category grades
Schools grade is shown separately in the Schools card above.
Census & demographics
- Census place
- Abbeville, LA
- Population (ZIP)
- 23,909
Population outlook (Vermilion County) Hauer SSP2
- Today (2025)
- 64,095 people
- By 2030
- 65,915 · +2.8%
- By 2040
- 68,985 · +7.6%
- By 2050
- 70,804 · +10.5%
- By 2075
- 73,897 · +15.3%
- By 2100
- 71,793 · +12.0%
Race, ethnicity, and origin ACS 2023
- Neighborhood character
- Majority White (65%)
- Race & ethnicity
- White 65% Black 24% Two or more races 4% Hispanic / Latino 4% Asian 4%
- Common ancestry
- Lithuanian 15% Italian 1%
- Foreign-born
- 5% · Vietnam, Canada
- Languages at home
- 87% English-only · French/Haitian/Cajun 6% Vietnamese 3% Spanish 2%
Political lean MEDSL · Vermilion
- 2024 margin
- Solid R (+63.8) · D 17.6% · R 81.4% · Other 1.1%
- 2008→2024 swing
- -16.3pp toward R · 2008: -47.5pp · 2024: -63.8pp
- All cycles
- 2024: R+63.8 2020: R+61.9 2016: R+59.6 2012: R+52.8 2008: R+47.5
Not yet ingested
- Civics
- —
Market trends
- HPI YoY
- ▼ -70.44%
- Current HPI
- 97.6131
- Rent YoY
- —
- Metro
- —
- State GDP YoY
- ▲ 3.29%
- F500 in state
- 10
Industry mix (Fortune 500 HQ in LA)
| Industry | F500 HQs | Revenue |
|---|---|---|
| Telecommunications | 2 | $23B |
|
||
| Utilities | 1 | $12B |
|
||
| Wholesale / Distribution | 1 | $5B |
|
||
| Advertising | 1 | $2B |
|
||
Price history
+52.5% since first listed20 events — show timeline
- 2026-05-01 Listed $90,000 AcadianaMLS
- 2025-08-22 Rental Removed $900 Avail
- 2025-07-31 Listed for Rent $900 Avail
- 2025-07-26 Rental Removed $900 Avail
- 2025-06-25 Listed for Rent $900 Avail
- 2025-06-21 Rental Removed $900 Avail
- 2025-05-20 Listed for Rent $900 Avail
- 2025-03-09 Rental Removed $900 Avail
- 2025-02-06 Listed for Rent $900 Avail
- 2025-02-06 Listed $100,000 AcadianaMLS
- 2024-10-08 Delisted — AcadianaMLS
- 2024-03-21 Listed $65,000 AcadianaMLS
- 2024-03-18 Listed $180,000 AcadianaMLS
- 2024-02-02 Rental Removed $900 Avail
- 2024-01-15 Listed for Rent $900 Avail
- 2023-12-25 Rental Removed $900 Avail
- 2023-12-03 Listed for Rent $900 Avail
- 2022-11-18 Sold (MLS) $52,000 AcadianaMLS
- 2022-10-24 Pending — AcadianaMLS
- 2022-10-11 Listed $59,000 AcadianaMLS
Property tax history
+2.1%/yrLatest (2025): $299 · -0.3% YoY. Source: county tax records.
Cash-flow waterfall
monthlySold comps — $/sqft
last 12 mo · ≤1 miLoading sold comps…