 🏷️ Likely Rental
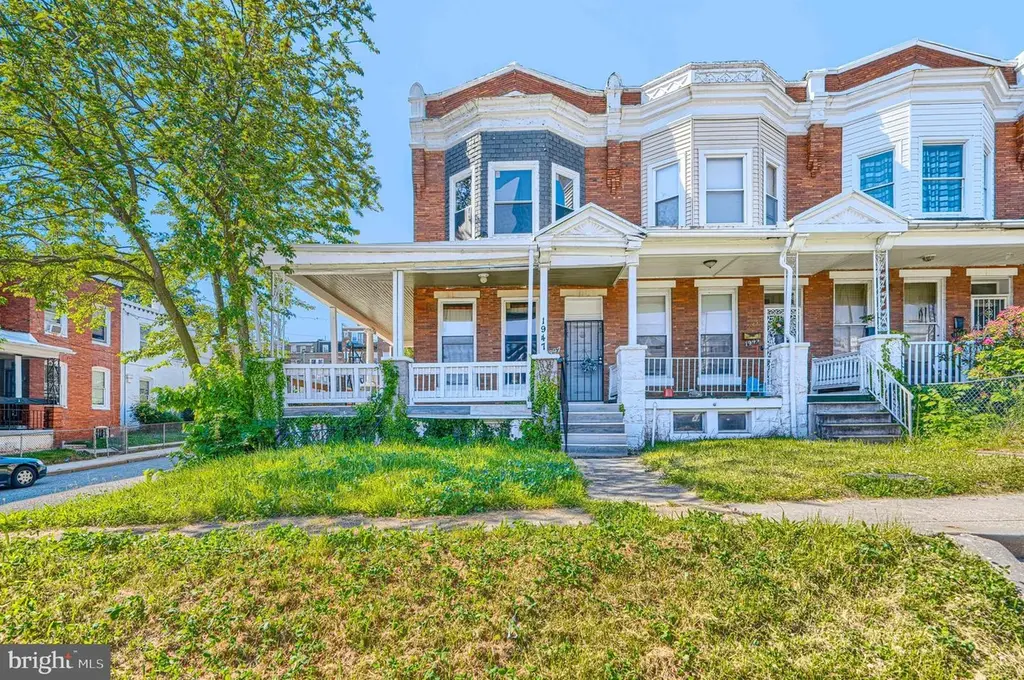
1947 E 31st St · Baltimore, MD
Flood risk 1/10 · Minimal
- FEMA flood zone
- X (unshaded)
- Chance of flooding over 30 yrs
- 0.0%
- Est. flood insurance / yr
- $473 – $860
Fire risk 1/10 · Minimal
- Est. fire insurance / yr
- $755 – $1,403
Heat risk 7/10 · Major
- Hot days now (above 103°F)
- 7 days/yr
- Hot days in 30 yrs
- 15 days/yr
Wind risk 6/10 · Moderate
- Chance of severe wind over 30 yrs
- 27.0%
Air-quality risk 4/10 · Minor
- Unhealthy air days now
- 6 days/yr
- Unhealthy air days in 30 yrs
- 7 days/yr
Risk factors via First Street. Map © Google.
Why this score? — see what drove the B- grade
The composite is a weighted blend of 9 inputs, each scored 0–100. Each bar is that input's sub-score; the figure is the points it added to the 100-point composite (weight × sub-score).
- Cash flow +30.0/30.0
- 1% rule +10.0/10.0
- DSCR +10.0/10.0
- ARV discount +7.5/15.0
- Livability +3.8/5.0
- Rent growth +2.9/5.0
- Condition / age +2.5/5.0
- Schools +1.0/10.0
- Appreciation +0.0/10.0
$112,000
🖨 Deal sheet 📄 Offer letter ✓ Due diligence
Listing remarks
AGENTS - PLEASE VIEW AGENT REMARKS IN BRIGHT MLS. Rare opportunity to acquire a diversified 5-property Baltimore portfolio featuring a mix of stabilized rental income and value-add potential. Assets span multiple Baltimore submarkets with proximity to hospitals, universities, transit, downtown employment centers and redevelopment corridors. Ideal for investors seeking immediate cash flow with long-term appreciation upside. Portfolio includes tenant-occupied units generating income and properties positioned for future rent growth. Package sale preferred. Package includes: 110 S Catherine Street; Baltimore, MD 21223 / 1947 E 31st Street; Baltimore, MD 21218 / 4806 Reisterstown Road; Baltimore
Key facts
- Community pool
- Built 1922
- Listed 26 days
Property features AI
Exterior
- Parking: On-street parking
- Utilities: Public water; No septic system; Natural gas heating and hot water
- Home design: Interior townhouse/rowhouse; Fee simple ownership
- Construction: Brick construction; Brick/mortar foundation; Above-grade and below-grade structures; Built year per assessor
- Exterior features: Community pool; Property located within city limits
Interior
- Bedrooms: Four bedrooms on the first upper level
- Bathrooms: One full bathroom; One half bathroom
- Heating & cooling: Radiator heating; Natural gas hot water
- Interior features: Unfinished basement; Living area per assessor
Neighborhood map
What this means for you Summary
Snapshot
- This is a 4-bed/3.0-bath townhouse listed at $112k.
Deal economics
- At list price, monthly cash flow is $934 ($11k/yr) — positive.
- The deal already cash-flows at list — no discount required.
- Meets the 1% rule at list price ($2k rent vs $112k).
- Recommended offer: $110k (1.5% below list) — sets the bar for market timing.
- Cap rate 16.3% vs local median 6.0% in Baltimore — top-decile yield for the area; either an underpriced asset or a hidden risk that comps aren't pricing in. Stress-test before assuming the spread holds.
Location & tenants
- Location reads 76/100 on livability (#90 in MD, #3,396 nationally) — a middle-class / working-renter tenant base. Strengths: amenities A+, commute A+, housing A+; Watch: schools D, crime F.
- Baltimore City Public Schools (urban): math 7% / reading 16% proficiency, ranked #24 of 24 in MD (top 100%) — low school quality limits family demand, transient renter base, plan for 1-2y turnover; 79% free/reduced lunch — lower-income household profile, screen leases tightly.
- Market conditions: Rents rising (+1.6%/yr); 325 active listings in the ZIP; 34 comparable units currently listed for rent nearby; rentals at typical pace (median 24d on market — plan ~3-4 weeks tenant-placement turnaround); 1,273 units permitted in Baltimore city in 2024 (1,104 in 5+ unit buildings).
- This rent runs 42% of the median local income ($62k/yr) — at the standard rent-burdened threshold; future hikes will face affordability resistance.
Forward outlook
- Local home prices are declining (-3.0%/yr); year-one equity from $774 of loan paydown is wiped out by about $3k of value loss. Plan a longer hold.
- Baltimore County population projected to shrink 4% by 2050 — rents likely to lag national; underwrite the cash flow, not the appreciation.
- At projected returns (-3.0% appreciation + 1.6% rent growth), your $31k cash investment doubles in ~4 years — after that, you're playing with house money.
Negotiation context
- It's been on market 26 days — a 2% lower offer ($110k) is reasonable based on typical stale-listing flexibility.
- 6 sale attempts since 18y ago with the ask held roughly flat each time — persistent listings suggest the price (not the market) is what's stuck; bring a comps-based counter.
- Current owner paid $43k; list at $112k implies a 160% gain — meaningful room to come down on a strong offer.
Risks & watch-outs
- Watch-outs: built in 1922 — expect roof / HVAC / electrical / plumbing capex.
- Climate carrying-cost: major wind risk, 27% chance of damaging wind over 30y; extreme-heat days projected 7→15/yr by 2055 (HVAC capex compounding) — expect insurance premiums to compound above CPI over the hold.
Questions for the listing agent
- Built in 1922 — when were the roof, HVAC, electrical panel, plumbing, and water heater last replaced?
- Is there a deadline driving the sale (1031 exchange, divorce, estate, relocation)? That informs how much negotiation room exists.
- Schools are D-rated, which usually means shorter tenancies and higher turnover. Who's the typical renter profile here, and what's been the actual vacancy rate?
- Crime grade is F in this area — have there been break-ins, vandalism, or insurance claims at this property in the last 3 years? What carrier currently insures it and at what premium?
- What's the average days-on-market for RENTAL listings here right now (not sales)? A rising rental-DOM trend means longer vacancies and softer asking-rent achievability than the comps imply.
- What's the recent tenant-quality profile in this submarket — average credit score on applications, eviction rate, late-payment / NSF rate, and stable-employment percentage? A property-management company in the area should have these aggregated.
- How much new for-sale + rental construction is in the pipeline within 1–3 miles? Heavy new supply typically softens prices + rents 12–24 months out; constrained supply supports both.
Investment metrics
- 1% rule
- 1.93% ✓
- Cap rate
- 16.30%
- Cash-on-cash
- 35.74%
- DSCR
- 2.59
- GRM
- 4.3
CMA / ARV
- ARV (on-the-fly)
- $271,680
- Comps found
- 12
Show comp detail 12 sales within ~0.75 mi
| Address | Dist | Beds/Ba | Sqft | Sold | Price | $/sf | Match |
|---|---|---|---|---|---|---|---|
| 1609 E 30th St | 0.28mi | 5/3.5 (+1) | 2,250 (-1%) | 3mo | $269,000 | $120 | 77 |
| 3012 Harford Rd | 0.09mi | 5/2.0 (+1) | 2,144 (-5%) | 12mo | $206,000 | $96 | 68 |
| 1764 Homestead St | 0.53mi | 4/3.5 | 2,200 (-3%) | 7mo | $257,500 | $117 | 62 |
| 2219 Chesterfield Ave | 0.58mi | 4/4.0 | 2,170 (-4%) | 1mo | $320,000 | $147 | 61 |
| 2785 The Alameda | 0.33mi | 5/3.5 (+1) | 2,009 (-11%) | 2mo | $299,999 | $149 | 57 |
| 1306 E 33rd St | 0.53mi | 4/2.5 | 2,050 (-10%) | 2mo | $170,000 | $83 | 56 |
| 2701 The Alameda | 0.34mi | 3/3.5 (-1) | 2,050 (-10%) | 9mo | $200,000 | $98 | 54 |
| 3707 The Alameda | 0.64mi | 3/2.5 (-1) | 2,205 (-3%) | 7mo | $275,000 | $125 | 53 |
| 2709 The Alameda | 0.34mi | 3/2.0 (-1) | 2,100 (-7%) | 13mo | $242,000 | $115 | 52 |
| 2542 Harford Rd | 0.57mi | 5/3.0 (+1) | 2,100 (-7%) | 6mo | $220,000 | $105 | 52 |
| 1542 Kennewick Rd | 0.65mi | 4/2.0 | 2,040 (-10%) | 3mo | $310,000 | $152 | 47 |
| 1509 E 36th St | 0.53mi | 3/2.0 (-1) | 2,040 (-10%) | 9mo | $259,900 | $127 | 42 |
Match score weights: distance 35% · size 25% · config 20% · recency 20%. Top-matched comps best support the ARV.
Projected returns pro-forma
-3.0% appreciation · 1.63% rent growth · sell at horizon
- IRR
- 29.9%
- Equity multiple
- 2.23×
- Total profit
- $38,430
- Equity at exit
- $16,700
- IRR
- 36.4%
- Equity multiple
- 4.14×
- Total profit
- $98,459
- Equity at exit
- $9,684
Cash invested: $31,360 (down + closing). Projections, not guarantees.
Landlord ↔ Tenant lean methodology
- Overall (CITY)
- 12 Strongly Tenant-Friendly
- State Maryland
- 27 Tenant-Leaning · D+14
- County
- — inherits STATE
- City Baltimore
- 12 Strongly Tenant-Friendly · D+58
ZIP-level market 21218
- Rents YoY
- 1.6%
- Active inventory
- 325
- Price-to-rent
- 4.3×
Monthly cashflow live
- Estimated rent
- $2,162 high interval (Pro) →
- Mortgage (P&I)
- −$587
- Tax est. 1.5%
- −$140 /mo · $1,680/yr
- Insurance
- −$47
- HOA
- −$0
- Vacancy / Maint / Mgmt
- −$454
- Net cashflow
- $934
Break-even live
UW: 25.0% down · 7.5% · 30yr · 1.5% tax · 5.0% vac · 8.0% maint · 8.0% mgmt
Financing live
Cash to close
- Down payment
- $28,000
- Closing costs
- $3,360
- Reserves months
- —
- Total cash needed
- —
Loan-product check · same deal, 3 products live
Conventional
25% down · 7.5% · 30yr
- Down + closing
- —
- Monthly P&I
- —
- Monthly cashflow
- —
- DSCR
- —
- Eligible?
- —
Personal DTI + credit; lowest rate.
DSCR
20% down · 8.5% · 30yr
- Down + closing
- —
- Monthly P&I
- —
- Monthly cashflow
- —
- DSCR
- —
- Eligible?
- —
No personal income docs; deal must DSCR.
Hard money
10% down · 12.0% · 12mo
- Down + closing
- —
- Monthly P&I
- —
- Monthly cashflow
- —
- DSCR
- —
- Eligible?
- —
Short-term bridge; refi at stabilization.
Rent comps 34 comps
| Address | Beds | Baths | Sqft | Rent | $/sqft | DOM | Units | Dist |
|---|---|---|---|---|---|---|---|---|
| 1923 E 31st St Baltimore, MD | 3.0 | 1.5 | 2264 | $1,600 | $0.71 | 24d | 1 | 0.03mi |
| 2045 E 31st St Baltimore, MD | 5.0 | 3.0 | 2200 | $895 | $0.41 | 24d | 1 | 0.10mi |
| 1539 Abbotston St Baltimore, MD | 3.0 | 2.0 | 1800 | $1,995 | $1.11 | 44d | 1 | 0.44mi |
| 1539 Abbotston St Baltimore, MD | 3.0 | 2.0 | 1900 | $1,899 | $1.00 | 4d | 1 | 0.44mi |
| 3005 Belair Rd Baltimore, MD | 3.0 | 2.0 | 2000 | $1,600 | $0.80 | 18d | 1 | 0.80mi |
| 4006 Loch Raven Blvd Baltimore, MD | 3.0 | 2.5 | 2016 | $2,695 | $1.34 | 18d | 1 | 0.92mi |
| 1539 Ralworth Rd Baltimore, MD | 3.0 | 2.0 | 1580 | $1,950 | $1.23 | 15d | 1 | 0.93mi |
| 1829 N Port St Baltimore, MD | 3.0 | 1.5 | 2000 | $1,625 | $0.81 | 44d | 1 | 1.00mi |
| 3027 Shannon Dr Baltimore, MD | 3.0 | 2.0 | 1950 | $2,500 | $1.28 | 44d | 1 | 1.10mi |
| 3031 Shannon Dr Baltimore, MD | 5.0 | 2.5 | 2155 | $2,600 | $1.21 | 24d | 1 | 1.10mi |
| 3551 Elmley Ave Baltimore, MD | 3.0 | 1.5 | 1872 | $2,095 | $1.12 | 24d | 1 | 1.12mi |
| 1333 E North Ave Baltimore, MD | 4.0 | 2.5 | 1860 | $2,200 | $1.18 | 24d | 1 | 1.17mi |
| 4110 Harris Ave Unit 1 Baltimore, MD | 3.0 | 2.0 | 2450 | $1,650 | $0.67 | 24d | 1 | 1.19mi |
| 1511 E Lafayette Ave Baltimore, MD | 4.0 | 3.5 | 1988 | $2,650 | $1.33 | 4d | 1 | 1.19mi |
| 424 Ilchester Ave Baltimore, MD | 3.0 | 3.0 | 1976 | $1,800 | $0.91 | 15d | 1 | 1.22mi |
| 420 E 28th St Unit 1 Baltimore, MD | 5.0 | 2.5 | 1600 | $2,600 | $1.62 | 4d | 1 | 1.23mi |
| 3300 Dudley Ave Baltimore, MD | 4.0 | 2.0 | 1724 | $2,200 | $1.28 | 44d | 1 | 1.26mi |
| 348 E University Pkwy Baltimore, MD | 4.0 | 2.0 | 1809 | $2,400 | $1.33 | 44d | 1 | 1.27mi |
| 1532 N Broadway Baltimore, MD | 3.0 | 4.0 | 2696 | $2,700 | $1.00 | 3d | 1 | 1.29mi |
| 4244 Shamrock Ave Baltimore, MD | 3.0 | 1.5 | 1920 | $1,850 | $0.96 | 24d | 1 | 1.29mi |
| 3421 University Pl Baltimore, MD | 5.0 | 2.0 | 1960 | $3,500 | $1.79 | 24d | 1 | 1.30mi |
| 534 E 23rd St Baltimore, MD | 3.0 | 2.5 | 1700 | $2,350 | $1.38 | 44d | 1 | 1.31mi |
| 3214 Abell Ave Baltimore, MD | 3.0 | 1.5 | 2300 | $2,800 | $1.22 | 24d | 1 | 1.31mi |
| 2621 E Oliver St Baltimore, MD | 3.0 | 2.0 | 1600 | $1,700 | $1.06 | 24d | 1 | 1.31mi |
| 3010 Guilford Ave Baltimore, MD | 5.0 | 2.5 | 2174 | $3,980 | $1.83 | 11d | 1 | 1.37mi |
| 719 E 20th St Baltimore, MD | 5.0 | 3.0 | 2060 | $2,400 | $1.17 | 2d | 1 | 1.41mi |
| 719 E 20th St Baltimore, MD | 5.0 | 3.5 | 2060 | $3,000 | $1.46 | 24d | 1 | 1.41mi |
| 312 E 25th St Baltimore, MD | 4.0 | 3.5 | 1960 | $2,800 | $1.43 | 44d | 1 | 1.42mi |
| 313 E 25th St Baltimore, MD | 5.0 | 2.5 | 2350 | $2,550 | $1.09 | 24d | 1 | 1.42mi |
| 513 E 41st St Baltimore, MD | 4.0 | 1.5 | 1620 | $1,900 | $1.17 | 44d | 1 | 1.43mi |
| 1403 N Linwood Ave Baltimore, MD | 3.0 | 2.0 | 1660 | $1,995 | $1.20 | 44d | 1 | 1.43mi |
| 2912 Grindon Ave Baltimore, MD | 5.0 | 3.5 | 2400 | $3,300 | $1.38 | 11d | 1 | 1.46mi |
| 324 E 23rd St Baltimore, MD | 3.0 | 1.5 | 2018 | $2,200 | $1.09 | 24d | 1 | 1.47mi |
| 706 E 43rd St Baltimore, MD | 4.0 | 1.5 | 1596 | $1,899 | $1.19 | 2d | 1 | 1.48mi |
Listing history 26 events
-
2026-06-18days on market $112,000 Active 26 DOM
-
2026-06-17days on market $112,000 Active 25 DOM
-
2026-06-16days on market $112,000 Active 24 DOM
-
2026-06-15days on market $112,000 Active 23 DOM
-
2026-06-13days on market $112,000 Active 21 DOM
-
2026-06-09days on market $112,000 Active 17 DOM
-
2026-06-08days on market $112,000 Active 16 DOM
-
2026-06-07days on market $112,000 Active 15 DOM
-
2026-06-04days on market $112,000 Active 12 DOM
-
2026-06-03days on market $112,000 Active 11 DOM
-
2026-06-02days on market $112,000 Active 10 DOM
-
2026-06-01days on market $112,000 Active 9 DOM
-
2026-05-31days on market $112,000 Active 8 DOM
-
2026-05-23$112,000 Active
-
2024-02-09historical
-
2023-11-08$250,000 Active
-
2023-11-05historical
-
2015-12-23Active
-
2015-12-23historical Withdrawn
-
2012-03-24historical Withdrawn
-
2012-03-24historical
-
2011-12-10Active
-
2011-12-10$185,000
-
2008-08-01historical
-
2008-05-06
-
2005-03-07soldstatus $43,050
ⓘ Source: listings_history table (triggers on properties + properties_extension) + one-shot
backfill from property_details.listing_events for pre-trigger history.
Climate risk First Street
- Flood 1/10 Low FEMA zone X (unshaded) · 0% chance over 30 yrs
- Wildfire 1/10 Low
- Heat 7/10 Severe 7 d/yr ≥103°F today · 15 d/yr by 30 yrs out
- Wind 6/10 Major 27% chance of damaging wind over 30 yrs
- Air quality 4/10 Moderate 6 unhealthy d/yr today · 7 by 30 yrs out
Nearby sold comps map
Loading sold comps map…
Walkable amenities ~0.75 mi
Loading nearby amenities…
Taxation est. · year 1
- Rental income
- $25,944
- − Mortgage interest
- −$6,274
- − Property taxes
- −$1,680
- − Insurance
- −$560
- − Repairs & maintenance
- −$2,076
- − Management
- −$2,076
- − Depreciation
- −$3,258
- Taxable income
- $10,021
- Est. tax owed @ 24.0%
- −$2,405
- After-tax cash flow
- $8,803/yr
For passive investors: Depreciation is non-cash, so a rental often shows a tax loss while cash-flowing — sheltering income. Rental losses are passive: they offset passive income freely, and up to $25,000/yr can offset ordinary (W-2) income if you actively participate and your MAGI is under $100k (phasing out to $0 by $150k); unused losses carry forward. On sale, claimed depreciation is recaptured at up to 25%, and gains may owe capital-gains tax (a 1031 exchange can defer both). Figures are a year-1 estimate at your 24.0% rate — not tax advice; consult a CPA.
Schools (NCES district)
- District
- Baltimore City Public Schools
- NCES district ID
- 2400090
- Math proficiency
- 7% ▼ -9.00%
- Reading proficiency
- 16% ▼ -5.00%
- Median HH income
- $42,108
- Composite
- 10.08/100
- National rank
- #9805
- State rank
- #24 of 24 in MD
Livability — Baltimore
- Score
- 76/100
- State rank
- #90
- US rank
- #3396
Category grades
Schools grade is shown separately in the Schools card above.
Census & demographics
- Census place
- Baltimore, MD
- County
- Baltimore City · 558,601 people
- City population
- 588,727
- Metro
- Baltimore-Columbia-Towson, MD
- Population (ZIP)
- 44,014
- Household income
- $62,488
- Rent vs Own
- Severe rent burden
- 2564.0
Population outlook (Baltimore County) Hauer SSP2
- Today (2025)
- 624,249 people
- By 2030
- 621,541 · -0.4%
- By 2040
- 609,756 · -2.3%
- By 2050
- 597,249 · -4.3%
- By 2075
- 552,236 · -11.5%
- By 2100
- 513,934 · -17.7%
Race, ethnicity, and origin ACS 2023
- Neighborhood character
- Diverse neighborhood (Simpson 0.58)
- Race & ethnicity
- Black 60% White 26% Two or more races 6% Hispanic / Latino 5% Asian 5%
- Hispanic origin (detail)
- Common ancestry
- Romanian 2% Italian 1% Scotch-Irish 1%
- Foreign-born
- 10% · Canada, China, South Korea
- Languages at home
- 87% English-only · Spanish 4% French/Haitian/Cajun 2% Chinese 2%
Political lean MEDSL · Baltimore
- 2024 margin
- Solid D (+73.0) · D 85.2% · R 12.2% · Other 2.6%
- 2008→2024 swing
- -2.5pp toward R · 2008: 75.5pp · 2024: 73.0pp
- All cycles
- 2024: D+73.0 2020: D+76.6 2016: D+74.6 2012: D+76.4 2008: D+75.5
Not yet ingested
- Civics
- —
Market trends
- HPI YoY
- ▼ -463.14%
- Current HPI
- 292.3986
- Rent YoY
- ▲ 1.63%
- Metro
- Baltimore-Columbia-Towson, MD
- State GDP YoY
- ▲ 2.97%
- F500 in state
- 12
Industry mix (Fortune 500 HQ in MD)
| Industry | F500 HQs | Revenue |
|---|---|---|
| Aerospace / Defense | 1 | $71B |
|
||
| Utilities | 1 | $25B |
|
||
| Hotels | 1 | $24B |
|
||
| Consumer Goods | 1 | $7B |
|
||
| Real Estate | 1 | $6B |
|
||
| Chemicals | 1 | $2B |
|
||
Price history
+160.2% since first listed13 events — show timeline
- 2026-05-23 Listed $112,000 BRIGHT MLS
- 2024-02-09 Listing Removed — BRIGHT MLS
- 2023-11-08 Listed $250,000 BRIGHT MLS
- 2023-11-05 Coming Soon — BRIGHT MLS
- 2015-12-23 Listed — MRIS
- 2015-12-23 Delisted — MRIS
- 2012-03-24 Delisted — MRIS
- 2012-03-24 Listing Removed — BRIGHT MLS
- 2011-12-10 Listed — MRIS
- 2011-12-10 Listed $185,000 BRIGHT MLS
- 2008-08-01 Delisted — MRIS
- 2008-05-06 Listed — MRIS
- 2005-03-07 Sold (Public Records) $43,050 Public Records
Property tax history
-17.4%/yrLatest (2025): $164 · +0.0% YoY. Source: county tax records.
Cash-flow waterfall
monthlySold comps — $/sqft
last 12 mo · ≤1 miLoading sold comps…