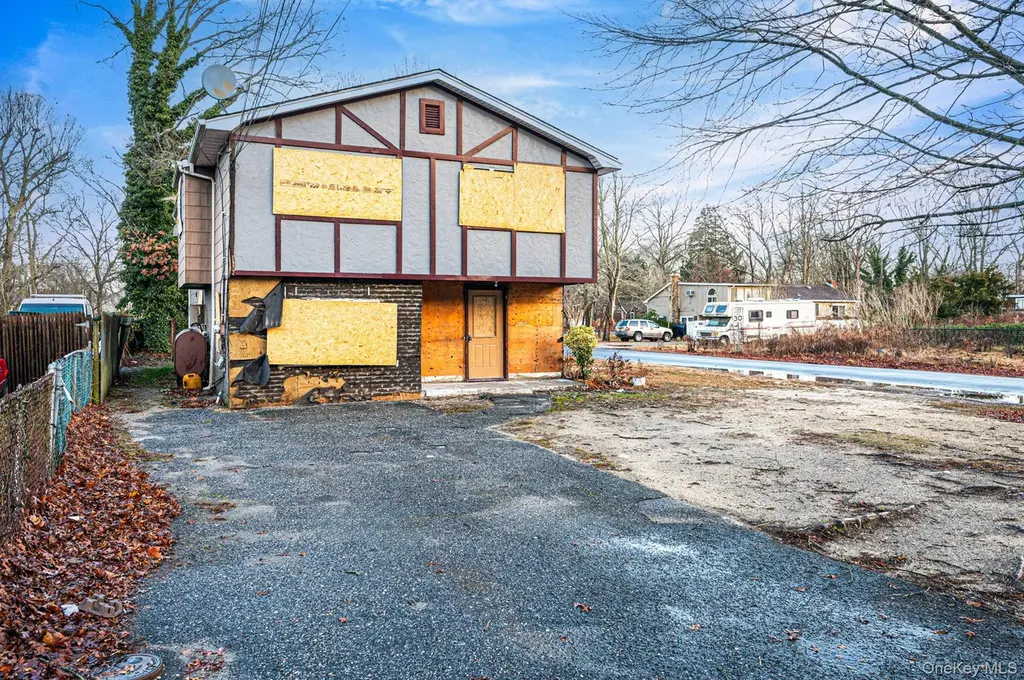
53 Hounslow Rd · Shirley, NY
Flood risk 1/10 · Minimal
- FEMA flood zone
- X (unshaded)
- Chance of flooding over 30 yrs
- 0.0%
- Est. flood insurance / yr
- $507 – $1,088
Fire risk 1/10 · Minimal
- Est. fire insurance / yr
- $691 – $1,283
Heat risk 4/10 · Minor
- Hot days now (above 92°F)
- 7 days/yr
- Hot days in 30 yrs
- 19 days/yr
Wind risk 8/10 · Major
- Chance of severe wind over 30 yrs
- 80.0%
Air-quality risk 4/10 · Minor
- Unhealthy air days now
- 3 days/yr
- Unhealthy air days in 30 yrs
- 5 days/yr
Risk factors via First Street. Map © Google.
Why this score? — see what drove the B grade
The composite is a weighted blend of 9 inputs, each scored 0–100. Each bar is that input's sub-score; the figure is the points it added to the 100-point composite (weight × sub-score).
- Cash flow +27.4/30.0
- ARV discount +15.0/15.0
- DSCR +9.6/10.0
- 1% rule +8.4/10.0
- Schools +4.7/10.0
- Livability +3.1/5.0
- Rent growth +2.5/5.0
- Condition / age +2.5/5.0
- Appreciation +0.0/10.0
$399,999
🖨 Deal sheet (PDF) 📄 Offer letter ✓ Due diligence
Listing remarks MLS
Great opportunity for investors or buyers looking to add value. This 3-bedroom, 1 full and 1 half bath hi-ranch sits on a corner lot in Shirley with taxes under $10,000. The home needs work and is being sold as-is, making it ideal for a renovation or flip. Cash only.
Key facts
- 5,227 sq ft lot
- Built 1974
- Listed 44 days
Neighborhood map
What this means for you Summary
Snapshot
- This is a 3-bed/1.5-bath single-family listed at $400k.
Deal economics
- At list price, monthly cash flow is $1k ($14k/yr) — positive.
- The deal already cash-flows at list — no discount required.
- Meets the 1% rule at list price ($5k rent vs $400k).
- Recommended offer: $388k (3.0% below list) — sets the bar for market timing.
- Cap rate 9.8% vs local median 4.8% in Shirley — top-decile yield for the area; either an underpriced asset or a hidden risk that comps aren't pricing in. Stress-test before assuming the spread holds.
Location & tenants
- Location reads 62/100 on livability (#886 in NY) — a middle-class / working-renter tenant base. Strengths: employment A+, housing A+; Watch: crime D+, schools F, amenities F.
- William Floyd Union Free School District (suburban): math 48% / reading 57% proficiency, ranked #309 of 590 in NY (top 52%) — acceptable for families but not a draw, mixed tenant base, ~2y average lease.
- Market conditions: 183 active listings in the ZIP; 3 comparable units currently listed for rent nearby; rentals at typical pace (median 25d on market — plan ~3-4 weeks tenant-placement turnaround); 1,366 units permitted in Suffolk County in 2024 (216 in 5+ unit buildings).
Forward outlook
- Local home prices are declining (-3.0%/yr); year-one equity from $3k of loan paydown is wiped out by about $12k of value loss. Plan a longer hold.
- Suffolk County population projected to shrink 5% by 2050 — rents likely to lag national; underwrite the cash flow, not the appreciation.
- At projected returns (-3.0% appreciation + 3.0% rent growth), your $112k cash investment doubles in ~9 years — after that, you're playing with house money.
Negotiation context
- It's been on market 44 days — a 3% lower offer ($388k) is reasonable based on typical stale-listing flexibility.
- 7 sale attempts since 12y ago with the ask held roughly flat each time — persistent listings suggest the price (not the market) is what's stuck; bring a comps-based counter.
Risks & watch-outs
- Climate carrying-cost: severe wind risk, 80% chance of damaging wind over 30y — expect insurance premiums to compound above CPI over the hold.
Questions for the listing agent
- It's been on market 44 days. Have you received any prior offers? Is the seller open to a 3% concession, seller financing, or rate buy-down credit?
- Built in 1974 — when were the roof, HVAC, electrical panel, plumbing, and water heater last replaced?
- Is there a deadline driving the sale (1031 exchange, divorce, estate, relocation)? That informs how much negotiation room exists.
- Schools are F-rated, which usually means shorter tenancies and higher turnover. Who's the typical renter profile here, and what's been the actual vacancy rate?
- Crime grade is D in this area — have there been break-ins, vandalism, or insurance claims at this property in the last 3 years? What carrier currently insures it and at what premium?
- What's the average days-on-market for RENTAL listings here right now (not sales)? A rising rental-DOM trend means longer vacancies and softer asking-rent achievability than the comps imply.
- What's the recent tenant-quality profile in this submarket — average credit score on applications, eviction rate, late-payment / NSF rate, and stable-employment percentage? A property-management company in the area should have these aggregated.
- How much new for-sale + rental construction is in the pipeline within 1–3 miles? Heavy new supply typically softens prices + rents 12–24 months out; constrained supply supports both.
Investment metrics
- 1% rule
- 1.34% ✓
- Cap rate
- 9.79%
- Cash-on-cash
- 12.50%
- DSCR
- 1.56
- GRM
- 6.2
CMA / ARV
- ARV (median comp)
- $637,722
- List price
- $399,999
- Delta
- -37.28%
- Verdict
- UNDERPRICED
- Comps
- 20 within 1.0 mi
Show comp detail 12 sales within ~0.75 mi
| Address | Dist | Beds/Ba | Sqft | Sold | Price | $/sf | Match |
|---|---|---|---|---|---|---|---|
| 45 Arrowhead Dr | 0.46mi | 3/3.0 | 2,112 (+4%) | 5mo | $600,000 | $284 | 62 |
| 118 Lexington Rd | 0.37mi | 4/2.5 (+1) | 2,137 (+5%) | 4mo | $540,000 | $253 | 61 |
| 63 Linden Ln | 0.33mi | 4/2.0 (+1) | 2,171 (+7%) | 11mo | $600,000 | $276 | 57 |
| 17 Ostend Cir | 0.44mi | 3/2.5 | 1,808 (-11%) | 2mo | $510,000 | $282 | 56 |
| 60 Heston Rd | 0.21mi | 4/3.0 (+1) | 2,250 (+11%) | 10mo | $620,000 | $276 | 53 |
| 28 Mastic Blvd | 0.69mi | 3/1.0 | 2,015 (-1%) | 15mo | $420,000 | $208 | 52 |
| 29 Bedford Ave | 0.72mi | 3/1.5 | 1,810 (-11%) | 4mo | $550,000 | $304 | 45 |
| 32 Rockledge Dr | 0.57mi | 3/2.0 | 1,736 (-15%) | 3mo | $520,000 | $300 | 45 |
| 31 Windus | 0.32mi | 4/2.5 (+1) | 2,280 (+12%) | 15mo | $670,000 | $294 | 44 |
| 219 Floyd Rd | 0.67mi | 4/2.5 (+1) | 1,907 (-6%) | 13mo | $600,000 | $315 | 39 |
| 123 Hawthorne St | 0.75mi | 4/2.5 (+1) | 1,805 (-11%) | 5mo | $579,000 | $321 | 33 |
| 11 Reeves Pl | 0.67mi | 3/2.0 | 1,765 (-13%) | 23mo | $610,000 | $346 | 25 |
Match score weights: distance 35% · size 25% · config 20% · recency 20%. Top-matched comps best support the ARV.
Projected returns pro-forma
-3.0% appreciation · 3.0% rent growth · sell at horizon
- IRR
- 2.3%
- Equity multiple
- 1.09×
- Total profit
- $9,792
- Equity at exit
- $59,641
- IRR
- 11.9%
- Equity multiple
- 1.94×
- Total profit
- $105,362
- Equity at exit
- $34,585
Cash invested: $112,000 (down + closing). Projections, not guarantees.
Landlord ↔ Tenant lean methodology
- Overall (STATE)
- 15 Strongly Tenant-Friendly
- State New York
- 15 Strongly Tenant-Friendly · D+10
- County
- — inherits STATE
- City
- — inherits STATE
ZIP-level market 11967
- Home prices YoY
- -33.1%
- Active inventory
- 183
- Price-to-rent
- 6.2×
Monthly cashflow live
- Estimated rent
- $5,378 medium interval (Pro) →
- Mortgage (P&I)
- −$2,098
- Tax from tax record
- −$817 /mo · $9,802/yr
- Insurance
- −$167
- HOA
- −$0
- Vacancy / Maint / Mgmt
- −$1,129
- Net cashflow
- $1,167
Break-even live
Sensitivity live
| Price | -10% $1,394 | -5% $1,280 | +0% $1,167 | +5% $1,054 | +10% $941 |
|---|---|---|---|---|---|
| Rent | -10% $742 | -5% $955 | +0% $1,167 | +5% $1,380 | +10% $1,592 |
| Rate | -1.0pp $1,369 | -0.5pp $1,269 | base $1,167 | +0.5pp $1,063 | +1.0pp $958 |
UW: 25.0% down · 7.5% · 30yr · 1.5% tax · 5.0% vac · 8.0% maint · 8.0% mgmt
Financing live
Cash to close
- Down payment
- $100,000
- Closing costs
- $12,000
- Reserves months
- —
- Total cash needed
- —
Loan-product check · same deal, 3 products live
Conventional
25% down · 7.5% · 30yr
- Down + closing
- —
- Monthly P&I
- —
- Monthly cashflow
- —
- DSCR
- —
- Eligible?
- —
Personal DTI + credit; lowest rate.
DSCR
20% down · 8.5% · 30yr
- Down + closing
- —
- Monthly P&I
- —
- Monthly cashflow
- —
- DSCR
- —
- Eligible?
- —
No personal income docs; deal must DSCR.
Hard money
10% down · 12.0% · 12mo
- Down + closing
- —
- Monthly P&I
- —
- Monthly cashflow
- —
- DSCR
- —
- Eligible?
- —
Short-term bridge; refi at stabilization.
Rent comps 3 comps
| Address | Beds | Baths | Sqft | Rent | $/sqft | DOM | Units | Dist |
|---|---|---|---|---|---|---|---|---|
| 357 Smith Rd Shirley, NY | 3.0 | 2.0 | 2000 | $6,500 | $3.25 | 3d | 1 | 0.89mi |
| 14 Titmus Dr Mastic, NY | 4.0 | 1.0 | 1428 | $3,800 | $2.66 | 44d | 1 | 1.12mi |
| 42 Revilo Ave Shirley, NY | 3.0 | 2.0 | 2670 | $5,000 | $1.87 | 25d | 1 | 1.13mi |
Listing history 21 events
-
2026-04-07$399,999 Active 267-char remark
Show marketing remark (267 chars)
Great opportunity for investors or buyers looking to add value. This 3-bedroom, 1 full and 1 half bath hi-ranch sits on a corner lot in Shirley with taxes under $10,000. The home needs work and is being sold as-is, making it ideal for a renovation or flip. Cash only.
-
2026-04-06historical
-
2026-02-10price $419,999
-
2025-12-29$449,000 Active
-
2025-02-28soldstatus $385,000 Closed
-
2025-01-24status Pending
-
2025-01-03$399,000 Active
-
2018-10-05soldstatus $130,000
-
2017-02-24historical
-
2017-02-03status Back On Market
-
2017-02-03price $145,000
-
2016-12-08historical
-
2016-10-13historical
-
2016-10-13$135,000 New
-
2016-10-10price $139,000
-
2016-09-28price $140,000
-
2016-09-08$149,000 New
-
2014-11-06historical
-
2014-08-06$159,999
-
2004-09-16soldstatus $200,000
-
1987-05-04soldstatus $120,000
ⓘ Source: listings_history table (triggers on properties + properties_extension) + one-shot
backfill from property_details.listing_events for pre-trigger history.
Tax reassessment forecast NY · Partial reset (capped growth)
- Current annual tax
- $9,802 · $817/mo
- Projected year-2 tax
- $9,802 · $817/mo
- Expected delta
- $0/yr ($0/mo · 0.0%)
ⓘ Screening estimate from a state-policy table — verify with the county assessor before closing.
Climate risk First Street
- Flood 1/10 Low FEMA zone X (unshaded) · 0% chance over 30 yrs
- Wildfire 1/10 Low
- Heat 4/10 Moderate 7 d/yr ≥92°F today · 19 d/yr by 30 yrs out
- Wind 8/10 Severe 80% chance of damaging wind over 30 yrs
- Air quality 4/10 Moderate 3 unhealthy d/yr today · 5 by 30 yrs out
Nearby sold comps map
Loading sold comps map…
Walkable amenities ~0.75 mi
Loading nearby amenities…
Taxation est. · year 1
- Rental income
- $64,530
- − Mortgage interest
- −$22,406
- − Property taxes
- −$9,802
- − Insurance
- −$2,000
- − Repairs & maintenance
- −$5,162
- − Management
- −$5,162
- − Depreciation
- −$11,636
- Taxable income
- $8,361
- Est. tax owed @ 24.0%
- −$2,007
- After-tax cash flow
- $11,999/yr
For passive investors: Depreciation is non-cash, so a rental often shows a tax loss while cash-flowing — sheltering income. Rental losses are passive: they offset passive income freely, and up to $25,000/yr can offset ordinary (W-2) income if you actively participate and your MAGI is under $100k (phasing out to $0 by $150k); unused losses carry forward. On sale, claimed depreciation is recaptured at up to 25%, and gains may owe capital-gains tax (a 1031 exchange can defer both). Figures are a year-1 estimate at your 24.0% rate — not tax advice; consult a CPA.
Schools (NCES district)
- District
- William Floyd Union Free School District
- NCES district ID
- 3618690
- Math proficiency
- 48% ▲ 3.00%
- Reading proficiency
- 57% ▲ 11.00%
- Median HH income
- $70,564
- Composite
- 46.79/100
- National rank
- #2383
- State rank
- #309 of 590 in NY
Livability — Shirley
- Score
- 62/100
- State rank
- #886
- US rank
- #17184
Category grades
Schools grade is shown separately in the Schools card above.
Census & demographics
- Census place
- Shirley, NY
- City population
- 27,266
- Population (ZIP)
- 27,266
Population outlook (Suffolk County) Hauer SSP2
- Today (2025)
- 1,505,262 people
- By 2030
- 1,498,318 · -0.5%
- By 2040
- 1,471,101 · -2.3%
- By 2050
- 1,424,848 · -5.3%
- By 2075
- 1,337,157 · -11.2%
- By 2100
- 1,217,720 · -19.1%
Race, ethnicity, and origin ACS 2023
- Neighborhood character
- Diverse neighborhood (Simpson 0.57)
- Race & ethnicity
- White 59% Hispanic / Latino 25% Black 9% Two or more races 8% Asian 4%
- Hispanic origin (detail)
- Puerto Rican 10% Dominican 2%
- Common ancestry
- Romanian 3% Lithuanian 2% Scotch-Irish 1%
- Foreign-born
- 12% · Canada, China, Jamaica
- Languages at home
- 76% English-only · Spanish 17% Other Indo-European 4% Chinese 1%
Political lean MEDSL · Suffolk
- 2024 margin
- Lean R (+10.0) · D 45.0% · R 55.0%
- 2008→2024 swing
- -16.0pp toward R · 2008: 6.0pp · 2024: -10.0pp
- All cycles
- 2024: R+10.0 2020: R+0.0 2016: R+8.2 2012: D+2.9 2008: D+6.0
Not yet ingested
- Civics
- —
Market trends
- HPI YoY
- ▼ -212.21%
- Current HPI
- 428.8362
- Rent YoY
- —
- Metro
- —
- State GDP YoY
- ▲ 2.60%
- F500 in state
- 92
Industry mix (Fortune 500 HQ in NY)
| Industry | F500 HQs | Revenue |
|---|---|---|
| Financial Services | 10 | $950B |
|
||
| Consumer Goods | 9 | $162B |
|
||
| Insurance | 4 | $225B |
|
||
| Telecommunications | 2 | $144B |
|
||
| Pharmaceuticals | 2 | $112B |
|
||
| Media / Entertainment | 2 | $69B |
|
||
Price history
+233.3% since first listed21 events — show timeline
- 2026-04-07 Listed $399,999 OneKey® MLS as Distributed by MLS Grid
- 2026-04-06 Listing Removed — OneKey® MLS as Distributed by MLS Grid
- 2026-02-10 Price Changed $419,999 OneKey® MLS as Distributed by MLS Grid
- 2025-12-29 Listed $449,000 OneKey® MLS as Distributed by MLS Grid
- 2025-02-28 Sold (MLS) $385,000 OneKey® MLS as Distributed by MLS Grid
- 2025-01-24 Pending — OneKey® MLS as Distributed by MLS Grid
- 2025-01-03 Listed $399,000 OneKey® MLS as Distributed by MLS Grid
- 2018-10-05 Sold (Public Records) $130,000 Public Records
- 2017-02-24 Listing Removed — OneKey® MLS as Distributed by MLS Grid
- 2017-02-03 Relisted — OneKey® MLS as Distributed by MLS Grid
- 2017-02-03 Price Changed $145,000 OneKey® MLS as Distributed by MLS Grid
- 2016-12-08 Listing Removed — OneKey® MLS as Distributed by MLS Grid
- 2016-10-13 Listing Removed — OneKey® MLS as Distributed by MLS Grid
- 2016-10-13 Listed $135,000 OneKey® MLS as Distributed by MLS Grid
- 2016-10-10 Price Changed $139,000 OneKey® MLS as Distributed by MLS Grid
- 2016-09-28 Price Changed $140,000 OneKey® MLS as Distributed by MLS Grid
- 2016-09-08 Listed $149,000 OneKey® MLS as Distributed by MLS Grid
- 2014-11-06 Listing Removed — OneKey® MLS as Distributed by MLS Grid
- 2014-08-06 Listed $159,999 OneKey® MLS as Distributed by MLS Grid
- 2004-09-16 Sold (Public Records) $200,000 Public Records
- 1987-05-04 Sold (Public Records) $120,000 Public Records
Property tax history
+1.4%/yrLatest (2025): $9,802 · +0.0% YoY. Source: county tax records.
Cash-flow waterfall
monthlySold comps — $/sqft
last 12 mo · ≤1 miLoading sold comps…