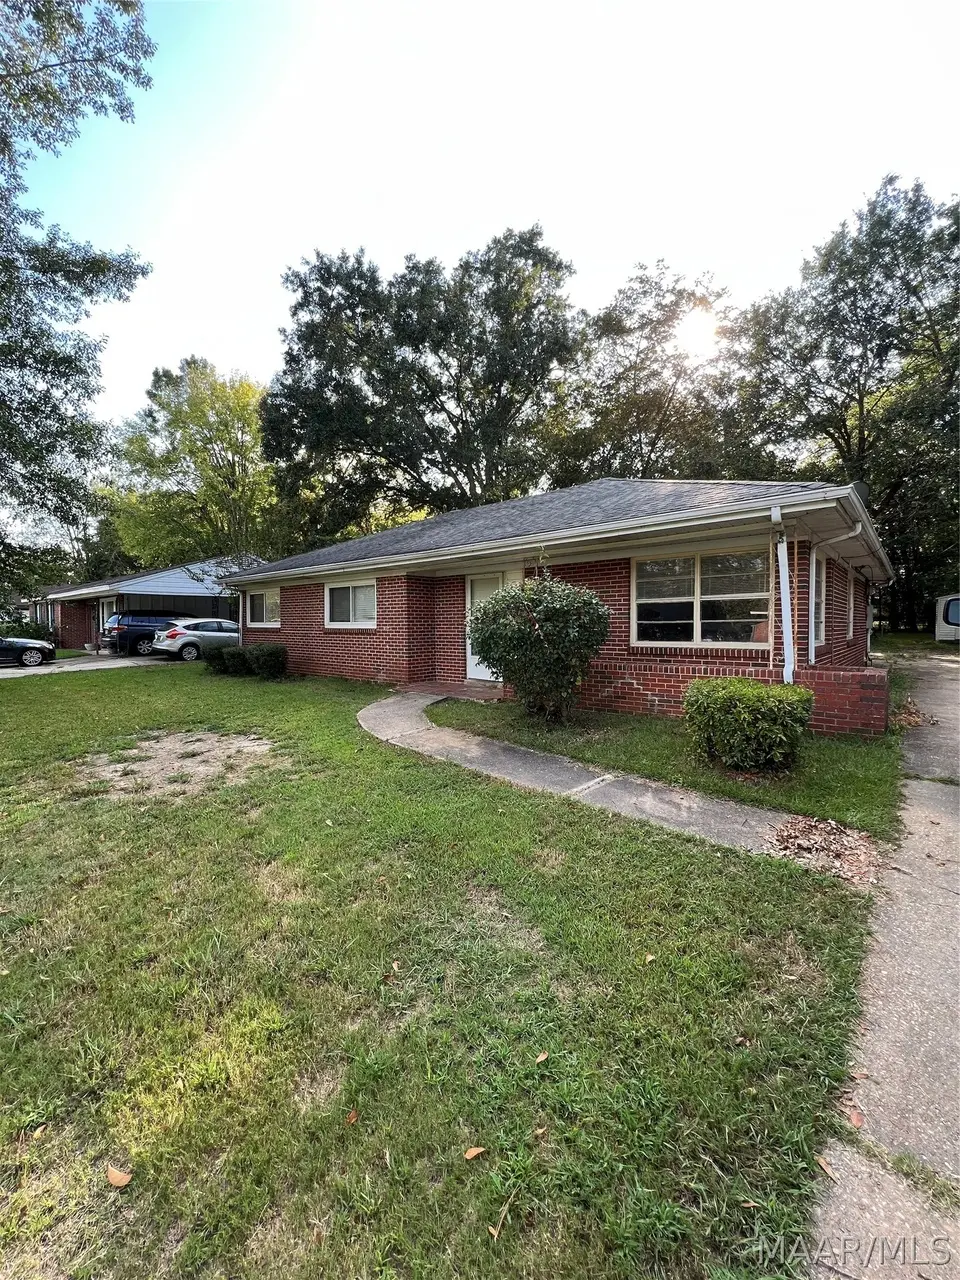
3446 Princeton Rd · Montgomery, AL
Flood risk 1/10 · Minimal
- FEMA flood zone
- X (unshaded)
- Chance of flooding over 30 yrs
- 0.0%
- Est. flood insurance / yr
- $507 – $1,088
Fire risk 1/10 · Minimal
- Est. fire insurance / yr
- $916 – $1,700
Heat risk 7/10 · Major
- Hot days now (above 108°F)
- 7 days/yr
- Hot days in 30 yrs
- 20 days/yr
Wind risk 8/10 · Major
- Chance of severe wind over 30 yrs
- 80.0%
Air-quality risk 2/10 · Minimal
- Unhealthy air days now
- 1 days/yr
- Unhealthy air days in 30 yrs
- 1 days/yr
Risk factors via First Street. Map © Google.
Why this score? — see what drove the C- grade
The composite is a weighted blend of 9 inputs, each scored 0–100. Each bar is that input's sub-score; the figure is the points it added to the 100-point composite (weight × sub-score).
- Cash flow +26.1/30.0
- DSCR +8.8/10.0
- 1% rule +6.1/10.0
- Livability +3.2/5.0
- Rent growth +2.5/5.0
- Condition / age +2.5/5.0
- Schools +1.7/10.0
- ARV discount +0.0/15.0
- Appreciation +0.0/10.0
$110,000
🖨 Deal sheet 📄 Offer letter ✓ Due diligence
Listing remarks MLS
ARE YOU LOOKING FOR A GOOD INVESTMENT TO MULTIPLY YOUR RETURN? HURRY TO SEE THIS GREAT HOUSE WITH A LOT OF POTENTIAL. LOT OF SPACE, GREAT YARD, AND NICE FLOOR PLAN. WOOD FLOORS AND SPACIOUS ROOMS. BANK OF AMERICA PRE-QUALIFICATION LETTER REQUIRED ON ALL FINANCED OFFERS * * * NO EXCEPTIONS. SALE ON TERMS ACCEPTABLE TO SELLER * * * FREE APPRAISAL & CREDIT REPORT IF FINANCE THRU BANK OF AMERICA HOME LOANS. ADDENDUMS REQUIRED. * * * ALLOW 2-3 DAY FOR SELLER'S RESPONSE * * * CONDITION AND OPERATION OF SYSTEMS UNKNOWN * * * ALL CASH OFFERS PROVIDE VERIFICATION IN WRITING FROM THEIR BANKING INSTITUTION * * * "PROPERTY TO BE SOLD AS IS. "
Key facts
- 0.5 acre lot
- Parking
- Built 1953
Property features AI
Finance
- Financial info: Existing lease through 2026-11-30
Exterior
- Parking: Driveway
- Utilities: Public water; Public sewer; Electricity available; Cable available
- Home design: Single-story home; Brick construction; Slab foundation
- Construction: Brick exterior; Built (year per public records); Slab foundation
- Exterior features: Partial fencing; Porch; Patio; City lot
Interior
- Kitchen: Kitchen on the first level
- Bedrooms: Multiple bedrooms on the first level
- Flooring: Carpet; Tile; Wood
- Bathrooms: Two full bathrooms on the first level
- Heating & cooling: Central heating (electric); Central electric cooling
- Interior features: Separate shower; Carpet, tile and wood flooring
- Laundry & utility: Laundry room on the first level; Electric water heater
Neighborhood map
What this means for you Summary
Snapshot
- This is a 4-bed/2.0-bath single-family listed at $110k.
Deal economics
- At list price, monthly cash flow is $277 ($3k/yr) — positive.
- The deal already cash-flows at list — no discount required.
- Meets the 1% rule at list price ($1k rent vs $110k).
- Cap rate 9.3% vs local median 6.0% in Montgomery — top-decile yield for the area; either an underpriced asset or a hidden risk that comps aren't pricing in. Stress-test before assuming the spread holds.
Location & tenants
- Location reads 65/100 on livability (#138 in AL) — a middle-class / working-renter tenant base. Strengths: cost of living A+, housing A+; Watch: schools C-, employment D, crime F.
- Montgomery County (urban): math 9% / reading 31% proficiency, ranked #106 of 129 in AL (top 82%) — low school quality limits family demand, transient renter base, plan for 1-2y turnover; 70% free/reduced lunch — lower-income household profile, screen leases tightly.
- Market conditions: 110 active listings in the ZIP; 36 comparable units currently listed for rent nearby; rentals at typical pace (median 21d on market — plan ~3-4 weeks tenant-placement turnaround); 44% of comp listings sitting > 30 days — soft ceiling on asking rent; 460 units permitted in Montgomery County in 2024 (37 in 5+ unit buildings).
Forward outlook
- Local home prices are declining (-3.0%/yr); year-one equity from $761 of loan paydown is wiped out by about $3k of value loss. Plan a longer hold.
- Montgomery County population projected to shrink 8% by 2050 — rents likely to lag national; underwrite the cash flow, not the appreciation.
Negotiation context
- Only 1 days on market — expect competitive offers; lowballing is unlikely to land.
- 2 sale attempts since 16y ago with the ask held roughly flat each time — persistent listings suggest the price (not the market) is what's stuck; bring a comps-based counter.
- Current owner paid $75k; 47% above their basis — modest negotiation headroom, anchor on the comps not their cost.
Risks & watch-outs
- Watch-outs: built in 1953 — expect roof / HVAC / electrical / plumbing capex.
- Climate carrying-cost: severe wind risk, 80% chance of damaging wind over 30y; extreme-heat days projected 7→20/yr by 2055 (HVAC capex compounding) — expect insurance premiums to compound above CPI over the hold.
Questions for the listing agent
- Built in 1953 — when were the roof, HVAC, electrical panel, plumbing, and water heater last replaced?
- Is there a deadline driving the sale (1031 exchange, divorce, estate, relocation)? That informs how much negotiation room exists.
- Crime grade is F in this area — have there been break-ins, vandalism, or insurance claims at this property in the last 3 years? What carrier currently insures it and at what premium?
- What's the average days-on-market for RENTAL listings here right now (not sales)? A rising rental-DOM trend means longer vacancies and softer asking-rent achievability than the comps imply.
- What's the recent tenant-quality profile in this submarket — average credit score on applications, eviction rate, late-payment / NSF rate, and stable-employment percentage? A property-management company in the area should have these aggregated.
- How much new for-sale + rental construction is in the pipeline within 1–3 miles? Heavy new supply typically softens prices + rents 12–24 months out; constrained supply supports both.
Investment metrics
- 1% rule
- 1.11% ✓
- Cap rate
- 9.32%
- Cash-on-cash
- 10.81%
- DSCR
- 1.48
- GRM
- 7.5
CMA / ARV
- ARV (on-the-fly)
- $82,460
- Comps found
- 12
Show comp detail 12 sales within ~0.75 mi
| Address | Dist | Beds/Ba | Sqft | Sold | Price | $/sf | Match |
|---|---|---|---|---|---|---|---|
| 3555 Berkley Dr | 0.24mi | 3/2.0 (-1) | 1,352 (+2%) | 1mo | $75,000 | $55 | 80 |
| 3523 Princeton Rd | 0.13mi | 3/1.0 (-1) | 1,407 (+6%) | 5mo | $55,000 | $39 | 71 |
| 3537 Princeton Rd | 0.17mi | 3/1.0 (-1) | 1,274 (-4%) | 9mo | $79,500 | $62 | 68 |
| 641 E Edgemont Ave | 0.35mi | 4/1.5 | 1,430 (+8%) | 2mo | $143,000 | $100 | 68 |
| 3639 Norman Bridge Rd | 0.46mi | 3/1.0 (-1) | 1,349 (+1%) | 8mo | $62,500 | $46 | 60 |
| 1301 Beaumont Dr | 0.41mi | 3/2.0 (-1) | 1,458 (+10%) | 6mo | $117,000 | $80 | 55 |
| 3357 S Hull St | 0.59mi | 3/1.0 (-1) | 1,413 (+6%) | 3mo | $46,000 | $33 | 51 |
| 3617 Wilmington Rd | 0.47mi | 3/1.0 (-1) | 1,233 (-7%) | 11mo | $10,000 | $8 | 48 |
| 3726 Stanley Dr | 0.58mi | 3/2.0 (-1) | 1,443 (+8%) | 11mo | $61,000 | $42 | 45 |
| 3257 S Hull St | 0.69mi | 3/2.0 (-1) | 1,506 (+13%) | 7mo | $143,900 | $96 | 35 |
| 329 Tanglewood Dr | 0.67mi | 4/1.0 | 1,523 (+14%) | 8mo | $95,000 | $62 | 34 |
| 610 Ponce De Leon Ave | 0.70mi | 3/2.0 (-1) | 1,521 (+14%) | 9mo | $218,000 | $143 | 31 |
Match score weights: distance 35% · size 25% · config 20% · recency 20%. Top-matched comps best support the ARV.
Projected returns pro-forma
-3.0% appreciation · 3.0% rent growth · sell at horizon
- IRR
- -0.2%
- Equity multiple
- 0.99×
- Total profit
- $-183
- Equity at exit
- $16,401
- IRR
- 9.5%
- Equity multiple
- 1.73×
- Total profit
- $22,477
- Equity at exit
- $9,511
Cash invested: $30,800 (down + closing). Projections, not guarantees.
Landlord ↔ Tenant lean methodology
- Overall (STATE)
- 90 Strongly Landlord-Friendly
- State Alabama
- 90 Strongly Landlord-Friendly · R+15
- County
- — inherits STATE
- City
- — inherits STATE
ZIP-level market 36111
- Home prices YoY
- -6.9%
- Active inventory
- 110
- Price-to-rent
- 7.5×
Monthly cashflow live
- Estimated rent
- $1,217 high interval (Pro) →
- Mortgage (P&I)
- −$577
- Tax from tax record
- −$61 /mo · $737/yr
- Insurance
- −$46
- HOA
- −$0
- Vacancy / Maint / Mgmt
- −$256
- Net cashflow
- $277
Break-even live
UW: 25.0% down · 7.5% · 30yr · 1.5% tax · 5.0% vac · 8.0% maint · 8.0% mgmt
Financing live
Cash to close
- Down payment
- $27,500
- Closing costs
- $3,300
- Reserves months
- —
- Total cash needed
- —
Loan-product check · same deal, 3 products live
Conventional
25% down · 7.5% · 30yr
- Down + closing
- —
- Monthly P&I
- —
- Monthly cashflow
- —
- DSCR
- —
- Eligible?
- —
Personal DTI + credit; lowest rate.
DSCR
20% down · 8.5% · 30yr
- Down + closing
- —
- Monthly P&I
- —
- Monthly cashflow
- —
- DSCR
- —
- Eligible?
- —
No personal income docs; deal must DSCR.
Hard money
10% down · 12.0% · 12mo
- Down + closing
- —
- Monthly P&I
- —
- Monthly cashflow
- —
- DSCR
- —
- Eligible?
- —
Short-term bridge; refi at stabilization.
Rent comps 36 comps
| Address | Beds | Baths | Sqft | Rent | $/sqft | DOM | Units | Dist |
|---|---|---|---|---|---|---|---|---|
| 3445 Le Bron Rd Montgomery, AL | 4.0 | 1.0 | 1100 | $1,050 | $0.95 | 21d | 1 | 0.05mi |
| 3369 Montezuma Rd Montgomery, AL | 3.0 | 1.0 | 1281 | $1,150 | $0.90 | 43d | 1 | 0.29mi |
| 3735 Bridlewood Dr Montgomery, AL | 3.0 | 1.0 | 1386 | $895 | $0.65 | 43d | 1 | 0.41mi |
| 3649 Princeton Rd Montgomery, AL | 3.0 | 1.0 | 1266 | $1,200 | $0.95 | 21d | 1 | 0.48mi |
| 3256 Montezuma Rd Montgomery, AL | 3.0 | 2.0 | 1515 | $1,450 | $0.96 | 43d | 1 | 0.48mi |
| 3608 Wilmington Rd Montgomery, AL | 3.0 | 1.0 | 1160 | $950 | $0.82 | 43d | 1 | 0.50mi |
| 3737 Wesley Dr Montgomery, AL | 3.0 | 2.0 | 1050 | $1,280 | $1.22 | 43d | 1 | 0.55mi |
| 3235 Norman Bridge Rd Montgomery, AL | 3.0 | 1.0 | 1873 | $900 | $0.48 | 43d | 1 | 0.56mi |
| 3701 Wesley Dr Unit 3723 Montgomery, AL | 3.0 | 1.0 | 1000 | $1,200 | $1.20 | 21d | 1 | 0.58mi |
| 3701 Wesley Dr Unit 3733 Montgomery, AL | 3.0 | 1.0 | 1000 | $1,280 | $1.28 | 43d | 1 | 0.58mi |
| 3701 Wesley Dr Unit 3737 Montgomery, AL | 3.0 | 2.0 | 1050 | $1,280 | $1.22 | 43d | 1 | 0.58mi |
| 3720 Stanley Dr Montgomery, AL | 4.0 | 2.0 | 1719 | $1,650 | $0.96 | 21d | 1 | 0.59mi |
| 3709 Wesley Dr Montgomery, AL | 3.0 | 1.0 | 1000 | $1,200 | $1.20 | 21d | 1 | 0.59mi |
| 3723 Wesley Dr Montgomery, AL | 3.0 | 1.0 | 1000 | $1,200 | $1.20 | 21d | 1 | 0.62mi |
| 3733 Wesley Dr Montgomery, AL | 3.0 | 1.0 | 1000 | $1,200 | $1.20 | 21d | 1 | 0.64mi |
| 3735 Wesley Dr Montgomery, AL | 3.0 | 1.0 | 1000 | $1,200 | $1.20 | 21d | 1 | 0.64mi |
| 1388 Adrian Ln Montgomery, AL | 5.0 | 2.0 | 1701 | $1,600 | $0.94 | 13d | 1 | 0.66mi |
| 3544 Southmont Dr Montgomery, AL | 4.0 | 1.5 | 1774 | $1,300 | $0.73 | 21d | 1 | 0.67mi |
| 1067 Roslyn Dr Montgomery, AL | 4.0 | 2.0 | 1760 | $1,125 | $0.64 | 21d | 1 | 0.74mi |
| 3770 Maclamar Rd Montgomery, AL | 3.0 | 1.0 | 1129 | $950 | $0.84 | 21d | 1 | 0.78mi |
| 3902 Wesley Dr Montgomery, AL | 5.0 | 2.0 | 1689 | $1,595 | $0.94 | 21d | 1 | 0.83mi |
| 2727 Boultier St Montgomery, AL | 1.0–3.0 | 1.0–2.0 | 1070 | $1,582 | $1.48 | 13d | 3 | 0.87mi |
| 139 Mount Vernon Dr Unit A Montgomery, AL | 4.0 | 2.5 | 1700 | $1,000 | $0.59 | 43d | 1 | 0.89mi |
| 1919 Norman Bridge Ct Unit 1043838P Montgomery, AL | 4.0 | 3.0 | 1539 | $4,108 | $2.67 | 43d | 1 | 0.93mi |
| 1114 Druid Hills Dr Montgomery, AL | 3.0 | 1.0 | 1192 | $1,250 | $1.05 | 21d | 1 | 0.95mi |
| 1450 Crenshaw Pl S Montgomery, AL | 3.0 | 2.0 | 1641 | $1,775 | $1.08 | 43d | 1 | 1.05mi |
| 1425 Blairwood Montgomery, AL | 3.0 | 2.0 | 1700 | $1,850 | $1.09 | 13d | 1 | 1.11mi |
| 253 John Morris Ave Montgomery, AL | 3.0 | 1.0 | 912 | $950 | $1.04 | 21d | 1 | 1.20mi |
| 4148 Edgar D Nixon Ave Montgomery, AL | 4.0 | 1.0 | 1208 | $1,200 | $0.99 | 43d | 1 | 1.23mi |
| 1355 Buckingham Dr Montgomery, AL | 4.0 | 2.0 | 1620 | $1,650 | $1.02 | 13d | 1 | 1.37mi |
| 4342 Sunshine Dr Montgomery, AL | 3.0 | 2.0 | 1323 | $1,250 | $0.94 | 13d | 1 | 1.38mi |
| 3616 Gaston Ave Montgomery, AL | 4.0 | 2.0 | 1629 | $1,300 | $0.80 | 43d | 1 | 1.43mi |
| 1259 S Lawrence St Montgomery, AL | 3.0 | 1.0 | 1728 | $1,300 | $0.75 | 43d | 1 | 1.46mi |
| 2045 Bullard St Unit 1043526P Montgomery, AL | 3.0 | 2.0 | 1797 | $2,198 | $1.22 | 43d | 1 | 1.48mi |
| 370 Collinwood Ave Montgomery, AL | 3.0 | 1.0 | 1080 | $1,000 | $0.93 | 21d | 1 | 1.48mi |
| 3577 Whiting Ave Montgomery, AL | 3.0 | 1.0 | 1269 | $1,150 | $0.91 | 43d | 1 | 1.49mi |
Listing history 2 events
-
2026-06-18remarks 150-char remark
-
2026-06-18$110,000 Active 1 DOM
ⓘ Source: listings_history table (triggers on properties + properties_extension) + one-shot
backfill from property_details.listing_events for pre-trigger history.
Tax reassessment forecast AL · Resets to sale price
- Current annual tax
- $737 · $61/mo
- Projected year-2 tax
- $737 · $61/mo
- Expected delta
- $0/yr ($0/mo · 0.0%)
ⓘ Screening estimate from a state-policy table — verify with the county assessor before closing.
Climate risk First Street
- Flood 1/10 Low FEMA zone X (unshaded) · 0% chance over 30 yrs
- Wildfire 1/10 Low
- Heat 7/10 Severe 7 d/yr ≥108°F today · 20 d/yr by 30 yrs out
- Wind 8/10 Severe 80% chance of damaging wind over 30 yrs
- Air quality 2/10 Low 1 unhealthy d/yr today · 1 by 30 yrs out
Nearby sold comps map
Loading sold comps map…
Walkable amenities ~0.75 mi
Loading nearby amenities…
Taxation est. · year 1
- Rental income
- $14,606
- − Mortgage interest
- −$6,162
- − Property taxes
- −$737
- − Insurance
- −$550
- − Repairs & maintenance
- −$1,168
- − Management
- −$1,168
- − Depreciation
- −$3,200
- Taxable income
- $1,620
- Est. tax owed @ 24.0%
- −$389
- After-tax cash flow
- $2,940/yr
For passive investors: Depreciation is non-cash, so a rental often shows a tax loss while cash-flowing — sheltering income. Rental losses are passive: they offset passive income freely, and up to $25,000/yr can offset ordinary (W-2) income if you actively participate and your MAGI is under $100k (phasing out to $0 by $150k); unused losses carry forward. On sale, claimed depreciation is recaptured at up to 25%, and gains may owe capital-gains tax (a 1031 exchange can defer both). Figures are a year-1 estimate at your 24.0% rate — not tax advice; consult a CPA.
Schools (NCES district)
- District
- Montgomery County
- NCES district ID
- 0102430
- Math proficiency
- 9% ▼ -21.00%
- Reading proficiency
- 31% ▼ -1.00%
- Median HH income
- $43,902
- Composite
- 17.24/100
- National rank
- #9093
- State rank
- #106 of 129 in AL
Livability — Montgomery
- Score
- 65/100
- State rank
- #138
- US rank
- #13416
Category grades
Schools grade is shown separately in the Schools card above.
Census & demographics
- Census place
- Montgomery, AL
- City population
- 175,913
- Population (ZIP)
- 12,196
Population outlook (Montgomery County) Hauer SSP2
- Today (2025)
- 224,008 people
- By 2030
- 221,460 · -1.1%
- By 2040
- 214,179 · -4.4%
- By 2050
- 204,912 · -8.5%
- By 2075
- 177,821 · -20.6%
- By 2100
- 145,134 · -35.2%
Race, ethnicity, and origin ACS 2023
- Neighborhood character
- Majority Black (60%)
- Race & ethnicity
- Black 60% White 34% Asian 3% Hispanic / Latino 2% Two or more races 2%
- Common ancestry
- Slovak 2% Serbian 2% Italian 1%
- Foreign-born
- 3% · China, Canada
- Languages at home
- 95% English-only · Other Indo-European 2% Spanish 1% Chinese 1%
Political lean MEDSL · Montgomery
- 2024 margin
- Solid D (+30.7) · D 64.8% · R 34.1% · Other 1.1%
- 2008→2024 swing
- +11.5pp toward D · 2008: 19.2pp · 2024: 30.7pp
- All cycles
- 2024: D+30.7 2020: D+31.5 2016: D+26.2 2012: D+24.3 2008: D+19.2
Not yet ingested
- Civics
- —
Market trends
- HPI YoY
- ▼ -11.63%
- Current HPI
- 156.4412
- Rent YoY
- —
- Metro
- —
- State GDP YoY
- ▲ 2.94%
- F500 in state
- 4
Industry mix (Fortune 500 HQ in AL)
| Industry | F500 HQs | Revenue |
|---|---|---|
| Financial Services | 1 | $8B |
|
||
| Healthcare | 1 | $5B |
|
||
Price history
+244.8% since first listed4 events — show timeline
- 2026-06-18 Listed $110,000 MAAR
- 2023-07-05 Sold (Public Records) $75,000 Public Records
- 2011-01-21 Sold (MLS) $30,000 MAAR
- 2010-11-22 Listed $31,900 MAAR
Property tax history
+4.6%/yrLatest (2025): $737 · -1.4% YoY. Source: county tax records.
Cash-flow waterfall
monthlySold comps — $/sqft
last 12 mo · ≤1 miLoading sold comps…