25157 Alcazar · Burnt Store Marina, FL
Flood risk 6/10 · Moderate
- FEMA flood zone
- D
- Chance of flooding over 30 yrs
- 0.72%
- Est. flood insurance / yr
- $544 – $1,084
Fire risk 5/10 · Moderate
- Est. fire insurance / yr
- $947 – $1,759
Heat risk 10/10 · Severe
- Hot days now (above 107°F)
- 7 days/yr
- Hot days in 30 yrs
- 29 days/yr
Wind risk 10/10 · Severe
- Chance of severe wind over 30 yrs
- 99.0%
Air-quality risk 2/10 · Minimal
- Unhealthy air days now
- 1 days/yr
- Unhealthy air days in 30 yrs
- 2 days/yr
Risk factors via First Street. Map © Google.
Why this score? — see what drove the F grade
The composite is a weighted blend of 9 inputs, each scored 0–100. Each bar is that input's sub-score; the figure is the points it added to the 100-point composite (weight × sub-score).
- Cash flow +8.6/30.0
- ARV discount +7.5/15.0
- Schools +4.6/10.0
- Livability +3.6/5.0
- 1% rule +2.5/10.0
- Rent growth +2.5/5.0
- Condition / age +2.5/5.0
- DSCR +2.3/10.0
- Appreciation +0.0/10.0
$335,000
🖨 Deal sheet (PDF) 📄 Offer letter ✓ Due diligence
Listing remarks
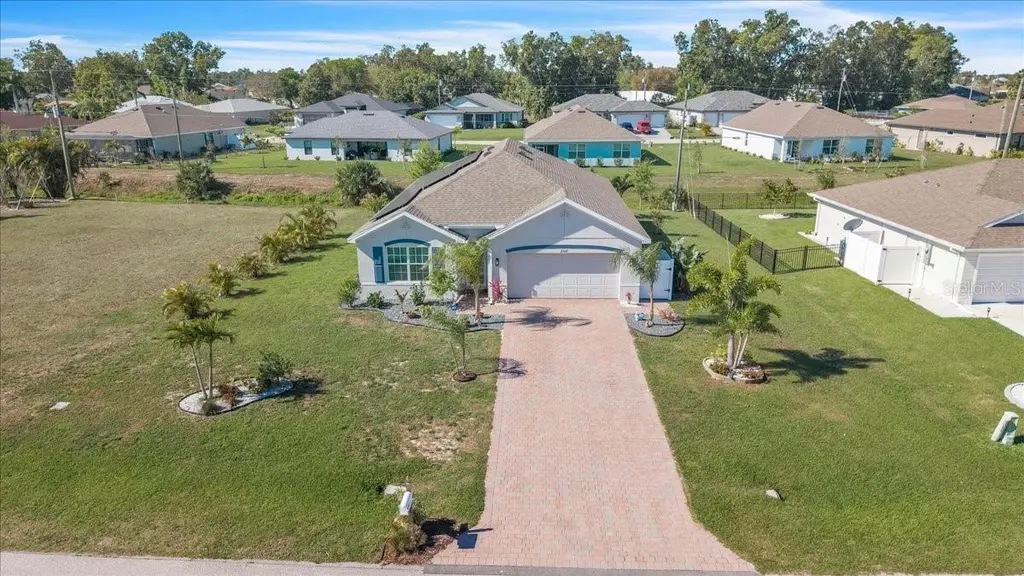
Beautifully upgraded DR Horton Kali model located in Burnt Store Village. Built in 2023 and enhanced beyond builder-grade finishes, this energy-efficient, move-in-ready home offers 4 bedrooms, 2 bathrooms, and a thoughtfully designed layout that blends modern style, comfort, and functionality. Bright and inviting, the open-concept kitchen and dining area features crisp white shaker-style cabinetry with upper crown molding, sleek quartz countertops, and stainless-steel appliances. A spacious center island with bar seating anchors the space, complete with dishwasher and upgraded sink with striking black gooseneck faucet. A glossy green tile backsplash, recessed lighting, and a generously size
Key facts
- Open concept kitchen
- Screened lanai
- Energy efficient
Tags
Property features AI
Finance
- Other: Total acreage less than 1/4 acre (approximately 0.22 acres); Lot dimensions: 93 x 108 x 83 x 108; Roads are public and maintained; Solar energy generation present
- HOA & community: Located in Burnt Store Village association; Association recreation owned; Park and playground on site; Monthly HOA approximately $20.83 (annual fee $250); Association fee required; Pets allowed
Exterior
- Parking: Attached 2-car garage (20 x 20); Covered parking; Driveway; Garage door opener
- Security: Security system; Smoke detectors
- Utilities: Public water; Public sewer; Electricity connected; Cable available; Phone available; BB/HS internet available; Sewer connected; Water connected
- Home design: Single family residence; One story; Faces northeast; Homestead exempt
- Construction: Block and stucco construction; Shingle roof; Slab foundation; Built as single-level
- Exterior features: Patio (screened); Exterior lighting; Rain gutters; Sliding doors; Mature landscaping; Cleared, landscaped and paved lot; Irrigation equipment
Interior
- Kitchen: Dishwasher; Range; Microwave; Refrigerator; Stone counters; Eat-in kitchen
- Bedrooms: 4 bedrooms (one-level home)
- Flooring: Carpet; Tile
- Bathrooms: 2 full bathrooms
- Heating & cooling: Central heating (electric); Central air
- Interior features: Ceiling fans; Eat-in kitchen; Living room/dining room combo; Open floorplan; Split bedroom layout; Stone counters; Thermostat; Walk-in closets; Window treatments; Blinds
- Laundry & utility: Inside laundry room; Washer; Dryer; Inside utility
Neighborhood map
What this means for you Summary
Snapshot
- This is a 4-bed/2.0-bath land listed at $335k.
Deal economics
- At list price, monthly cash flow is $-290 ($-3k/yr) — negative.
- To cash-flow at today's rent, offer at most $284k (15.3% below list).
- To meet the 1% rule (rent ≥ 1% of price), the offer needs to be $250k (25.3% below list).
- Recommended offer: $250k (25.3% below list) — sets the bar for 1% rule.
Location & tenants
- Location reads 72/100 on livability (#354 in FL) — a middle-class / working-renter tenant base. Strengths: crime A+, employment A+, housing A+; Watch: cost of living C-, amenities F, commute F.
- Charlotte (suburban): math 54% / reading 54% proficiency, ranked #22 of 73 in FL (top 30%) — acceptable for families but not a draw, mixed tenant base, ~2y average lease.
- Zoned schools: East Elementary School (math 67% / reading 68%, grade B+, #435 of 2,144 statewide, top 21%, 761 students, 52% FRL); Charlotte High School (math 44% / reading 46%, grade D-, #228 of 667 statewide, top 35%, 1,994 students, 41% FRL).
- Market conditions: 1481 active listings in the ZIP; 12 comparable units currently listed for rent nearby; rentals at typical pace (median 22d on market — plan ~3-4 weeks tenant-placement turnaround); solid renter incomes; 4,585 units permitted in Charlotte County in 2024 (703 in 5+ unit buildings).
- This rent runs 39% of the median local income ($77k/yr) — at the standard rent-burdened threshold; future hikes will face affordability resistance.
Forward outlook
- Local home prices are declining (-3.0%/yr); year-one equity from $2k of loan paydown is wiped out by about $10k of value loss. Plan a longer hold.
- Charlotte County population projected at +24% by 2050 — long-run rental-demand tailwind backs the buy-and-hold thesis.
Negotiation context
- It's been on market 86 days — a 6% lower offer ($315k) is reasonable based on typical stale-listing flexibility.
- 9 sale attempts since 11y ago with the ask held roughly flat each time — persistent listings suggest the price (not the market) is what's stuck; bring a comps-based counter.
Risks & watch-outs
- Climate carrying-cost: major flood risk; severe wind risk, 99% chance of damaging wind over 30y; moderate wildfire risk; extreme-heat days projected 7→29/yr by 2055 (HVAC capex compounding) — expect insurance premiums to compound above CPI over the hold.
Questions for the listing agent
- What do current leases actually rent for vs. the listed asking? Can we see a recent rent roll and the last 12 months of T-12 income?
- It's been on market 86 days. Have you received any prior offers? Is the seller open to a 25% concession, seller financing, or rate buy-down credit?
- What does the HOA fee cover, when was the last increase, and are there any pending special assessments or reserve-fund shortfalls?
- Why hasn't it sold? Are there any deal-killer items the seller is aware of (foundation, flood, title, zoning, code violations)?
- Is there a deadline driving the sale (1031 exchange, divorce, estate, relocation)? That informs how much negotiation room exists.
- The area grade is low — what's the realistic commute time and amenity access for the typical tenant pool here? Any planned neighborhood developments (good or bad) we should know about?
- What's the average days-on-market for RENTAL listings here right now (not sales)? A rising rental-DOM trend means longer vacancies and softer asking-rent achievability than the comps imply.
- What's the recent tenant-quality profile in this submarket — average credit score on applications, eviction rate, late-payment / NSF rate, and stable-employment percentage? A property-management company in the area should have these aggregated.
- How much new for-sale + rental construction is in the pipeline within 1–3 miles? Heavy new supply typically softens prices + rents 12–24 months out; constrained supply supports both.
Investment metrics
- 1% rule
- 0.75% ✗
- Cap rate
- 5.25%
- Cash-on-cash
- -3.71%
- DSCR
- 0.83
- GRM
- 11.1
CMA / ARV
No comps found within radius.
Projected returns pro-forma
-3.0% appreciation · 3.0% rent growth · sell at horizon
- IRR
- -22.5%
- Equity multiple
- 0.22×
- Total profit
- $-72,738
- Equity at exit
- $49,950
- IRR
- -16.7%
- Equity multiple
- 0.07×
- Total profit
- $-87,075
- Equity at exit
- $28,965
Cash invested: $93,800 (down + closing). Projections, not guarantees.
Landlord ↔ Tenant lean methodology
- Overall (STATE)
- 87 Strongly Landlord-Friendly
- State Florida
- 87 Strongly Landlord-Friendly · R+3
- County
- — inherits STATE
- City
- — inherits STATE
ZIP-level market 33955
- Home prices YoY
- -24.5%
- Active inventory
- 1481
- Price-to-rent
- 11.1×
Monthly cashflow live
- Estimated rent
- $2,504 high interval (Pro) →
- Mortgage (P&I)
- −$1,757
- Tax from tax record
- −$352 /mo · $4,221/yr
- Insurance
- −$140
- HOA
- −$20
- Vacancy / Maint / Mgmt
- −$526
- Net cashflow
- $-290
Break-even live
Sensitivity live
| Price | -10% $-100 | -5% $-195 | +0% $-290 | +5% $-385 | +10% $-480 |
|---|---|---|---|---|---|
| Rent | -10% $-488 | -5% $-389 | +0% $-290 | +5% $-191 | +10% $-92 |
| Rate | -1.0pp $-121 | -0.5pp $-205 | base $-290 | +0.5pp $-377 | +1.0pp $-465 |
UW: 25.0% down · 7.5% · 30yr · 1.5% tax · 5.0% vac · 8.0% maint · 8.0% mgmt
Financing live
Cash to close
- Down payment
- $83,750
- Closing costs
- $10,050
- Reserves months
- —
- Total cash needed
- —
Loan-product check · same deal, 3 products live
Conventional
25% down · 7.5% · 30yr
- Down + closing
- —
- Monthly P&I
- —
- Monthly cashflow
- —
- DSCR
- —
- Eligible?
- —
Personal DTI + credit; lowest rate.
DSCR
20% down · 8.5% · 30yr
- Down + closing
- —
- Monthly P&I
- —
- Monthly cashflow
- —
- DSCR
- —
- Eligible?
- —
No personal income docs; deal must DSCR.
Hard money
10% down · 12.0% · 12mo
- Down + closing
- —
- Monthly P&I
- —
- Monthly cashflow
- —
- DSCR
- —
- Eligible?
- —
Short-term bridge; refi at stabilization.
Rent comps 12 comps
| Address | Beds | Baths | Sqft | Rent | $/sqft | DOM | Units | Dist |
|---|---|---|---|---|---|---|---|---|
| 25214 Cadiz Dr Punta Gorda, FL | 4.0 | 2.0 | 1828 | $2,295 | $1.26 | 21d | 1 | 0.15mi |
| 25222 Cadiz Dr Punta Gorda, FL | 4.0 | 2.0 | 1828 | $2,295 | $1.26 | 21d | 1 | 0.17mi |
| 16107 Badalona Dr Punta Gorda, FL | 3.0 | 2.0 | 1508 | $1,895 | $1.26 | 21d | 1 | 0.25mi |
| 16077 Badalona Dr Punta Gorda, FL | 3.0 | 2.0 | 1508 | $1,895 | $1.26 | 21d | 1 | 0.30mi |
| 25186 Alicante Dr Punta Gorda, FL | 4.0 | 2.0 | 1717 | $2,095 | $1.22 | 21d | 1 | 0.40mi |
| 16229 Cape Horn Blvd Punta Gorda, FL | 3.0 | 2.0 | 1726 | $2,749 | $1.59 | 21d | 1 | 0.43mi |
| 24378 Belize Ct Punta Gorda, FL | 4.0 | 2.5 | 2251 | $6,750 | $3.00 | 21d | 1 | 0.55mi |
| 25377 Doredo Dr Punta Gorda, FL | 4.0 | 3.0 | 2092 | $2,300 | $1.10 | 21d | 1 | 0.60mi |
| 16195 Maya Cir Punta Gorda, FL | 4.0 | 2.0 | 2077 | $2,495 | $1.20 | 14d | 1 | 0.68mi |
| 25904 Prada Dr Punta Gorda, FL | 3.0 | 2.0 | 1950 | $2,111 | $1.08 | 14d | 1 | 0.74mi |
| 17314 Cape Horn Blvd Punta Gorda, FL | 3.0 | 2.0 | 2216 | $2,800 | $1.26 | 14d | 1 | 1.40mi |
| 14897 Cherry Blossom Way Punta Gorda, FL | 3.0 | 2.0 | 2046 | $9,000 | $4.40 | 21d | 1 | 1.48mi |
HOA detail
- Monthly dues
- $20 · $240/yr
Listing history 46 events
-
2026-06-18days on market $335,000 Active 86 DOM
-
2026-06-17days on market $335,000 Active 85 DOM
-
2026-06-16days on market $335,000 Active 84 DOM
-
2026-06-15days on market $335,000 Active 83 DOM
-
2026-06-14days on market $335,000 Active 81 DOM
-
2026-06-13days on market $335,000 Active 80 DOM
-
2026-06-10days on market $335,000 Active 78 DOM
-
2026-06-09days on market $335,000 Active 77 DOM
-
2026-06-08days on market $335,000 Active 76 DOM
-
2026-06-07days on market $335,000 Active 75 DOM
-
2026-06-05days on market $335,000 Active 72 DOM
-
2026-06-03days on market $335,000 Active 71 DOM
-
2026-06-02days on market $335,000 Active 70 DOM
-
2026-06-01days on market $335,000 Active 69 DOM
-
2026-05-31days on market $335,000 Active 68 DOM
-
2026-05-30days on market $335,000 Active 67 DOM
-
2026-03-24$335,000 Active
-
2025-11-30historical
-
2025-07-29price $329,000
-
2025-06-05$339,900 Active
-
2025-05-31historical
-
2025-04-04price $339,900
-
2025-01-10price $344,900
-
2024-10-24$354,900 Active
-
2023-01-27soldstatus $339,295 Closed
-
2022-07-11status Pending
-
2022-06-29price $339,295
-
2022-06-24status Active
-
2022-06-13status Pending
-
2022-06-08$353,295 Active
-
2022-02-18soldstatus $27,500 Closed
-
2022-02-18soldstatus $55,000
-
2021-09-07status Pending
-
2021-08-19$24,900 Active
-
2021-08-18soldstatus $39,900
-
2017-04-18historical
-
2017-04-18historical
-
2017-01-14$9,900 Active
-
2017-01-13$9,900 Active
-
2015-12-29$7,500
-
2015-10-22soldstatus $12,800
-
2015-07-24soldstatus $110,200
-
2015-07-24soldstatus $56,300
-
2004-02-24soldstatus $20,900
-
1996-02-02soldstatus $8,000
-
1989-04-01soldstatus $5,000
ⓘ Source: listings_history table (triggers on properties + properties_extension) + one-shot
backfill from property_details.listing_events for pre-trigger history.
Tax reassessment forecast FL · Resets to sale price
- Current annual tax
- $4,221 · $352/mo
- Projected year-2 tax
- $4,221 · $352/mo
- Expected delta
- $0/yr ($0/mo · 0.0%)
ⓘ Screening estimate from a state-policy table — verify with the county assessor before closing.
Climate risk First Street
- Flood 6/10 Major FEMA zone D · 72% chance over 30 yrs
- Wildfire 5/10 Major
- Heat 10/10 Extreme 7 d/yr ≥107°F today · 29 d/yr by 30 yrs out
- Wind 10/10 Extreme 99% chance of damaging wind over 30 yrs
- Air quality 2/10 Low 1 unhealthy d/yr today · 2 by 30 yrs out
Nearby sold comps map
Loading sold comps map…
Walkable amenities ~0.75 mi
Loading nearby amenities…
Taxation est. · year 1
- Rental income
- $30,049
- − Mortgage interest
- −$18,765
- − Property taxes
- −$4,221
- − Insurance
- −$1,675
- − Repairs & maintenance
- −$2,404
- − Management
- −$2,404
- − HOA
- −$240
- − Depreciation
- −$9,745
- Taxable loss
- −$9,405
- Est. tax savings @ 24.0%
- +$2,257
- After-tax cash flow
- $-1,221/yr
For passive investors: Depreciation is non-cash, so a rental often shows a tax loss while cash-flowing — sheltering income. Rental losses are passive: they offset passive income freely, and up to $25,000/yr can offset ordinary (W-2) income if you actively participate and your MAGI is under $100k (phasing out to $0 by $150k); unused losses carry forward. On sale, claimed depreciation is recaptured at up to 25%, and gains may owe capital-gains tax (a 1031 exchange can defer both). Figures are a year-1 estimate at your 24.0% rate — not tax advice; consult a CPA.
Schools (NCES district)
- District
- Charlotte
- NCES district ID
- 1200240
- Math proficiency
- 54% ▼ -6.00%
- Reading proficiency
- 54% ▼ -1.00%
- Median HH income
- $44,864
- Composite
- 45.62/100
- National rank
- #2586
- State rank
- #22 of 73 in FL
Livability — Burnt Store Marina
- Score
- 72/100
- State rank
- #354
- US rank
- #6145
Category grades
Schools grade is shown separately in the Schools card above.
Census & demographics
- County
- Charlotte County · 196,994 people
- Metro
- Punta Gorda, FL
- Population (ZIP)
- 12,399
- Household income
- $76,943
- Rent vs Own
- Severe rent burden
- 226.0
Population outlook (Charlotte County) Hauer SSP2
- Today (2025)
- 198,646 people
- By 2030
- 210,507 · +6.0%
- By 2040
- 230,857 · +16.2%
- By 2050
- 247,148 · +24.4%
- By 2075
- 281,777 · +41.8%
- By 2100
- 293,609 · +47.8%
Race, ethnicity, and origin ACS 2023
- Neighborhood character
- Predominantly White (84%)
- Race & ethnicity
- White 84% Hispanic / Latino 10% Two or more races 9% Black 2%
- Hispanic origin (detail)
- Mexican 4% Puerto Rican 2% Cuban 4%
- Common ancestry
- Romanian 5% Italian 3% Serbian 3%
- Foreign-born
- 8% · Canada
- Languages at home
- 91% English-only · Spanish 5% Other Indo-European 1%
Political lean MEDSL · Charlotte
- 2024 margin
- Solid R (+34.0) · D 32.7% · R 66.7%
- 2008→2024 swing
- -26.7pp toward R · 2008: -7.2pp · 2024: -34.0pp
- All cycles
- 2024: R+34.0 2020: R+26.6 2016: R+27.8 2012: R+14.3 2008: R+7.2
Not yet ingested
- Civics
- —
Market trends
- HPI YoY
- ▼ -78.71%
- Current HPI
- 242.9043
- Rent YoY
- —
- Metro
- Punta Gorda, FL
- State GDP YoY
- ▲ 3.28%
- F500 in state
- 36
Industry mix (Fortune 500 HQ in FL)
| Industry | F500 HQs | Revenue |
|---|---|---|
| Industrial Technology | 2 | $29B |
|
||
| Insurance | 2 | $17B |
|
||
| Retail | 1 | $60B |
|
||
| Technology Distribution | 1 | $58B |
|
||
| Homebuilding | 1 | $35B |
|
||
| Technology Manufacturing | 1 | $35B |
|
||
Price history
+6600.0% since first listed30 events — show timeline
- 2026-03-24 Listed $335,000 Stellar MLS as Distributed by MLS Grid
- 2025-11-30 Listing Removed — Stellar MLS as Distributed by MLS Grid
- 2025-07-29 Price Changed $329,000 Stellar MLS as Distributed by MLS Grid
- 2025-06-05 Listed $339,900 Stellar MLS as Distributed by MLS Grid
- 2025-05-31 Listing Removed — Stellar MLS as Distributed by MLS Grid
- 2025-04-04 Price Changed $339,900 Stellar MLS as Distributed by MLS Grid
- 2025-01-10 Price Changed $344,900 Stellar MLS as Distributed by MLS Grid
- 2024-10-24 Listed $354,900 Stellar MLS as Distributed by MLS Grid
- 2023-01-27 Sold (MLS) $339,295 Stellar MLS as Distributed by MLS Grid
- 2022-07-11 Pending — Stellar MLS as Distributed by MLS Grid
- 2022-06-29 Price Changed $339,295 Stellar MLS as Distributed by MLS Grid
- 2022-06-24 Relisted — Stellar MLS as Distributed by MLS Grid
- 2022-06-13 Pending — Stellar MLS as Distributed by MLS Grid
- 2022-06-08 Listed $353,295 Stellar MLS as Distributed by MLS Grid
- 2022-02-18 Sold (Public Records) $55,000 Public Records
- 2022-02-18 Sold (MLS) $27,500 FORTMLS
- 2021-09-07 Pending — FORTMLS
- 2021-08-19 Listed $24,900 FORTMLS
- 2021-08-18 Sold (Public Records) $39,900 Public Records
- 2017-04-18 Listing Removed — FORTMLS
- 2017-04-18 Listing Removed — Stellar MLS as Distributed by MLS Grid
- 2017-01-14 Listed $9,900 Stellar MLS as Distributed by MLS Grid
- 2017-01-13 Listed $9,900 FORTMLS
- 2015-12-29 Listed $7,500 Stellar MLS as Distributed by MLS Grid
- 2015-10-22 Sold (Public Records) $12,800 Public Records
- 2015-07-24 Sold (Public Records) $56,300 Public Records
- 2015-07-24 Sold (Public Records) $110,200 Public Records
- 2004-02-24 Sold (Public Records) $20,900 Public Records
- 1996-02-02 Sold (Public Records) $8,000 Public Records
- 1989-04-01 Sold (Public Records) $5,000 Public Records
Property tax history
+22.2%/yrLatest (2025): $4,221 · -5.3% YoY. Source: county tax records.
Cash-flow waterfall
monthlySold comps — $/sqft
last 12 mo · ≤1 miLoading sold comps…