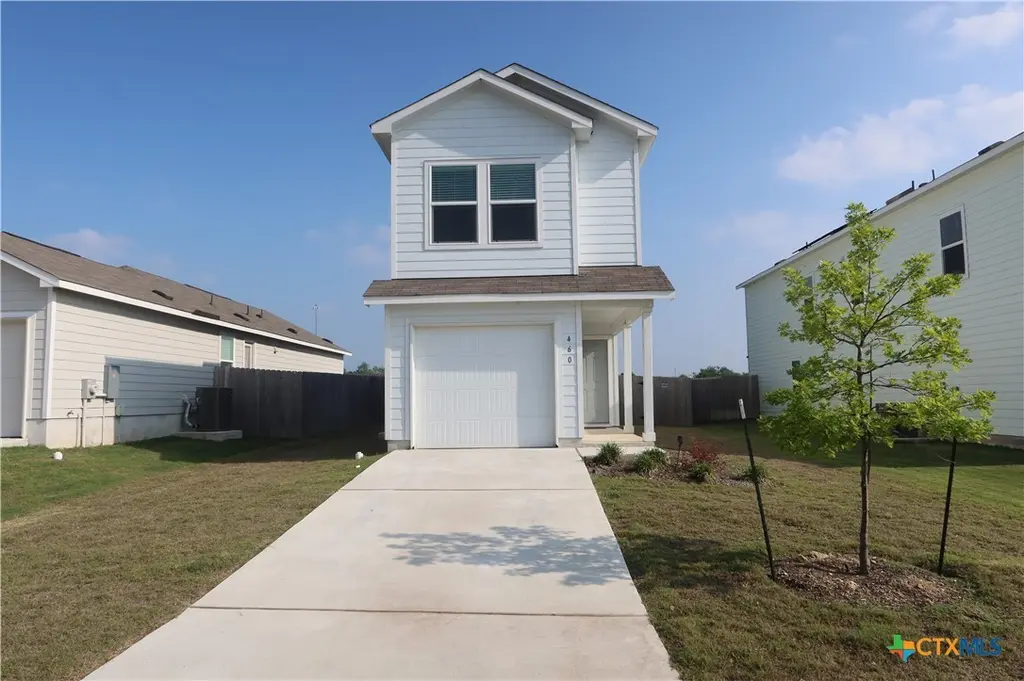
460 Marty Allen Loop · Jarrell, TX
Flood risk No data
- FEMA flood zone
- —
- Chance of flooding over 30 yrs
- —
- Est. flood insurance / yr
- —
Fire risk No data
- Est. fire insurance / yr
- —
Heat risk No data
- Hot days now (above threshold)
- —
- Hot days in 30 yrs
- —
Wind risk No data
- Chance of severe wind over 30 yrs
- —
Air-quality risk No data
- Unhealthy air days now
- —
- Unhealthy air days in 30 yrs
- —
Risk factors via First Street. Map © Google.
Why this score? — see what drove the D+ grade
The composite is a weighted blend of 9 inputs, each scored 0–100. Each bar is that input's sub-score; the figure is the points it added to the 100-point composite (weight × sub-score).
- ARV discount +15.0/15.0
- Cash flow +13.6/30.0
- 1% rule +5.2/10.0
- DSCR +4.1/10.0
- Condition / age +4.0/5.0
- Livability +3.6/5.0
- Rent growth +2.1/5.0
- Schools +2.1/10.0
- Appreciation +0.0/10.0
$186,000
🖨 Deal sheet (PDF) 📄 Offer letter ✓ Due diligence
Listing remarks
Welcome to a well-maintained 2-story home that's just right! This gem features an open floorplan with the living area and kitchen on the main floor. All bedrooms are on the upper level and are carpeted. The main bedroom features a bathroom and walk-in closet.
Key facts
- 4,403 sq ft lot
- Garage
- Built 2023
Property features AI
Finance
- HOA & community: Part of Cielo Gardens HOA
Exterior
- Parking: Garage with 1 car space
- Utilities: Electricity available; Public water
- Home design: Two-story home; HardiPlank-type exterior
- Construction: Shingle/composition roof; Slab foundation; Built (year source: assessor)
- Exterior features: Back yard with wood fencing; Asphalt road access; City lot, less than quarter acre
Interior
- Kitchen: Electric range; Range; Microwave; Dishwasher; Some electric appliances
- Bedrooms: Three bedrooms on the upper level
- Flooring: Carpet; Luxury vinyl plank
- Bathrooms: Two full bathrooms; One half bathroom
- Heating & cooling: Central heating (electric); Central air (one unit)
- Interior features: All bedrooms are on the upper level; Kitchen/dining combo; Tub/shower; Vanity; Walk-in closet(s); Solid surface counters
- Laundry & utility: Stacked laundry
Neighborhood map
What this means for you Summary
Snapshot
- This is a 4-bed/2.5-bath single-family listed at $186k. Condition is rated good.
Deal economics
- At list price, monthly cash flow is $9 ($103/yr) — positive.
- The deal already cash-flows at list — no discount required.
- Meets the 1% rule at list price ($2k rent vs $186k).
- Recommended offer: $183k (1.5% below list) — sets the bar for market timing.
- Cap rate 6.3% vs local median 4.7% in Jarrell — top-decile yield for the area; either an underpriced asset or a hidden risk that comps aren't pricing in. Stress-test before assuming the spread holds.
Location & tenants
- Location reads 71/100 on livability (#313 in TX) — a middle-class / working-renter tenant base. Strengths: employment A+, housing A+, crime A; Watch: amenities F, commute F.
- Jarrell ISD (rural): math 19% / reading 28% proficiency, ranked #713 of 826 in TX (top 86%) — low school quality limits family demand, transient renter base, plan for 1-2y turnover.
- Zoned schools: Jarrell El (math 19% / reading 27%, grade F, #3,277 of 4,322 statewide, top 77%, 785 students, 62% FRL); Jarrell Middle (math 21% / reading 29%, grade F, #1,258 of 1,662 statewide, top 77%, 741 students, 64% FRL); Jarrell H S (math 22% / reading 37%, grade F, #1,112 of 1,632 statewide, top 70%, 868 students, 58% FRL).
- Market conditions: Rents soft (-1.7%/yr); 773 active listings in the ZIP; 40 comparable units currently listed for rent nearby; rentals at typical pace (median 18d on market — plan ~3-4 weeks tenant-placement turnaround); solid renter incomes; 7,543 units permitted in Williamson County in 2024 (1,425 in 5+ unit buildings).
Forward outlook
- Local home prices are declining (-3.0%/yr); year-one equity from $1k of loan paydown is wiped out by about $6k of value loss. Plan a longer hold.
- Williamson County population projected at +69% by 2050 — long-run rental-demand tailwind backs the buy-and-hold thesis.
Negotiation context
- It's been on market 17 days — a 2% lower offer ($183k) is reasonable based on typical stale-listing flexibility.
- 3 sale attempts with the ask held roughly flat each time — persistent listings suggest the price (not the market) is what's stuck; bring a comps-based counter.
Risks & watch-outs
- Watch-outs: property tax is 2.8% of price.
Questions for the listing agent
- Property tax is high relative to price — has the assessment been appealed recently, and will the sale trigger a re-assessment?
- Is there a deadline driving the sale (1031 exchange, divorce, estate, relocation)? That informs how much negotiation room exists.
- Schools are F-rated, which usually means shorter tenancies and higher turnover. Who's the typical renter profile here, and what's been the actual vacancy rate?
- The area grade is low — what's the realistic commute time and amenity access for the typical tenant pool here? Any planned neighborhood developments (good or bad) we should know about?
- What's the average days-on-market for RENTAL listings here right now (not sales)? A rising rental-DOM trend means longer vacancies and softer asking-rent achievability than the comps imply.
- What's the recent tenant-quality profile in this submarket — average credit score on applications, eviction rate, late-payment / NSF rate, and stable-employment percentage? A property-management company in the area should have these aggregated.
- How much new for-sale + rental construction is in the pipeline within 1–3 miles? Heavy new supply typically softens prices + rents 12–24 months out; constrained supply supports both.
Investment metrics
- 1% rule
- 1.02% ✓
- Cap rate
- 6.35%
- Cash-on-cash
- 0.20%
- DSCR
- 1.01
- GRM
- 8.2
CMA / ARV
- ARV (on-the-fly)
- $241,956
- Comps found
- 12
Show comp detail 12 sales within ~0.75 mi
| Address | Dist | Beds/Ba | Sqft | Sold | Price | $/sf | Match |
|---|---|---|---|---|---|---|---|
| 215 Carmel Canyon Trl | 0.38mi | 3/2.5 (-1) | 1,308 (+2%) | 1mo | $249,900 | $191 | 74 |
| 132 Desert Hare Dr | 0.37mi | 3/2.5 (-1) | 1,308 (+2%) | 3mo | $245,900 | $188 | 73 |
| 207 Carmel Canyon Trl | 0.37mi | 3/2.5 (-1) | 1,308 (+2%) | 4mo | $242,900 | $186 | 72 |
| 317 Carmel Canyon Trl | 0.38mi | 3/2.5 (-1) | 1,308 (+2%) | 3mo | $245,900 | $188 | 72 |
| 208 Carmel Canyon Trl | 0.40mi | 3/2.5 (-1) | 1,308 (+2%) | 5mo | $242,900 | $186 | 70 |
| 305 Carmel Canyon Trl | 0.39mi | 3/2.5 (-1) | 1,308 (+2%) | 6mo | $242,900 | $186 | 69 |
| 140 Wirepass Crst | 0.52mi | 3/2.0 (-1) | 1,305 (+1%) | 1mo | $283,900 | $218 | 66 |
| 129 Paria Ct | 0.57mi | 3/2.0 (-1) | 1,305 (+1%) | 4mo | $279,900 | $214 | 61 |
| 313 Carmel Canyon Trl | 0.37mi | 3/2.5 (-1) | 1,413 (+10%) | 1mo | $259,900 | $184 | 61 |
| 117 Paria Ct | 0.56mi | 3/2.0 (-1) | 1,305 (+1%) | 6mo | $276,900 | $212 | 59 |
| 211 Carmel Canyon Trl | 0.38mi | 3/2.5 (-1) | 1,413 (+10%) | 3mo | $255,900 | $181 | 59 |
| 204 Carmel Canyon Trl | 0.39mi | 3/2.5 (-1) | 1,413 (+10%) | 6mo | $252,900 | $179 | 56 |
Match score weights: distance 35% · size 25% · config 20% · recency 20%. Top-matched comps best support the ARV.
Projected returns pro-forma
-3.0% appreciation · 0.0% rent growth · sell at horizon
- IRR
- -19.9%
- Equity multiple
- 0.33×
- Total profit
- $-34,982
- Equity at exit
- $27,733
- IRR
- -22.7%
- Equity multiple
- 0.03×
- Total profit
- $-50,550
- Equity at exit
- $16,082
Cash invested: $52,080 (down + closing). Projections, not guarantees.
Landlord ↔ Tenant lean methodology
- Overall (STATE)
- 87 Strongly Landlord-Friendly
- State Texas
- 87 Strongly Landlord-Friendly · R+5
- County
- — inherits STATE
- City
- — inherits STATE
ZIP-level market 76537
- Home prices YoY
- -14.4%
- Rents YoY
- -1.7%
- Active inventory
- 773
- Price-to-rent
- 8.2×
Monthly cashflow live
- Estimated rent
- $1,890 high interval (Pro) →
- Mortgage (P&I)
- −$975
- Tax from tax record
- −$432 /mo · $5,178/yr
- Insurance
- −$78
- HOA
- −$0
- Vacancy / Maint / Mgmt
- −$397
- Net cashflow
- $9
Break-even live
Sensitivity live
| Price | -10% $114 | -5% $61 | +0% $9 | +5% $-44 | +10% $-97 |
|---|---|---|---|---|---|
| Rent | -10% $-141 | -5% $-66 | +0% $9 | +5% $83 | +10% $158 |
| Rate | -1.0pp $102 | -0.5pp $56 | base $9 | +0.5pp $-40 | +1.0pp $-89 |
UW: 25.0% down · 7.5% · 30yr · 1.5% tax · 5.0% vac · 8.0% maint · 8.0% mgmt
Financing live
Cash to close
- Down payment
- $46,500
- Closing costs
- $5,580
- Reserves months
- —
- Total cash needed
- —
Loan-product check · same deal, 3 products live
Conventional
25% down · 7.5% · 30yr
- Down + closing
- —
- Monthly P&I
- —
- Monthly cashflow
- —
- DSCR
- —
- Eligible?
- —
Personal DTI + credit; lowest rate.
DSCR
20% down · 8.5% · 30yr
- Down + closing
- —
- Monthly P&I
- —
- Monthly cashflow
- —
- DSCR
- —
- Eligible?
- —
No personal income docs; deal must DSCR.
Hard money
10% down · 12.0% · 12mo
- Down + closing
- —
- Monthly P&I
- —
- Monthly cashflow
- —
- DSCR
- —
- Eligible?
- —
Short-term bridge; refi at stabilization.
Rent comps 40 comps
| Address | Beds | Baths | Sqft | Rent | $/sqft | DOM | Units | Dist |
|---|---|---|---|---|---|---|---|---|
| 451 Marty Allen Loop Jarrell, TX | 3.0 | 2.0 | 1300 | $1,750 | $1.35 | 14d | 1 | 0.02mi |
| 704 Commander Abbott Dr Jarrell, TX | 4.0 | 2.5 | 1625 | $1,550 | $0.95 | 45d | 1 | 0.05mi |
| 604 Marty Allen Loop Jarrell, TX | 3.0 | 2.0 | 1300 | $1,575 | $1.21 | 14d | 1 | 0.10mi |
| 344 Marty Allen Loop Jarrell, TX | 3.0 | 2.0 | 1360 | $1,595 | $1.17 | 14d | 1 | 0.12mi |
| 583 Commander Abbott Dr Jarrell, TX | 3.0 | 2.0 | 1125 | $1,595 | $1.42 | 45d | 1 | 0.15mi |
| 309 Marty Allen Loop Jarrell, TX | 3.0 | 2.5 | 1286 | $1,545 | $1.20 | 14d | 1 | 0.16mi |
| 212 Marty Allen Loop Jarrell, TX | 3.0 | 2.0 | 1400 | $1,750 | $1.25 | 14d | 1 | 0.20mi |
| 128 Desert Hare Dr Jarrell, TX | 3.0 | 2.5 | 1413 | $1,940 | $1.37 | 18d | 1 | 0.36mi |
| 101 W Luna Blue Ln Jarrell, TX | 2.0–4.0 | 2.0–3.0 | 1906 | $3,710 | $1.95 | 0d | 1 | 0.44mi |
| 509 Scarborough Cv Jarrell, TX | 3.0 | 2.0 | 1525 | $1,895 | $1.24 | 14d | 1 | 0.94mi |
| 152 Scarborough Bnd Jarrell, TX | 3.0 | 2.0 | 1347 | $1,545 | $1.15 | 45d | 1 | 0.95mi |
| 520 Locksley Cv Jarrell, TX | 4.0 | 2.0 | 1803 | $1,850 | $1.03 | 19d | 1 | 0.96mi |
| 225 Wincanton Ln Jarrell, TX | 4.0 | 2.0 | 1794 | $1,645 | $0.92 | 25d | 1 | 0.98mi |
| 364 Crescent Park Dr Jarrell, TX | 4.0 | 2.0 | 1794 | $1,895 | $1.06 | 6d | 1 | 0.99mi |
| 113 Sunnymeade Ln Jarrell, TX | 3.0 | 2.5 | 1428 | $1,650 | $1.16 | 0d | 1 | 1.00mi |
| 116 Somerdale Pass Jarrell, TX | 4.0 | 2.0 | 1794 | $1,645 | $0.92 | 23d | 1 | 1.00mi |
| 100 Stratton Ln Jarrell, TX | 3.0 | 2.5 | 1438 | $1,630 | $1.13 | 25d | 1 | 1.00mi |
| 217 Sunnymeade Ln Jarrell, TX | 4.0 | 2.0 | 1794 | $1,695 | $0.94 | 0d | 1 | 1.03mi |
| 132 Somerdale Pass Jarrell, TX | 3.0 | 2.5 | 1438 | $1,630 | $1.13 | 5d | 1 | 1.03mi |
| 117 Stratton Ln Jarrell, TX | 3.0 | 2.5 | 1436 | $1,630 | $1.14 | 19d | 1 | 1.05mi |
| 132 Stratton Ln Jarrell, TX | 3.0 | 2.5 | 1438 | $1,630 | $1.13 | 19d | 1 | 1.06mi |
| 220 Crescent Park Dr Jarrell, TX | 3.0 | 2.5 | 1438 | $1,630 | $1.13 | 6d | 1 | 1.07mi |
| 217 Riverdale Dr Jarrell, TX | 4.0 | 2.0 | 1794 | $1,645 | $0.92 | 45d | 1 | 1.07mi |
| 309 Riverdale Dr Jarrell, TX | 3.0 | 2.0 | 1536 | $1,650 | $1.07 | 0d | 1 | 1.10mi |
| 101 Fairfax Ln Jarrell, TX | 4.0 | 2.0 | 1794 | $1,850 | $1.03 | 14d | 1 | 1.10mi |
| 313 Riverdale Dr Jarrell, TX | 3.0 | 2.5 | 1428 | $1,500 | $1.05 | 19d | 1 | 1.10mi |
| 329 Sunnymeade Ln Jarrell, TX | 3.0 | 2.0 | 1525 | $1,595 | $1.05 | 19d | 1 | 1.10mi |
| 604 Double Vision Rd Jarrell, TX | 4.0 | 2.0 | 1644 | $1,795 | $1.09 | 15d | 1 | 1.12mi |
| 604 Double Vision Rd Jarrell, TX | 4.0 | 2.0 | 1644 | $1,795 | $1.09 | 21d | 1 | 1.12mi |
| 100 Bailey Kay Ct Unit B Jarrell, TX | 3.0 | 2.0 | 1527 | $1,600 | $1.05 | 45d | 1 | 1.12mi |
| 108 Allington Cir Jarrell, TX | 4.0 | 2.0 | 1794 | $1,750 | $0.98 | 3d | 1 | 1.12mi |
| 405 Riverdale Dr Jarrell, TX | 3.0 | 2.5 | 1428 | $1,550 | $1.09 | 25d | 1 | 1.12mi |
| 341 Sunnymeade Ln Jarrell, TX | 3.0 | 2.0 | 1525 | $1,595 | $1.05 | 14d | 1 | 1.13mi |
| 109 Everett Ct Unit B Jarrell, TX | 3.0 | 2.0 | 1527 | $1,700 | $1.11 | 6d | 1 | 1.13mi |
| 136 Maywood Ln Jarrell, TX | 4.0 | 2.0 | 1794 | $1,725 | $0.96 | 4d | 1 | 1.13mi |
| 100 Everett Ct Unit B Jarrell, TX | 3.0 | 2.0 | 1528 | $1,600 | $1.05 | 45d | 1 | 1.14mi |
| 105 Everett Ct Unit B Jarrell, TX | 3.0 | 2.0 | 1528 | $1,650 | $1.08 | 45d | 1 | 1.15mi |
| 121 Maybelline Rd Jarrell, TX | 4.0 | 2.0 | 1644 | $1,800 | $1.09 | 14d | 1 | 1.17mi |
| 313 Riverdale Cv Jarrell, TX | 3.0 | 2.5 | 1428 | $1,500 | $1.05 | 25d | 1 | 1.19mi |
| 111 Stockton Family Ct Jarrell, TX | 3.0 | 2.0 | 1319 | $1,500 | $1.14 | 23d | 1 | 1.19mi |
Listing history 10 events
-
2026-06-21days on market $186,000 Active 17 DOM
-
2026-06-18days on market $186,000 Active 14 DOM
-
2026-06-17days on market $186,000 Active 13 DOM
-
2026-06-16days on market $186,000 Active 12 DOM
-
2026-06-15days on market $186,000 Active 11 DOM
-
2026-06-13days on market $186,000 Active 9 DOM
-
2026-06-09days on market $186,000 Active 5 DOM
-
2026-06-08days on market $186,000 Active 4 DOM
-
2026-06-07remarks 259-char remark
-
2026-06-07$186,000 Active 3 DOM
ⓘ Source: listings_history table (triggers on properties + properties_extension) + one-shot
backfill from property_details.listing_events for pre-trigger history.
Tax reassessment forecast TX · Resets to sale price
- Current annual tax
- $5,178 · $432/mo
- Projected year-2 tax
- $5,178 · $432/mo
- Expected delta
- $0/yr ($0/mo · 0.0%)
ⓘ Screening estimate from a state-policy table — verify with the county assessor before closing.
Nearby sold comps map
Loading sold comps map…
Walkable amenities ~0.75 mi
Loading nearby amenities…
Taxation est. · year 1
- Rental income
- $22,678
- − Mortgage interest
- −$10,419
- − Property taxes
- −$5,178
- − Insurance
- −$930
- − Repairs & maintenance
- −$1,814
- − Management
- −$1,814
- − Depreciation
- −$5,411
- Taxable loss
- −$2,888
- Est. tax savings @ 24.0%
- +$693
- After-tax cash flow
- $796/yr
For passive investors: Depreciation is non-cash, so a rental often shows a tax loss while cash-flowing — sheltering income. Rental losses are passive: they offset passive income freely, and up to $25,000/yr can offset ordinary (W-2) income if you actively participate and your MAGI is under $100k (phasing out to $0 by $150k); unused losses carry forward. On sale, claimed depreciation is recaptured at up to 25%, and gains may owe capital-gains tax (a 1031 exchange can defer both). Figures are a year-1 estimate at your 24.0% rate — not tax advice; consult a CPA.
Condition & rehab AI · 11 photos
This well-maintained 2-story home features an open floorplan and is ready for immediate move-in. Minor updates to the exterior trim and blinds would further enhance its curb appeal and value.
Value-add opportunities
- Both Paint exterior trim — Enhances curb appeal and value
- Both Replace blinds — Improves natural light and aesthetics
Renovation cost estimate screening
Value-add ROI direction
- Both Paint exterior trim — Enhances curb appeal and value ↑
- Both Replace blinds — Improves natural light and aesthetics ↑
ⓘ Cost ranges are severity-bucket heuristics (US national rule-of-thumb). Get contractor quotes + a written scope before underwriting a rehab budget.
Schools (NCES district)
- District
- Jarrell ISD
- NCES district ID
- 4824600
- Math proficiency
- 19% ▼ -18.00%
- Reading proficiency
- 28% ▼ -5.00%
- Median HH income
- $57,132
- Composite
- 21.47/100
- National rank
- #8335
- State rank
- #713 of 826 in TX
Livability — Jarrell
- Score
- 71/100
- State rank
- #313
- US rank
- #7020
Category grades
Schools grade is shown separately in the Schools card above.
Census & demographics
- County
- Williamson County · 680,029 people
- City population
- 16,272
- Metro
- Austin-Round Rock-Georgetown, TX
- Population (ZIP)
- 16,272
- Household income
- $98,199
- Rent vs Own
- Severe rent burden
- 225.0
Population outlook (Williamson County) Hauer SSP2
- Today (2025)
- 699,027 people
- By 2030
- 795,537 · +13.8%
- By 2040
- 990,683 · +41.7%
- By 2050
- 1,184,292 · +69.4%
- By 2075
- 1,623,825 · +132.3%
- By 2100
- 1,924,153 · +175.3%
Race, ethnicity, and origin ACS 2023
- Neighborhood character
- Diverse neighborhood (Simpson 0.63)
- Race & ethnicity
- White 48% Hispanic / Latino 36% Two or more races 14% Black 7% Asian 4%
- Hispanic origin (detail)
- Mexican 30% Puerto Rican 5%
- Common ancestry
- Romanian 3% Italian 2% Slovak 1%
- Foreign-born
- 13% · Canada, Vietnam
- Languages at home
- 69% English-only · Spanish 26% Chinese 2% French/Haitian/Cajun 1%
Political lean MEDSL · Williamson
- 2024 margin
- Toss-up / Even · D 48.0% · R 50.4% · Other 1.6%
- 2008→2024 swing
- +10.6pp toward D · 2008: -13.0pp · 2024: -2.5pp
- All cycles
- 2024: R+2.5 2020: D+1.4 2016: R+9.9 2012: R+21.5 2008: R+13.0
Not yet ingested
- Civics
- —
Market trends
- HPI YoY
- ▼ -31.03%
- Current HPI
- 184.8935
- Rent YoY
- ▼ -1.73%
- Metro
- Austin-Round Rock-Georgetown, TX
- State GDP YoY
- ▲ 3.95%
- F500 in state
- 110
Industry mix (Fortune 500 HQ in TX)
| Industry | F500 HQs | Revenue |
|---|---|---|
| Energy | 16 | $1,198B |
|
||
| Technology | 5 | $198B |
|
||
| Engineering / Construction | 4 | $72B |
|
||
| Energy Services | 3 | $60B |
|
||
| Utilities | 3 | $41B |
|
||
| Healthcare | 2 | $330B |
|
||
Price history
+11525.0% since first listed5 events — show timeline
- 2026-06-04 Listed $186,000 CTXMLS
- 2026-03-11 Rental Removed $1,599 ACTRIS
- 2025-10-08 Price Changed $1,599 ACTRIS
- 2025-09-11 Listed for Rent $1,600 ACTRIS
- 2025-07-23 Listed — Unlock MLS
Property tax history
+0.7%/yrLatest (2026): $5,178 · -0.2% YoY. Source: county tax records.
Cash-flow waterfall
monthlySold comps — $/sqft
last 12 mo · ≤1 miLoading sold comps…