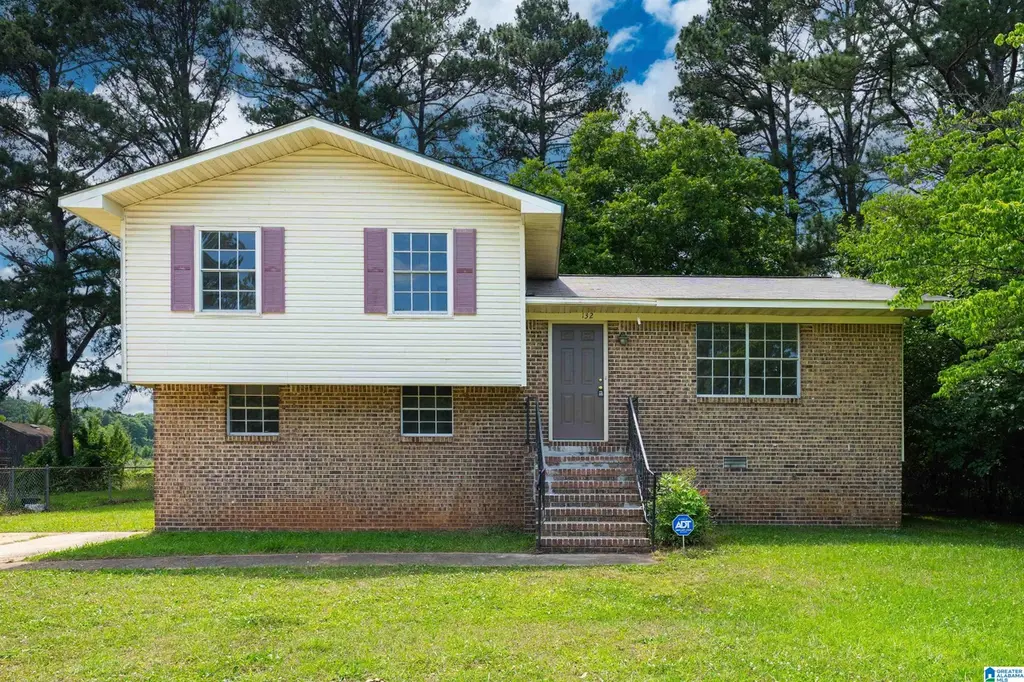
132 Greenridge Rd · Hueytown, AL
Flood risk 1/10 · Minimal
- FEMA flood zone
- X (unshaded)
- Chance of flooding over 30 yrs
- 0.0%
- Est. flood insurance / yr
- $473 – $860
Fire risk 3/10 · Minor
- Est. fire insurance / yr
- $916 – $1,700
Heat risk 6/10 · Moderate
- Hot days now (above 109°F)
- 7 days/yr
- Hot days in 30 yrs
- 19 days/yr
Wind risk 6/10 · Moderate
- Chance of severe wind over 30 yrs
- 44.0%
Air-quality risk 3/10 · Minor
- Unhealthy air days now
- 2 days/yr
- Unhealthy air days in 30 yrs
- 5 days/yr
Risk factors via First Street. Map © Google.
Why this score? — see what drove the B- grade
The composite is a weighted blend of 9 inputs, each scored 0–100. Each bar is that input's sub-score; the figure is the points it added to the 100-point composite (weight × sub-score).
- Cash flow +23.4/30.0
- ARV discount +15.0/15.0
- DSCR +7.5/10.0
- 1% rule +5.1/10.0
- Appreciation +4.7/10.0
- Rent growth +2.9/5.0
- Livability +2.9/5.0
- Condition / age +2.5/5.0
- Schools +1.8/10.0
$150,000
🖨 Deal sheet (PDF) 📄 Offer letter ✓ Due diligence
Listing remarks
This charming home offers comfortable living with a functional layout designed for everyday ease. Inside, you’ll find a bright and spacious living area filled with natural light, along with a well-appointed kitchen featuring ample cabinet and counter space. The inviting atmosphere and thoughtful updates make this home truly move-in ready while still offering the opportunity to add your own personal touch. Recent upgrades include a new roof, new HVAC system, fresh paint, updated lighting, and a new refrigerator, providing added value and peace of mind. Outside, enjoy a manageable yard perfect for relaxing, entertaining, or accommodating pets. Conveniently located near shopping, dining,
Key facts
- Fresh paint
- New refrigerator
- Updated lighting
Tags
Property features AI
Finance
- Other: Property is in the GREENRIDGE subdivision; Lot size approximately 0.25 acre
- Financial info: Quarterly garbage fee applies
- HOA & community: No association fee
Exterior
- Parking: Driveway parking; Off-street parking
- Security: Security system
- Utilities: Public water; Connected sewer; Gas water heater; Internet service available
- Home design: Brick over foundation with vinyl siding; Existing construction; Split-level property
- Construction: Basement foundation; Brick over foundation; Vinyl siding
- Exterior features: Basement foundation (daylight, partial, fully finished); No waterfront, pool, patio, decks, or garden/patio; Public road access
Interior
- Kitchen: Laminate countertops; Breakfast bar; Electric oven and stove; Refrigerator; Some stainless appliances
- Bedrooms: Three bedrooms on upper level; Additional bonus room in finished basement
- Flooring: Hardwood laminate; Tile; Vinyl
- Bathrooms: One full bathroom (upper level) with tub/shower combo
- Heating & cooling: Central heating; Central electric cooling; Ceiling fans
- Interior features: Smooth ceilings; Security system; Split level layout; Some window treatments to remain
- Laundry & utility: Washer hookup (basement); Electric dryer hookup (basement); Laundry located in basement
Neighborhood map
What this means for you Summary
Snapshot
- This is a 3-bed/1.0-bath single-family listed at $150k.
Deal economics
- At list price, monthly cash flow is $276 ($3k/yr) — positive.
- The deal already cash-flows at list — no discount required.
- Meets the 1% rule at list price ($2k rent vs $150k).
- Recommended offer: $148k (1.5% below list) — sets the bar for market timing.
- Cap rate 8.5% vs local median 5.9% in Hueytown — top-decile yield for the area; either an underpriced asset or a hidden risk that comps aren't pricing in. Stress-test before assuming the spread holds.
Location & tenants
- Location reads 57/100 on livability (#378 in AL) — a working-class tenant base; expect higher turnover. Strengths: cost of living A+, housing A+; Watch: employment D, crime F, amenities F.
- Jefferson County (suburban): math 9% / reading 32% proficiency, ranked #104 of 129 in AL (top 81%) — low school quality limits family demand, transient renter base, plan for 1-2y turnover.
- Zoned schools: Hueytown Primary School (653 students, 64% FRL); Hueytown High School (math 7% / reading 20%, grade F, #235 of 305 statewide, top 77%, 1,210 students, 79% FRL) — zoned schools average 72% FRL vs 49% district-wide (23 pts higher); higher-poverty schools than district average — tighter screening recommended.
- Market conditions: Rents rising (+1.6%/yr); 251 active listings in the ZIP; 8 comparable units currently listed for rent nearby; rentals at typical pace (median 16d on market — plan ~3-4 weeks tenant-placement turnaround); 2,114 units permitted in Jefferson County in 2024 (556 in 5+ unit buildings).
Forward outlook
- In year one you build about $137 of equity ($1k loan paydown + $-900 appreciation (-0.6% local appreciation)).
- Jefferson County population projected to shrink 4% by 2050 — rents likely to lag national; underwrite the cash flow, not the appreciation.
- At projected returns (-0.6% appreciation + 1.6% rent growth), your $42k cash investment doubles in ~10 years — after that, you're playing with house money.
Negotiation context
- It's been on market 28 days — a 2% lower offer ($148k) is reasonable based on typical stale-listing flexibility.
Risks & watch-outs
- Climate carrying-cost: major wind risk, 44% chance of damaging wind over 30y; extreme-heat days projected 7→19/yr by 2055 (HVAC capex compounding) — expect insurance premiums to compound above CPI over the hold.
Questions for the listing agent
- Built in 1974 — when were the roof, HVAC, electrical panel, plumbing, and water heater last replaced?
- Is there a deadline driving the sale (1031 exchange, divorce, estate, relocation)? That informs how much negotiation room exists.
- Schools are F-rated, which usually means shorter tenancies and higher turnover. Who's the typical renter profile here, and what's been the actual vacancy rate?
- Crime grade is F in this area — have there been break-ins, vandalism, or insurance claims at this property in the last 3 years? What carrier currently insures it and at what premium?
- What's the average days-on-market for RENTAL listings here right now (not sales)? A rising rental-DOM trend means longer vacancies and softer asking-rent achievability than the comps imply.
- What's the recent tenant-quality profile in this submarket — average credit score on applications, eviction rate, late-payment / NSF rate, and stable-employment percentage? A property-management company in the area should have these aggregated.
- How much new for-sale + rental construction is in the pipeline within 1–3 miles? Heavy new supply typically softens prices + rents 12–24 months out; constrained supply supports both.
Investment metrics
- 1% rule
- 1.01% ✓
- Cap rate
- 8.50%
- Cash-on-cash
- 7.90%
- DSCR
- 1.35
- GRM
- 8.2
CMA / ARV
- ARV (on-the-fly)
- $197,508
- Comps found
- 12
Show comp detail 12 sales within ~0.75 mi
| Address | Dist | Beds/Ba | Sqft | Sold | Price | $/sf | Match |
|---|---|---|---|---|---|---|---|
| 3879 Heritage Crest Dr | 0.09mi | 4/2.0 (+1) | 1,774 (-2%) | 2mo | $286,450 | $161 | 82 |
| 3866 Heritage Crest Dr | 0.13mi | 4/2.0 (+1) | 1,774 (-2%) | 0mo | $274,900 | $155 | 81 |
| 3858 Heritage Crest Dr | 0.14mi | 4/2.0 (+1) | 1,774 (-2%) | 1mo | $270,000 | $152 | 80 |
| 125 Greenridge Ter | 0.05mi | 3/2.0 | 1,647 (-9%) | 11mo | $160,000 | $97 | 69 |
| 106 Greenridge Ter | 0.10mi | 3/2.0 | 1,636 (-10%) | 11mo | $178,000 | $109 | 66 |
| 1048 Arcadia Cir | 0.68mi | 4/1.5 (+1) | 1,828 (+1%) | 10mo | $163,000 | $89 | 52 |
| 921 Arcadia Cir | 0.58mi | 4/2.0 (+1) | 1,850 (+2%) | 13mo | $175,000 | $95 | 50 |
| 1220 26th Ave N | 0.60mi | 4/2.0 (+1) | 1,665 (-8%) | 2mo | $195,000 | $117 | 48 |
| 1404 29th Ave N | 0.73mi | 3/2.0 | 1,847 (+2%) | 16mo | $184,900 | $100 | 46 |
| 1220 27th Ave N | 0.65mi | 3/2.0 | 1,680 (-7%) | 11mo | $162,500 | $97 | 44 |
| 1024 Rose Hill Cir | 0.62mi | 3/1.0 | 1,560 (-14%) | 8mo | $105,000 | $67 | 41 |
| 1100 Arcadia Cir | 0.70mi | 4/2.0 (+1) | 1,593 (-12%) | 11mo | $175,000 | $110 | 29 |
Match score weights: distance 35% · size 25% · config 20% · recency 20%. Top-matched comps best support the ARV.
Projected returns pro-forma
-0.6% appreciation · 1.6% rent growth · sell at horizon
- IRR
- 3.6%
- Equity multiple
- 1.16×
- Total profit
- $6,884
- Equity at exit
- $39,109
- IRR
- 8.6%
- Equity multiple
- 1.84×
- Total profit
- $35,150
- Equity at exit
- $43,595
Cash invested: $42,000 (down + closing). Projections, not guarantees.
Landlord ↔ Tenant lean methodology
- Overall (STATE)
- 90 Strongly Landlord-Friendly
- State Alabama
- 90 Strongly Landlord-Friendly · R+15
- County
- — inherits STATE
- City
- — inherits STATE
ZIP-level market 35023
- Home prices YoY
- -0.1%
- Rents YoY
- 1.6%
- Active inventory
- 251
- Price-to-rent
- 8.2×
Monthly cashflow live
- Estimated rent
- $1,516 high interval (Pro) →
- Mortgage (P&I)
- −$787
- Tax from tax record
- −$72 /mo · $867/yr
- Insurance
- −$62
- HOA
- −$0
- Vacancy / Maint / Mgmt
- −$318
- Net cashflow
- $276
Break-even live
Sensitivity live
| Price | -10% $361 | -5% $319 | +0% $276 | +5% $234 | +10% $192 |
|---|---|---|---|---|---|
| Rent | -10% $157 | -5% $217 | +0% $276 | +5% $336 | +10% $396 |
| Rate | -1.0pp $352 | -0.5pp $315 | base $276 | +0.5pp $238 | +1.0pp $198 |
UW: 25.0% down · 7.5% · 30yr · 1.5% tax · 5.0% vac · 8.0% maint · 8.0% mgmt
Financing live
Cash to close
- Down payment
- $37,500
- Closing costs
- $4,500
- Reserves months
- —
- Total cash needed
- —
Loan-product check · same deal, 3 products live
Conventional
25% down · 7.5% · 30yr
- Down + closing
- —
- Monthly P&I
- —
- Monthly cashflow
- —
- DSCR
- —
- Eligible?
- —
Personal DTI + credit; lowest rate.
DSCR
20% down · 8.5% · 30yr
- Down + closing
- —
- Monthly P&I
- —
- Monthly cashflow
- —
- DSCR
- —
- Eligible?
- —
No personal income docs; deal must DSCR.
Hard money
10% down · 12.0% · 12mo
- Down + closing
- —
- Monthly P&I
- —
- Monthly cashflow
- —
- DSCR
- —
- Eligible?
- —
Short-term bridge; refi at stabilization.
Rent comps 8 comps
| Address | Beds | Baths | Sqft | Rent | $/sqft | DOM | Units | Dist |
|---|---|---|---|---|---|---|---|---|
| 428 Willow Ln Bessemer, AL | 4.0 | 2.0 | 1375 | $1,620 | $1.18 | 16d | 1 | 0.23mi |
| 3447 Jeanne Ln Bessemer, AL | 3.0 | 2.0 | 1460 | $1,850 | $1.27 | 3d | 1 | 0.31mi |
| 2129 13th St N Bessemer, AL | 4.0 | 1.0 | 1378 | $1,445 | $1.05 | 16d | 1 | 0.41mi |
| 1032 26th Ave N Bessemer, AL | 3.0 | 1.0 | 1724 | $1,175 | $0.68 | 4d | 1 | 0.44mi |
| 2028 13th St N Bessemer, AL | 3.0 | 2.0 | 1372 | $1,073 | $0.78 | 25d | 1 | 0.49mi |
| 1036 Rose Hill Cir Bessemer, AL | 3.0 | 2.0 | 1277 | $1,300 | $1.02 | 22d | 1 | 0.61mi |
| 306 W Lake Cir SW Bessemer, AL | 1.0–3.0 | 1.0–2.0 | 1004 | $1,455 | $1.45 | 3d | 1 | 1.36mi |
| 2825 19th St N Bessemer, AL | 3.0 | 1.5 | 1991 | $1,395 | $0.70 | 45d | 1 | 1.37mi |
Listing history 16 events
-
2026-06-18days on market $150,000 Active 28 DOM
-
2026-06-17days on market $150,000 Active 27 DOM
-
2026-06-16days on market $150,000 Active 26 DOM
-
2026-06-15days on market $150,000 Active 25 DOM
-
2026-06-13days on market $150,000 Active 23 DOM
-
2026-06-10days on market $150,000 Active 20 DOM
-
2026-06-09days on market $150,000 Active 19 DOM
-
2026-06-08days on market $150,000 Active 18 DOM
-
2026-06-07days on market $150,000 Active 17 DOM
-
2026-06-03days on market $150,000 Active 13 DOM
-
2026-06-02days on market $150,000 Active 12 DOM
-
2026-06-01days on market $150,000 Active 11 DOM
-
2026-05-31days on market $150,000 Active 10 DOM
-
2026-05-20$150,000 Active
-
2025-06-12soldstatus $153,000
-
1977-06-24soldstatus $29,900
ⓘ Source: listings_history table (triggers on properties + properties_extension) + one-shot
backfill from property_details.listing_events for pre-trigger history.
Tax reassessment forecast AL · Resets to sale price
- Current annual tax
- $867 · $72/mo
- Projected year-2 tax
- $867 · $72/mo
- Expected delta
- $0/yr ($0/mo · 0.0%)
ⓘ Screening estimate from a state-policy table — verify with the county assessor before closing.
Climate risk First Street
- Flood 1/10 Low FEMA zone X (unshaded) · 0% chance over 30 yrs
- Wildfire 3/10 Moderate
- Heat 6/10 Major 7 d/yr ≥109°F today · 19 d/yr by 30 yrs out
- Wind 6/10 Major 44% chance of damaging wind over 30 yrs
- Air quality 3/10 Moderate 2 unhealthy d/yr today · 5 by 30 yrs out
Nearby sold comps map
Loading sold comps map…
Walkable amenities ~0.75 mi
Loading nearby amenities…
Taxation est. · year 1
- Rental income
- $18,194
- − Mortgage interest
- −$8,402
- − Property taxes
- −$867
- − Insurance
- −$750
- − Repairs & maintenance
- −$1,456
- − Management
- −$1,456
- − Depreciation
- −$4,364
- Taxable income
- $900
- Est. tax owed @ 24.0%
- −$216
- After-tax cash flow
- $3,101/yr
For passive investors: Depreciation is non-cash, so a rental often shows a tax loss while cash-flowing — sheltering income. Rental losses are passive: they offset passive income freely, and up to $25,000/yr can offset ordinary (W-2) income if you actively participate and your MAGI is under $100k (phasing out to $0 by $150k); unused losses carry forward. On sale, claimed depreciation is recaptured at up to 25%, and gains may owe capital-gains tax (a 1031 exchange can defer both). Figures are a year-1 estimate at your 24.0% rate — not tax advice; consult a CPA.
Schools (NCES district)
- District
- Jefferson County
- NCES district ID
- 0101920
- Math proficiency
- 9% ▼ -24.00%
- Reading proficiency
- 32% ▼ -5.00%
- Median HH income
- $51,712
- Composite
- 18.4/100
- National rank
- #8937
- State rank
- #104 of 129 in AL
Livability — Hueytown
- Score
- 57/100
- State rank
- #378
- US rank
- #21611
Category grades
Schools grade is shown separately in the Schools card above.
Census & demographics
- Census place
- Hueytown, AL
- County
- Jefferson County · 527,445 people
- Metro
- Birmingham-Hoover, AL
- Population (ZIP)
- 25,533
- Household income
- $69,863
- Rent vs Own
- Severe rent burden
- 247.0
Population outlook (Jefferson County) Hauer SSP2
- Today (2025)
- 669,185 people
- By 2030
- 669,694 · +0.1%
- By 2040
- 661,388 · -1.2%
- By 2050
- 643,086 · -3.9%
- By 2075
- 577,267 · -13.7%
- By 2100
- 474,758 · -29.1%
Race, ethnicity, and origin ACS 2023
- Neighborhood character
- Diverse neighborhood (Simpson 0.56)
- Race & ethnicity
- White 58% Black 30% Hispanic / Latino 7% Two or more races 3%
- Hispanic origin (detail)
- Mexican 5%
- Common ancestry
- Slovak 1% Lithuanian 1% Serbian 1%
- Foreign-born
- 4% · Canada
- Languages at home
- 93% English-only · Spanish 7%
Political lean MEDSL · Jefferson
- 2024 margin
- D (+10.4) · D 54.6% · R 44.2% · Other 1.2%
- 2008→2024 swing
- +5.4pp toward D · 2008: 5.1pp · 2024: 10.4pp
- All cycles
- 2024: D+10.4 2020: D+13.2 2016: D+7.2 2012: D+6.0 2008: D+5.1
Not yet ingested
- Civics
- —
Market trends
- HPI YoY
- ▼ -0.60%
- Current HPI
- 389.38
- Rent YoY
- ▲ 1.60%
- Metro
- Birmingham-Hoover, AL
- State GDP YoY
- ▲ 2.94%
- F500 in state
- 4
Industry mix (Fortune 500 HQ in AL)
| Industry | F500 HQs | Revenue |
|---|---|---|
| Financial Services | 1 | $8B |
|
||
| Healthcare | 1 | $5B |
|
||
Price history
+401.7% since first listed3 events — show timeline
- 2026-05-20 Listed $150,000 Greater Alabama MLS
- 2025-06-12 Sold (Public Records) $153,000 Public Records
- 1977-06-24 Sold (Public Records) $29,900 Public Records
Property tax history
+4.6%/yrLatest (2025): $867 · +0.0% YoY. Source: county tax records.
Cash-flow waterfall
monthlySold comps — $/sqft
last 12 mo · ≤1 miLoading sold comps…