1823 Union St · Indianapolis city (balance), IN
Flood risk 1/10 · Minimal
- FEMA flood zone
- X (unshaded)
- Chance of flooding over 30 yrs
- 0.0%
- Est. flood insurance / yr
- $473 – $860
Fire risk 1/10 · Minimal
- Est. fire insurance / yr
- $717 – $1,331
Heat risk 4/10 · Minor
- Hot days now (above 101°F)
- 7 days/yr
- Hot days in 30 yrs
- 19 days/yr
Wind risk 2/10 · Minimal
- Chance of severe wind over 30 yrs
- 1.0%
Air-quality risk 3/10 · Minor
- Unhealthy air days now
- 2 days/yr
- Unhealthy air days in 30 yrs
- 3 days/yr
Risk factors via First Street. Map © Google.
Why this score? — see what drove the B grade
The composite is a weighted blend of 9 inputs, each scored 0–100. Each bar is that input's sub-score; the figure is the points it added to the 100-point composite (weight × sub-score).
- Cash flow +29.7/30.0
- ARV discount +15.0/15.0
- DSCR +10.0/10.0
- 1% rule +8.4/10.0
- Rent growth +5.0/5.0
- Livability +2.5/5.0
- Condition / age +2.5/5.0
- Schools +1.4/10.0
- Appreciation +0.0/10.0
$139,000
🖨 Deal sheet 📄 Offer letter ✓ Due diligence
Listing remarks MLS
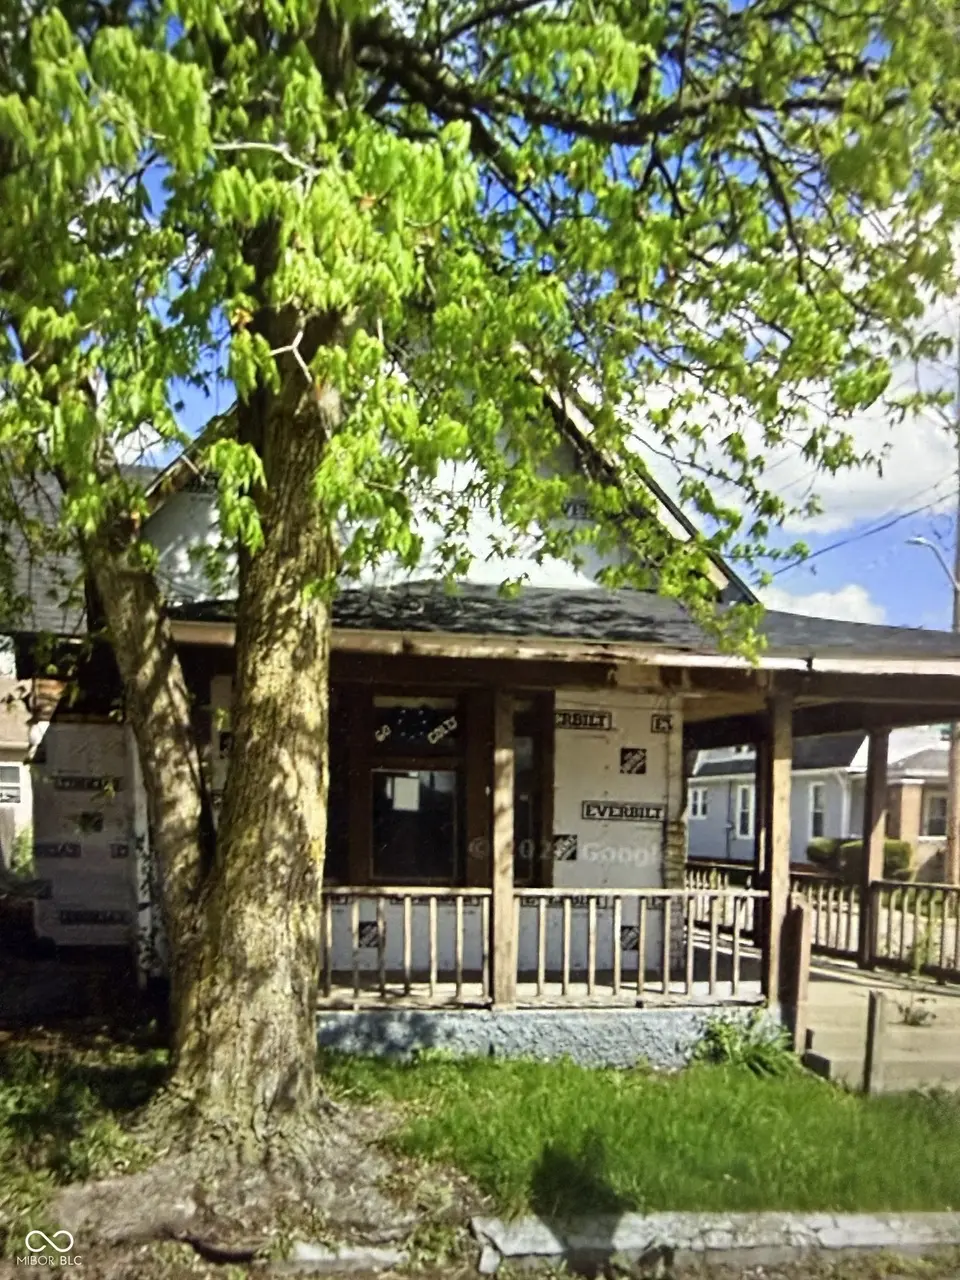
Property is ready for the right buyer to unlock its true potential. This home offers a blank canvas for renovation. Full rehab opportunity is ideal for investors looking to bring new life to a property with character and great potential. Home is down to the studs and new roof 2025. Bring your contractor and your creative opportunitys like this don't last long!
Key facts
- 3,485 sq ft lot
- 2 garage spots
- Built 1910
Neighborhood map
What this means for you Summary
Snapshot
- This is a 3-bed/2.0-bath single-family listed at $139k.
Deal economics
- At list price, monthly cash flow is $506 ($6k/yr) — positive.
- The deal already cash-flows at list — no discount required.
- Meets the 1% rule at list price ($2k rent vs $139k).
- Recommended offer: $131k (6.0% below list) — sets the bar for market timing.
- Cap rate 10.7% vs local median 4.4% in Indianapolis city (balance) — top-decile yield for the area; either an underpriced asset or a hidden risk that comps aren't pricing in. Stress-test before assuming the spread holds.
Location & tenants
- Location reads: area grade B — affects rentability + tenant quality, not the cash-flow math above.
- Indianapolis Public Schools (urban): math 14% / reading 20% proficiency, ranked #286 of 301 in IN (top 95%) — low school quality limits family demand, transient renter base, plan for 1-2y turnover; 77% free/reduced lunch — lower-income household profile, screen leases tightly.
- Market conditions: Rents rising fast (+11.0%/yr); 129 active listings in the ZIP; 40 comparable units currently listed for rent nearby; rentals at typical pace (median 24d on market — plan ~3-4 weeks tenant-placement turnaround); 1,906 units permitted in Marion County in 2024 (621 in 5+ unit buildings).
- This rent runs 40% of the median local income ($55k/yr) — at the standard rent-burdened threshold; future hikes will face affordability resistance.
Forward outlook
- Local home prices are declining (-3.0%/yr); year-one equity from $961 of loan paydown is wiped out by about $4k of value loss. Plan a longer hold.
- Marion County population projected at +18% by 2050 — long-run rental-demand tailwind backs the buy-and-hold thesis.
- At projected returns (-3.0% appreciation + 8.0% rent growth), your $39k cash investment doubles in ~6 years — after that, you're playing with house money.
Negotiation context
- It's been on market 69 days — a 6% lower offer ($131k) is reasonable based on typical stale-listing flexibility.
- 4 sale attempts since 25y ago with the ask held roughly flat each time — persistent listings suggest the price (not the market) is what's stuck; bring a comps-based counter.
- Current owner paid $11k; list at $139k implies a 1164% gain — meaningful room to come down on a strong offer.
Risks & watch-outs
- Watch-outs: built in 1910 — expect roof / HVAC / electrical / plumbing capex.
Questions for the listing agent
- It's been on market 69 days. Have you received any prior offers? Is the seller open to a 6% concession, seller financing, or rate buy-down credit?
- Built in 1910 — when were the roof, HVAC, electrical panel, plumbing, and water heater last replaced?
- Why hasn't it sold? Are there any deal-killer items the seller is aware of (foundation, flood, title, zoning, code violations)?
- Is there a deadline driving the sale (1031 exchange, divorce, estate, relocation)? That informs how much negotiation room exists.
- What's the average days-on-market for RENTAL listings here right now (not sales)? A rising rental-DOM trend means longer vacancies and softer asking-rent achievability than the comps imply.
- What's the recent tenant-quality profile in this submarket — average credit score on applications, eviction rate, late-payment / NSF rate, and stable-employment percentage? A property-management company in the area should have these aggregated.
- How much new for-sale + rental construction is in the pipeline within 1–3 miles? Heavy new supply typically softens prices + rents 12–24 months out; constrained supply supports both.
Investment metrics
- 1% rule
- 1.34% ✓
- Cap rate
- 10.66%
- Cash-on-cash
- 15.60%
- DSCR
- 1.69
- GRM
- 6.2
CMA / ARV
- ARV (median comp)
- $253,534
- List price
- $139,000
- Delta
- -45.17%
- Verdict
- UNDERPRICED
- Comps
- 20 within 1.0 mi
Show comp detail 12 sales within ~0.75 mi
| Address | Dist | Beds/Ba | Sqft | Sold | Price | $/sf | Match |
|---|---|---|---|---|---|---|---|
| 1750 Union St | 0.05mi | 4/2.0 (+1) | 1,641 (-6%) | 4mo | $229,000 | $140 | 80 |
| 2134 S Delaware St | 0.28mi | 3/3.0 | 1,680 (-3%) | 2mo | $195,000 | $116 | 76 |
| 14 E Regent St | 0.29mi | 3/2.5 | 1,496 (-14%) | 2mo | $270,000 | $180 | 60 |
| 1214 S Talbott St | 0.62mi | 3/2.0 | 1,638 (-6%) | 4mo | $270,000 | $165 | 58 |
| 2142 Webb St | 0.37mi | 3/2.0 | 1,496 (-14%) | 3mo | $128,000 | $86 | 58 |
| 227 Sanders St | 0.60mi | 3/3.5 | 1,819 (+5%) | 2mo | $335,000 | $184 | 56 |
| 2125 S Garfield Dr | 0.73mi | 3/2.5 | 1,820 (+5%) | 0mo | $285,000 | $157 | 56 |
| 2145 Singleton St | 0.57mi | 3/1.0 | 1,869 (+8%) | 1mo | $152,000 | $81 | 56 |
| 518 Terrace Ave | 0.61mi | 3/2.5 | 1,869 (+8%) | 2mo | $335,000 | $179 | 56 |
| 2302 S Pennsylvania St | 0.53mi | 3/3.0 | 1,590 (-8%) | 2mo | $275,000 | $173 | 55 |
| 706 E Minnesota St | 0.58mi | 3/3.5 | 1,589 (-8%) | 3mo | $202,000 | $127 | 50 |
| 2345 S Pennsylvania St | 0.59mi | 2/1.5 (-1) | 1,936 (+12%) | 1mo | $203,999 | $105 | 46 |
Match score weights: distance 35% · size 25% · config 20% · recency 20%. Top-matched comps best support the ARV.
Projected returns pro-forma
-3.0% appreciation · 8.0% rent growth · sell at horizon
- IRR
- 11.9%
- Equity multiple
- 1.50×
- Total profit
- $19,544
- Equity at exit
- $20,725
- IRR
- 24.6%
- Equity multiple
- 3.65×
- Total profit
- $103,286
- Equity at exit
- $12,018
Cash invested: $38,920 (down + closing). Projections, not guarantees.
Landlord ↔ Tenant lean methodology
- Overall (STATE)
- 90 Strongly Landlord-Friendly
- State Indiana
- 90 Strongly Landlord-Friendly · R+11
- County
- — inherits STATE
- City
- — inherits STATE
ZIP-level market 46225
- Home prices YoY
- -8.2%
- Rents YoY
- 11.0%
- Active inventory
- 129
- Price-to-rent
- 6.2×
Monthly cashflow live
- Estimated rent
- $1,856 high interval (Pro) →
- Mortgage (P&I)
- −$729
- Tax est. 1.5%
- −$174 /mo · $2,085/yr
- Insurance
- −$58
- HOA
- −$0
- Vacancy / Maint / Mgmt
- −$390
- Net cashflow
- $506
Break-even live
UW: 25.0% down · 7.5% · 30yr · 1.5% tax · 5.0% vac · 8.0% maint · 8.0% mgmt
Financing live
Cash to close
- Down payment
- $34,750
- Closing costs
- $4,170
- Reserves months
- —
- Total cash needed
- —
Loan-product check · same deal, 3 products live
Conventional
25% down · 7.5% · 30yr
- Down + closing
- —
- Monthly P&I
- —
- Monthly cashflow
- —
- DSCR
- —
- Eligible?
- —
Personal DTI + credit; lowest rate.
DSCR
20% down · 8.5% · 30yr
- Down + closing
- —
- Monthly P&I
- —
- Monthly cashflow
- —
- DSCR
- —
- Eligible?
- —
No personal income docs; deal must DSCR.
Hard money
10% down · 12.0% · 12mo
- Down + closing
- —
- Monthly P&I
- —
- Monthly cashflow
- —
- DSCR
- —
- Eligible?
- —
Short-term bridge; refi at stabilization.
Rent comps 40 comps
| Address | Beds | Baths | Sqft | Rent | $/sqft | DOM | Units | Dist |
|---|---|---|---|---|---|---|---|---|
| 1713 S Delaware St Indianapolis, IN | 2.0 | 2.0 | 1785 | $1,700 | $0.95 | 43d | 1 | 0.18mi |
| 224 Iowa St Indianapolis, IN | 3.0 | 1.0 | 1254 | $1,450 | $1.16 | 23d | 1 | 0.23mi |
| 438 E Beecher St Indianapolis, IN | 3.0 | 2.5 | 1500 | $1,450 | $0.97 | 23d | 1 | 0.39mi |
| 243 Terrace Ave Indianapolis, IN | 4.0 | 2.0 | 1669 | $2,700 | $1.62 | 17d | 1 | 0.48mi |
| 1436 S New Jersey St Unit A Indianapolis, IN | 3.0 | 2.5 | 1300 | $2,100 | $1.62 | 23d | 1 | 0.48mi |
| 2283 Union St Indianapolis, IN | 3.0 | 2.0 | 1824 | $1,820 | $1.00 | 23d | 1 | 0.49mi |
| 620 E Beecher St Indianapolis, IN | 3.0 | 2.0 | 1072 | $1,639 | $1.53 | 19d | 1 | 0.50mi |
| 1830 Orleans St Indianapolis, IN | 3.0 | 2.5 | 1586 | $1,995 | $1.26 | 43d | 1 | 0.52mi |
| 2109 Singleton St Indianapolis, IN | 3.0 | 2.0 | 1340 | $2,100 | $1.57 | 7d | 1 | 0.52mi |
| 1439 South East St Indianapolis, IN | 2.0 | 2.0 | 1114 | $1,425 | $1.28 | 20d | 1 | 0.54mi |
| 1437 S East St Indianapolis, IN | 2.0 | 2.0 | 1114 | $1,425 | $1.28 | 43d | 1 | 0.55mi |
| 1833 Orleans St Unit 1 Indianapolis, IN | 3.0 | 1.0 | 1260 | $1,350 | $1.07 | 43d | 1 | 0.55mi |
| 1835 Applegate St Indianapolis, IN | 4.0 | 3.0 | 2024 | $2,300 | $1.14 | 43d | 1 | 0.61mi |
| 406 Orange St Indianapolis, IN | 3.0 | 2.5 | 1820 | $2,250 | $1.24 | 43d | 1 | 0.64mi |
| 728 Cottage Ave Indianapolis, IN | 3.0 | 2.5 | 1831 | $2,550 | $1.39 | 23d | 1 | 0.68mi |
| 614 Parkway Ave Indianapolis, IN | 3.0 | 2.0 | 1360 | $1,900 | $1.40 | 21d | 1 | 0.69mi |
| 752 Cottage Ave Indianapolis, IN | 3.0 | 2.0 | 1548 | $1,750 | $1.13 | 14d | 1 | 0.72mi |
| 835 Weghorst St Unit 837 Indianapolis, IN | 3.0 | 1.5 | 1500 | $1,399 | $0.93 | 23d | 1 | 0.73mi |
| 726 Parkway Ave Indianapolis, IN | 3.0 | 2.0 | 1150 | $2,195 | $1.91 | 17d | 1 | 0.74mi |
| 734 Parkway Ave Indianapolis, IN | 3.0 | 2.0 | 2110 | $2,299 | $1.09 | 23d | 1 | 0.75mi |
| 704 Sanders St Indianapolis, IN | 2.0 | 1.0 | 1290 | $1,275 | $0.99 | 23d | 1 | 0.79mi |
| 1247 Wright St Indianapolis, IN | 3.0 | 1.5 | 1809 | $1,750 | $0.97 | 43d | 1 | 0.83mi |
| 1247 Wright St Indianapolis, IN | 3.0 | 1.5 | 1247 | $1,750 | $1.40 | 17d | 1 | 0.83mi |
| 518 Prospect St Unit 1353834P Indianapolis, IN | 3.0 | 2.0 | 1603 | $2,442 | $1.52 | 14d | 1 | 0.84mi |
| 518 Prospect St Unit 1357365P Indianapolis, IN | 3.0 | 2.0 | 1614 | $2,594 | $1.61 | 7d | 1 | 0.84mi |
| 1514 Ringgold Ave Indianapolis, IN | 3.0 | 1.0 | 1064 | $1,295 | $1.22 | 43d | 1 | 0.85mi |
| 1861 Barth Ave Unit 1861 Indianapolis, IN | 2.0 | 1.0 | 1300 | $1,600 | $1.23 | 23d | 1 | 0.86mi |
| 736 E Morris St Indianapolis, IN | 2.0 | 1.5 | 1500 | $1,195 | $0.80 | 3d | 1 | 0.87mi |
| 1011 E Raymond St Indianapolis, IN | 2.0 | 2.0 | 1100 | $1,350 | $1.23 | 23d | 1 | 0.88mi |
| 110 Pennsylvania Ct Indianapolis, IN | 3.0 | 2.0 | 1202 | $1,700 | $1.41 | 4d | 1 | 0.91mi |
| 915 S Meridian St Indianapolis, IN | 2.0 | 1.0–2.0 | 829 | $2,551 | $3.08 | 1d | 42 | 0.91mi |
| 1045 Orange St Indianapolis, IN | 2.0 | 1.0 | 1232 | $2,000 | $1.62 | 23d | 1 | 1.00mi |
| 1045 Orange St Indianapolis, IN | 2.0 | 1.0 | 1232 | $2,200 | $1.79 | 43d | 1 | 1.00mi |
| 714 Buchanan St Indianapolis, IN | 2.0 | 2.0 | 1100 | $1,995 | $1.81 | 14d | 1 | 1.01mi |
| 907 Prospect St Unit 907 Prospect NO AMI Indianapolis, IN | 3.0 | 1.5 | 1121 | $1,400 | $1.25 | 23d | 1 | 1.01mi |
| 932 E Morris St Indianapolis, IN | 2.0 | 2.0 | 1483 | $1,900 | $1.28 | 2d | 1 | 1.02mi |
| 1035 Sanders St Unit 163 Indianapolis, IN | 2.0 | 1.0 | 1481 | $1,921 | $1.30 | 43d | 1 | 1.02mi |
| 1258 E Naomi St Indianapolis, IN | 3.0 | 2.0 | 1608 | $1,450 | $0.90 | 7d | 1 | 1.09mi |
| 1140 Shelby St Apt 515 Indianapolis, IN | 2.0 | 2.0 | 1181 | $2,090 | $1.77 | 23d | 1 | 1.10mi |
| 1012 Prospect St Unit 907 Prospect NO AMI Indianapolis, IN | 3.0 | 1.5 | 1121 | $1,400 | $1.25 | 43d | 1 | 1.10mi |
Listing history 21 events
-
2026-06-18days on market $139,000 Active 69 DOM
-
2026-06-17days on market $139,000 Active 68 DOM
-
2026-06-16days on market $139,000 Active 67 DOM
-
2026-06-15days on market $139,000 Active 66 DOM
-
2026-06-13days on market $139,000 Active 64 DOM
-
2026-06-13days on market $139,000 Active 63 DOM
-
2026-06-09days on market $139,000 Active 60 DOM
-
2026-06-08days on market $139,000 Active 59 DOM
-
2026-06-07days on market $139,000 Active 58 DOM
-
2026-06-03days on market $139,000 Active 54 DOM
-
2026-06-02days on market $139,000 Active 53 DOM
-
2026-06-01days on market $139,000 Active 52 DOM
-
2026-05-31days on market $139,000 Active 51 DOM
-
2026-04-20price $139,000 362-char remark
Show marketing remark (362 chars)
Property is ready for the right buyer to unlock its true potential. This home offers a blank canvas for renovation. Full rehab opportunity is ideal for investors looking to bring new life to a property with character and great potential. Home is down to the studs and new roof 2025. Bring your contractor and your creative opportunitys like this don't last long!
-
2026-04-09$146,000 Active 362-char remark
Show marketing remark (362 chars)
Property is ready for the right buyer to unlock its true potential. This home offers a blank canvas for renovation. Full rehab opportunity is ideal for investors looking to bring new life to a property with character and great potential. Home is down to the studs and new roof 2025. Bring your contractor and your creative opportunitys like this don't last long!
-
2008-05-20soldstatus $11,000 113-char remark
Show marketing remark (113 chars)
3 BEDROOM CONVENIENT TO DOWNTOWN. ROOM SIZES ARE APPROXIMATE. BANK ONWED. PROPERTY BEING SOLD IN AS IS CONDITION.
-
2007-10-02$13,500 113-char remark
Show marketing remark (113 chars)
3 BEDROOM CONVENIENT TO DOWNTOWN. ROOM SIZES ARE APPROXIMATE. BANK ONWED. PROPERTY BEING SOLD IN AS IS CONDITION.
-
2005-02-01soldstatus $14,000
-
2004-08-11$19,900
-
2001-11-05soldstatus
-
2001-07-19$21,900
ⓘ Source: listings_history table (triggers on properties + properties_extension) + one-shot
backfill from property_details.listing_events for pre-trigger history.
Climate risk First Street
- Flood 1/10 Low FEMA zone X (unshaded) · 0% chance over 30 yrs
- Wildfire 1/10 Low
- Heat 4/10 Moderate 7 d/yr ≥101°F today · 19 d/yr by 30 yrs out
- Wind 2/10 Low 100% chance of damaging wind over 30 yrs
- Air quality 3/10 Moderate 2 unhealthy d/yr today · 3 by 30 yrs out
Nearby sold comps map
Loading sold comps map…
Walkable amenities ~0.75 mi
Loading nearby amenities…
Taxation est. · year 1
- Rental income
- $22,278
- − Mortgage interest
- −$7,786
- − Property taxes
- −$2,085
- − Insurance
- −$695
- − Repairs & maintenance
- −$1,782
- − Management
- −$1,782
- − Depreciation
- −$4,044
- Taxable income
- $4,104
- Est. tax owed @ 24.0%
- −$985
- After-tax cash flow
- $5,087/yr
For passive investors: Depreciation is non-cash, so a rental often shows a tax loss while cash-flowing — sheltering income. Rental losses are passive: they offset passive income freely, and up to $25,000/yr can offset ordinary (W-2) income if you actively participate and your MAGI is under $100k (phasing out to $0 by $150k); unused losses carry forward. On sale, claimed depreciation is recaptured at up to 25%, and gains may owe capital-gains tax (a 1031 exchange can defer both). Figures are a year-1 estimate at your 24.0% rate — not tax advice; consult a CPA.
Schools (NCES district)
- District
- Indianapolis Public Schools
- NCES district ID
- 1804770
- Math proficiency
- 14% ▼ -7.00%
- Reading proficiency
- 20% ▼ -3.00%
- Median HH income
- $32,034
- Composite
- 13.69/100
- National rank
- #9499
- State rank
- #286 of 301 in IN
Livability — Indianapolis city (balance)
No livability data for this city. (Only ~50 U.S. cities are tracked.)
Census & demographics
- Census place
- Indianapolis city (balance), IN
- County
- Marion County · 998,460 people
- City population
- 881,119
- Metro
- Indianapolis-Carmel-Anderson, IN
- Population (ZIP)
- 6,037
- Household income
- $55,190
- Rent vs Own
- Severe rent burden
- 311.0
Population outlook (Marion County) Hauer SSP2
- Today (2025)
- 1,025,572 people
- By 2030
- 1,065,727 · +3.9%
- By 2040
- 1,141,577 · +11.3%
- By 2050
- 1,208,920 · +17.9%
- By 2075
- 1,367,288 · +33.3%
- By 2100
- 1,438,201 · +40.2%
Race, ethnicity, and origin ACS 2023
- Neighborhood character
- Predominantly White (68%)
- Race & ethnicity
- White 68% Two or more races 12% Black 11% Hispanic / Latino 10% Asian 2%
- Hispanic origin (detail)
- Mexican 6%
- Common ancestry
- Romanian 2% Italian 2% Slovak 1%
- Foreign-born
- 9% · Canada
- Languages at home
- 88% English-only · Spanish 10% German/W. Germanic 1%
Political lean MEDSL · Marion
- 2024 margin
- Strong D (+27.7) · D 63.0% · R 35.3% · Other 1.7%
- 2008→2024 swing
- -0.7pp no change · 2008: 28.4pp · 2024: 27.7pp
- All cycles
- 2024: D+27.7 2020: D+29.1 2016: D+22.8 2012: D+22.2 2008: D+28.4
Not yet ingested
- Civics
- —
Market trends
- HPI YoY
- ▼ -36.19%
- Current HPI
- 403.9271
- Rent YoY
- ▲ 10.98%
- Metro
- Indianapolis-Carmel-Anderson, IN
- State GDP YoY
- ▲ 2.90%
- F500 in state
- 18
Industry mix (Fortune 500 HQ in IN)
| Industry | F500 HQs | Revenue |
|---|---|---|
| Industrial Machinery | 2 | $37B |
|
||
| Healthcare | 1 | $177B |
|
||
| Pharmaceuticals | 1 | $45B |
|
||
| Metals / Steel | 1 | $18B |
|
||
| Agriculture | 1 | $17B |
|
||
| Packaging | 1 | $12B |
|
||
Price history
+534.7% since first listed8 events — show timeline
- 2026-04-20 Price Changed $139,000 MIBOR as Distributed by MLS Grid
- 2026-04-09 Listed $146,000 MIBOR as Distributed by MLS Grid
- 2008-05-20 Sold (MLS) $11,000 MIBOR as Distributed by MLS Grid
- 2007-10-02 Listed $13,500 MIBOR as Distributed by MLS Grid
- 2005-02-01 Sold (MLS) $14,000 MIBOR as Distributed by MLS Grid
- 2004-08-11 Listed $19,900 MIBOR as Distributed by MLS Grid
- 2001-11-05 Sold (MLS) — MIBOR as Distributed by MLS Grid
- 2001-07-19 Listed $21,900 MIBOR as Distributed by MLS Grid
Property tax history
+22.8%/yrLatest (2025): $7,127 · +54.6% YoY. Source: county tax records.
Cash-flow waterfall
monthlySold comps — $/sqft
last 12 mo · ≤1 miLoading sold comps…