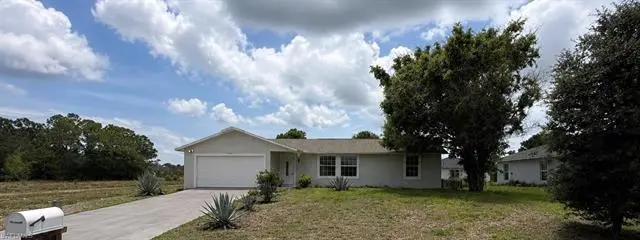
3501 38th St · Lehigh Acres, FL
Flood risk 1/10 · Minimal
- FEMA flood zone
- X (unshaded)
- Chance of flooding over 30 yrs
- 0.0%
- Est. flood insurance / yr
- $507 – $1,088
Fire risk 5/10 · Moderate
- Est. fire insurance / yr
- $947 – $1,759
Heat risk 10/10 · Severe
- Hot days now (above 107°F)
- 7 days/yr
- Hot days in 30 yrs
- 30 days/yr
Wind risk 10/10 · Severe
- Chance of severe wind over 30 yrs
- 99.0%
Air-quality risk 2/10 · Minimal
- Unhealthy air days now
- 1 days/yr
- Unhealthy air days in 30 yrs
- 1 days/yr
Risk factors via First Street. Map © Google.
Why this score? — see what drove the D+ grade
The composite is a weighted blend of 9 inputs, each scored 0–100. Each bar is that input's sub-score; the figure is the points it added to the 100-point composite (weight × sub-score).
- Cash flow +13.4/30.0
- Appreciation +10.0/10.0
- ARV discount +7.5/15.0
- Schools +4.1/10.0
- DSCR +4.0/10.0
- 1% rule +3.3/10.0
- Livability +3.0/5.0
- Condition / age +2.5/5.0
- Rent growth +2.1/5.0
$249,000
🖨 Deal sheet 📄 Offer letter ✓ Due diligence
Listing remarks MLS
Opportunity knocks! This 3-bedroom, 2-bath home offers strong upside potential for investors, flippers, or buyers looking to add value. Located in a quiet residential area with no HOA, the property already has major improvements in place including a 2023 roof and newer HVAC, giving you a strong head start on renovations. The home features a functional split-bedroom floor plan, spacious living areas, and solid bones making it an ideal candidate for a profitable flip, rental property, or long-term hold. Comparable renovated homes in the area support excellent value-add potential. 2023 roof Newer HVAC No HOA Strong rental market Growing Lehigh Acres location Ideal for flip, rental, or long-term investment Property is being sold as-is. Cash or conventional financing preferred. Bring your vision and unlock the potential.
Key facts
- Spacious backyard
- Newer roof
- Split floor plan
Tags
Property features AI
Finance
- Other: Single unit, single floor dwelling; Possession at closing
- HOA & community: Mandatory HOA; Street lights maintained by HOA; Community allows horses; Non-gated community
Exterior
- Parking: Attached 2-car garage
- Utilities: Well water; Septic sewer; Electric service available
- Home design: Residential single-family; 1 story (Ranch); Located in Lehigh Acres
- Construction: Concrete block construction; Built in 1993
- Exterior features: Shingle roof; Single hung windows; Stucco exterior finish; Rear exposure faces north; Total area 1564
Interior
- Bedrooms: 3 bedrooms
- Flooring: Tile flooring
- Bathrooms: 2 full bathrooms; 1 half bathroom; No master bath
- Heating & cooling: Central electric heat; Cooling: see remarks
- Interior features: Approx. living area 1122; See remarks for additional interior details; Unfurnished; Other floor plan
Neighborhood map
What this means for you Summary
Snapshot
- This is a 3-bed/2.0-bath single-family listed at $249k.
Deal economics
- At list price, monthly cash flow is $4 ($54/yr) — positive.
- The deal already cash-flows at list — no discount required.
- To meet the 1% rule (rent ≥ 1% of price), the offer needs to be $206k (17.4% below list).
- Recommended offer: $206k (17.4% below list) — sets the bar for 1% rule.
- Cap rate 6.3% vs local median 4.7% in Lehigh Acres — top-decile yield for the area; either an underpriced asset or a hidden risk that comps aren't pricing in. Stress-test before assuming the spread holds.
Location & tenants
- Location reads 59/100 on livability (#826 in FL) — a working-class tenant base; expect higher turnover. Strengths: cost of living A+, housing A+; Watch: crime C-, employment D+, schools D-.
- Lee (suburban): math 47% / reading 50% proficiency, ranked #42 of 73 in FL (top 58%) — families likely to look elsewhere, expect single-tenant / working-renter base with shorter leases.
- Market conditions: Rents soft (-1.5%/yr); 786 active listings in the ZIP; 20 comparable units currently listed for rent nearby; rentals at typical pace (median 16d on market — plan ~3-4 weeks tenant-placement turnaround); 15,411 units permitted in Lee County in 2024 (4,686 in 5+ unit buildings).
- This rent runs 34% of the median local income ($73k/yr) — at the standard rent-burdened threshold; future hikes will face affordability resistance.
Forward outlook
- In year one you build about $27k of equity ($2k loan paydown + $25k appreciation (10.0% local appreciation)).
- Lee County population projected at +44% by 2050 — long-run rental-demand tailwind backs the buy-and-hold thesis.
- At projected returns (10.0% appreciation + 0.0% rent growth), your $70k cash investment doubles in ~3 years — after that, you're playing with house money.
- By year 2, paydown + projected appreciation supports a ~$43k cash-out refi (75% LTV) — recoverable capital for the next deal without selling this one.
Negotiation context
- Only 8 days on market — expect competitive offers; lowballing is unlikely to land.
- 6 sale attempts with the ask held roughly flat each time — persistent listings suggest the price (not the market) is what's stuck; bring a comps-based counter.
- Current owner paid $149k; list at $249k implies a 67% gain — meaningful room to come down on a strong offer.
Risks & watch-outs
- Climate carrying-cost: severe wind risk, 99% chance of damaging wind over 30y; moderate wildfire risk; extreme-heat days projected 7→30/yr by 2055 (HVAC capex compounding) — expect insurance premiums to compound above CPI over the hold.
Questions for the listing agent
- Is there a deadline driving the sale (1031 exchange, divorce, estate, relocation)? That informs how much negotiation room exists.
- Schools are D-rated, which usually means shorter tenancies and higher turnover. Who's the typical renter profile here, and what's been the actual vacancy rate?
- The area grade is low — what's the realistic commute time and amenity access for the typical tenant pool here? Any planned neighborhood developments (good or bad) we should know about?
- What's the average days-on-market for RENTAL listings here right now (not sales)? A rising rental-DOM trend means longer vacancies and softer asking-rent achievability than the comps imply.
- What's the recent tenant-quality profile in this submarket — average credit score on applications, eviction rate, late-payment / NSF rate, and stable-employment percentage? A property-management company in the area should have these aggregated.
- How much new for-sale + rental construction is in the pipeline within 1–3 miles? Heavy new supply typically softens prices + rents 12–24 months out; constrained supply supports both.
Investment metrics
- 1% rule
- 0.83% ✗
- Cap rate
- 6.31%
- Cash-on-cash
- 0.08%
- DSCR
- 1.00
- GRM
- 10.1
CMA / ARV
- ARV (on-the-fly)
- $249,084
- Comps found
- 3
Show comp detail 3 sales within ~0.75 mi
| Address | Dist | Beds/Ba | Sqft | Sold | Price | $/sf | Match |
|---|---|---|---|---|---|---|---|
| 3210 38th St SW | 0.42mi | 3/2.0 | 1,285 (+14%) | 14mo | $284,990 | $222 | 45 |
| 2905 Villa Ave S | 0.57mi | 3/2.0 | 1,289 (+15%) | 12mo | $245,000 | $190 | 39 |
| 3100 Xelda Ave S | 0.59mi | 3/2.0 | 1,272 (+13%) | 24mo | $315,000 | $248 | 30 |
Match score weights: distance 35% · size 25% · config 20% · recency 20%. Top-matched comps best support the ARV.
Projected returns pro-forma
10.0% appreciation · 0.0% rent growth · sell at horizon
- IRR
- 23.4%
- Equity multiple
- 2.86×
- Total profit
- $129,837
- Equity at exit
- $224,319
- IRR
- 20.2%
- Equity multiple
- 6.33×
- Total profit
- $371,265
- Equity at exit
- $483,752
Cash invested: $69,720 (down + closing). Projections, not guarantees.
Landlord ↔ Tenant lean methodology
- Overall (STATE)
- 87 Strongly Landlord-Friendly
- State Florida
- 87 Strongly Landlord-Friendly · R+3
- County
- — inherits STATE
- City
- — inherits STATE
ZIP-level market 33976
- Home prices YoY
- 6.8%
- Rents YoY
- -1.5%
- Active inventory
- 786
- Price-to-rent
- 10.1×
Monthly cashflow live
- Estimated rent
- $2,058 high interval (Pro) →
- Mortgage (P&I)
- −$1,306
- Tax from tax record
- −$212 /mo · $2,540/yr
- Insurance
- −$104
- HOA
- −$0
- Vacancy / Maint / Mgmt
- −$432
- Net cashflow
- $4
Break-even live
UW: 25.0% down · 7.5% · 30yr · 1.5% tax · 5.0% vac · 8.0% maint · 8.0% mgmt
Financing live
Cash to close
- Down payment
- $62,250
- Closing costs
- $7,470
- Reserves months
- —
- Total cash needed
- —
Loan-product check · same deal, 3 products live
Conventional
25% down · 7.5% · 30yr
- Down + closing
- —
- Monthly P&I
- —
- Monthly cashflow
- —
- DSCR
- —
- Eligible?
- —
Personal DTI + credit; lowest rate.
DSCR
20% down · 8.5% · 30yr
- Down + closing
- —
- Monthly P&I
- —
- Monthly cashflow
- —
- DSCR
- —
- Eligible?
- —
No personal income docs; deal must DSCR.
Hard money
10% down · 12.0% · 12mo
- Down + closing
- —
- Monthly P&I
- —
- Monthly cashflow
- —
- DSCR
- —
- Eligible?
- —
Short-term bridge; refi at stabilization.
Rent comps 20 comps
| Address | Beds | Baths | Sqft | Rent | $/sqft | DOM | Units | Dist |
|---|---|---|---|---|---|---|---|---|
| 3802 35th St SW Lehigh Acres, FL | 3.0 | 2.0 | 1269 | $1,640 | $1.29 | 23d | 1 | 0.49mi |
| 3114 39th St SW Lehigh Acres, FL | 3.0 | 2.0 | 1493 | $2,100 | $1.41 | 16d | 1 | 0.60mi |
| 3114 39th St SW Lehigh Acres, FL | 3.0 | 2.0 | 1493 | $2,100 | $1.41 | 3d | 1 | 0.60mi |
| 3102 39th St SW Lehigh Acres, FL | 3.0 | 2.0 | 1097 | $1,630 | $1.49 | 21d | 1 | 0.69mi |
| 3201 28th St Lehigh Acres, FL | 4.0 | 2.0 | 1389 | $2,000 | $1.44 | 3d | 1 | 0.80mi |
| 3012 40th St SW Lehigh Acres, FL | 3.0 | 2.0 | 1427 | $1,950 | $1.37 | 23d | 1 | 0.83mi |
| 4020 36th St SW Lehigh Acres, FL | 3.0 | 2.0 | 1354 | $2,050 | $1.51 | 23d | 1 | 0.92mi |
| 2916 42nd St SW Lehigh Acres, FL | 3.0 | 2.0 | 1399 | $1,960 | $1.40 | 3d | 1 | 0.97mi |
| 2916 42nd St SW Lehigh Acres, FL | 3.0 | 2.0 | 1399 | $1,930 | $1.38 | 2d | 1 | 0.97mi |
| 4702 Loraine Ave S Lehigh Acres, FL | 3.0 | 2.0 | 1354 | $2,000 | $1.48 | 14d | 1 | 0.99mi |
| 3203 24th St SW Lehigh Acres, FL | 3.0 | 2.0 | 1498 | $2,300 | $1.54 | 21d | 1 | 0.99mi |
| 3001 37th St SW Lehigh Acres, FL | 3.0 | 2.5 | 1235 | $1,705 | $1.38 | 23d | 1 | 1.02mi |
| 3201 23rd St SW Lehigh Acres, FL | 3.0 | 2.0 | 1324 | $1,845 | $1.39 | 21d | 1 | 1.05mi |
| 3209 21st St SW Lehigh Acres, FL | 3.0 | 2.0 | 1418 | $1,699 | $1.20 | 3d | 1 | 1.18mi |
| 3600 19th St SW Lehigh Acres, FL | 3.0 | 2.0 | 1114 | $1,746 | $1.57 | 3d | 1 | 1.20mi |
| 3202 21st St SW Lehigh Acres, FL | 3.0 | 2.0 | 1100 | $1,920 | $1.75 | 3d | 1 | 1.23mi |
| 4001 22nd St SW Lehigh Acres, FL | 3.0 | 2.0 | 1055 | $1,950 | $1.85 | 2d | 1 | 1.23mi |
| 2908 51st St SW Lehigh Acres, FL | 3.0 | 2.0 | 1401 | $1,796 | $1.28 | 3d | 1 | 1.29mi |
| 2819 51st St SW Lehigh Acres, FL | 4.0 | 2.0 | 1472 | $2,250 | $1.53 | 23d | 1 | 1.38mi |
| 2811 25th St SW Unit NA Lehigh Acres, FL | 3.0 | 2.0 | 1430 | $1,990 | $1.39 | 23d | 1 | 1.42mi |
Listing history 31 events
-
2026-06-18days on market $249,000 Active 8 DOM
-
2026-06-17days on market $249,000 Active 7 DOM
-
2026-06-16days on market $249,000 Active 6 DOM
-
2026-06-15price $249,000 Active 5 DOM
-
2026-06-15days on market $269,000 Active 5 DOM
-
2026-06-13pricedays on market $269,000 Active 3 DOM
-
2026-05-14$259,000 Active
-
2026-04-15soldstatus $149,000
-
2026-04-14soldstatus $149,000 Closed 837-char remark
Show marketing remark (837 chars)
Opportunity knocks! This 3-bedroom, 2-bath home offers strong upside potential for investors, flippers, or buyers looking to add value. Located in a quiet residential area with no HOA, the property already has major improvements in place including a 2023 roof and newer HVAC, giving you a strong head start on renovations. The home features a functional split-bedroom floor plan, spacious living areas, and solid bones making it an ideal candidate for a profitable flip, rental property, or long-term hold. Comparable renovated homes in the area support excellent value-add potential. 2023 roof Newer HVAC No HOA Strong rental market Growing Lehigh Acres location Ideal for flip, rental, or long-term investment Property is being sold as-is. Cash or conventional financing preferred. Bring your vision and unlock the potential.
-
2026-03-25status Pending 837-char remark
Show marketing remark (837 chars)
Opportunity knocks! This 3-bedroom, 2-bath home offers strong upside potential for investors, flippers, or buyers looking to add value. Located in a quiet residential area with no HOA, the property already has major improvements in place including a 2023 roof and newer HVAC, giving you a strong head start on renovations. The home features a functional split-bedroom floor plan, spacious living areas, and solid bones making it an ideal candidate for a profitable flip, rental property, or long-term hold. Comparable renovated homes in the area support excellent value-add potential. 2023 roof Newer HVAC No HOA Strong rental market Growing Lehigh Acres location Ideal for flip, rental, or long-term investment Property is being sold as-is. Cash or conventional financing preferred. Bring your vision and unlock the potential.
-
2026-03-17status Active 837-char remark
Show marketing remark (837 chars)
Opportunity knocks! This 3-bedroom, 2-bath home offers strong upside potential for investors, flippers, or buyers looking to add value. Located in a quiet residential area with no HOA, the property already has major improvements in place including a 2023 roof and newer HVAC, giving you a strong head start on renovations. The home features a functional split-bedroom floor plan, spacious living areas, and solid bones making it an ideal candidate for a profitable flip, rental property, or long-term hold. Comparable renovated homes in the area support excellent value-add potential. 2023 roof Newer HVAC No HOA Strong rental market Growing Lehigh Acres location Ideal for flip, rental, or long-term investment Property is being sold as-is. Cash or conventional financing preferred. Bring your vision and unlock the potential.
-
2026-03-11status Pending 837-char remark
Show marketing remark (837 chars)
Opportunity knocks! This 3-bedroom, 2-bath home offers strong upside potential for investors, flippers, or buyers looking to add value. Located in a quiet residential area with no HOA, the property already has major improvements in place including a 2023 roof and newer HVAC, giving you a strong head start on renovations. The home features a functional split-bedroom floor plan, spacious living areas, and solid bones making it an ideal candidate for a profitable flip, rental property, or long-term hold. Comparable renovated homes in the area support excellent value-add potential. 2023 roof Newer HVAC No HOA Strong rental market Growing Lehigh Acres location Ideal for flip, rental, or long-term investment Property is being sold as-is. Cash or conventional financing preferred. Bring your vision and unlock the potential.
-
2026-02-27$169,900 Active 837-char remark
Show marketing remark (837 chars)
Opportunity knocks! This 3-bedroom, 2-bath home offers strong upside potential for investors, flippers, or buyers looking to add value. Located in a quiet residential area with no HOA, the property already has major improvements in place including a 2023 roof and newer HVAC, giving you a strong head start on renovations. The home features a functional split-bedroom floor plan, spacious living areas, and solid bones making it an ideal candidate for a profitable flip, rental property, or long-term hold. Comparable renovated homes in the area support excellent value-add potential. 2023 roof Newer HVAC No HOA Strong rental market Growing Lehigh Acres location Ideal for flip, rental, or long-term investment Property is being sold as-is. Cash or conventional financing preferred. Bring your vision and unlock the potential.
-
2026-02-24historical
-
2026-02-18status Active
-
2026-02-10status Pending
-
2025-12-12status Active
-
2025-10-14status Pending
-
2025-09-29price $189,900
-
2025-08-19$199,500 Active
-
2021-08-04soldstatus $140,000
-
2015-03-02price $17,600
-
2013-09-17price $72,900
-
2010-09-08soldstatus $42,000
-
2010-09-03price $43,500
-
2009-05-14soldstatus $20,000
-
2005-10-03price $159,900
-
2005-08-22soldstatus $125,000
-
2005-08-19soldstatus $125,000
-
2001-03-28soldstatus $75,400
-
2001-03-02soldstatus $75,400
ⓘ Source: listings_history table (triggers on properties + properties_extension) + one-shot
backfill from property_details.listing_events for pre-trigger history.
Tax reassessment forecast FL · Resets to sale price
- Current annual tax
- $2,540 · $212/mo
- Projected year-2 tax
- $2,540 · $212/mo
- Expected delta
- $0/yr ($0/mo · 0.0%)
ⓘ Screening estimate from a state-policy table — verify with the county assessor before closing.
Climate risk First Street
- Flood 1/10 Low FEMA zone X (unshaded) · 0% chance over 30 yrs
- Wildfire 5/10 Major
- Heat 10/10 Extreme 7 d/yr ≥107°F today · 30 d/yr by 30 yrs out
- Wind 10/10 Extreme 99% chance of damaging wind over 30 yrs
- Air quality 2/10 Low 1 unhealthy d/yr today · 1 by 30 yrs out
Nearby sold comps map
Loading sold comps map…
Walkable amenities ~0.75 mi
Loading nearby amenities…
Taxation est. · year 1
- Rental income
- $24,694
- − Mortgage interest
- −$13,948
- − Property taxes
- −$2,540
- − Insurance
- −$1,245
- − Repairs & maintenance
- −$1,975
- − Management
- −$1,975
- − Depreciation
- −$7,244
- Taxable loss
- −$4,234
- Est. tax savings @ 24.0%
- +$1,016
- After-tax cash flow
- $1,070/yr
For passive investors: Depreciation is non-cash, so a rental often shows a tax loss while cash-flowing — sheltering income. Rental losses are passive: they offset passive income freely, and up to $25,000/yr can offset ordinary (W-2) income if you actively participate and your MAGI is under $100k (phasing out to $0 by $150k); unused losses carry forward. On sale, claimed depreciation is recaptured at up to 25%, and gains may owe capital-gains tax (a 1031 exchange can defer both). Figures are a year-1 estimate at your 24.0% rate — not tax advice; consult a CPA.
Schools (NCES district)
- District
- Lee
- NCES district ID
- 1201080
- Math proficiency
- 47% ▼ -11.00%
- Reading proficiency
- 50% ▼ -4.00%
- Median HH income
- $49,518
- Composite
- 41.49/100
- National rank
- #3458
- State rank
- #42 of 73 in FL
Livability — Lehigh Acres
- Score
- 59/100
- State rank
- #826
- US rank
- #20055
Category grades
Schools grade is shown separately in the Schools card above.
Census & demographics
- Census place
- Lehigh Acres, FL
- County
- Lee County · 788,662 people
- City population
- 130,638
- Metro
- Cape Coral-Fort Myers, FL
- Population (ZIP)
- 20,277
- Household income
- $72,679
- Rent vs Own
- Severe rent burden
- 574.0
Population outlook (Lee County) Hauer SSP2
- Today (2025)
- 871,946 people
- By 2030
- 955,468 · +9.6%
- By 2040
- 1,113,587 · +27.7%
- By 2050
- 1,256,891 · +44.1%
- By 2075
- 1,560,270 · +78.9%
- By 2100
- 1,726,848 · +98.0%
Race, ethnicity, and origin ACS 2023
- Neighborhood character
- Diverse neighborhood (Simpson 0.65)
- Race & ethnicity
- Hispanic / Latino 50% Two or more races 30% White 24% Black 20% Asian 3%
- Hispanic origin (detail)
- Mexican 8% Puerto Rican 8% Cuban 18% Dominican 4%
- Common ancestry
- Hispanic 8% Slovak 1% Lithuanian 1%
- Foreign-born
- 35% · Canada, Jamaica, Vietnam
- Languages at home
- 46% English-only · Spanish 43% French/Haitian/Cajun 8% Vietnamese 1%
Political lean MEDSL · Lee
- 2024 margin
- Strong R (+28.4) · D 35.5% · R 63.9%
- 2008→2024 swing
- -18.0pp toward R · 2008: -10.4pp · 2024: -28.4pp
- All cycles
- 2024: R+28.4 2020: R+19.2 2016: R+20.4 2012: R+16.6 2008: R+10.4
Not yet ingested
- Civics
- —
Market trends
- HPI YoY
- ▲ 21.77%
- Current HPI
- 340.4255
- Rent YoY
- ▼ -1.54%
- Metro
- Cape Coral-Fort Myers, FL
- State GDP YoY
- ▲ 3.28%
- F500 in state
- 36
Industry mix (Fortune 500 HQ in FL)
| Industry | F500 HQs | Revenue |
|---|---|---|
| Industrial Technology | 2 | $29B |
|
||
| Insurance | 2 | $17B |
|
||
| Retail | 1 | $60B |
|
||
| Technology Distribution | 1 | $58B |
|
||
| Homebuilding | 1 | $35B |
|
||
| Technology Manufacturing | 1 | $35B |
|
||
Price history
+243.5% since first listed25 events — show timeline
- 2026-05-14 Listed $259,000 NAPLESMLS
- 2026-04-15 Sold (Public Records) $149,000 Public Records
- 2026-04-14 Sold (MLS) $149,000 FORTMLS
- 2026-03-25 Pending — FORTMLS
- 2026-03-17 Relisted — FORTMLS
- 2026-03-11 Pending — FORTMLS
- 2026-02-27 Listed $169,900 FORTMLS
- 2026-02-24 Listing Removed — FORTMLS
- 2026-02-18 Relisted — FORTMLS
- 2026-02-10 Pending — FORTMLS
- 2025-12-12 Relisted — FORTMLS
- 2025-10-14 Pending — FORTMLS
- 2025-09-29 Price Changed $189,900 FORTMLS
- 2025-08-19 Listed $199,500 FORTMLS
- 2021-08-04 Sold (Public Records) $140,000 Public Records
- 2015-03-02 Price Changed $17,600 FORTMLS
- 2013-09-17 Price Changed $72,900 FORTMLS
- 2010-09-08 Sold (MLS) $42,000 FORTMLS
- 2010-09-03 Price Changed $43,500 FORTMLS
- 2009-05-14 Sold (MLS) $20,000 FORTMLS
- 2005-10-03 Price Changed $159,900 FORTMLS
- 2005-08-22 Sold (Public Records) $125,000 Public Records
- 2005-08-19 Sold (MLS) $125,000 FORTMLS
- 2001-03-28 Sold (Public Records) $75,400 Public Records
- 2001-03-02 Sold (MLS) $75,400 FORTMLS
Property tax history
+8.0%/yrLatest (2025): $2,540 · -14.9% YoY. Source: county tax records.
Cash-flow waterfall
monthlySold comps — $/sqft
last 12 mo · ≤1 miLoading sold comps…