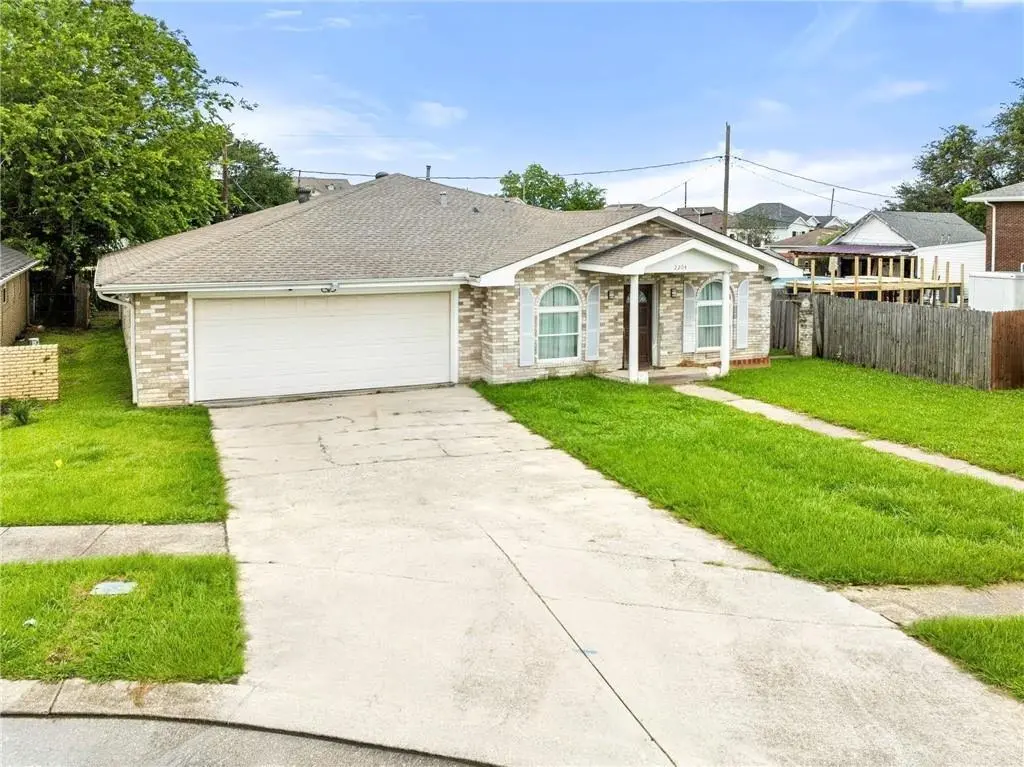
2204 Gallant Dr · Chalmette, LA
Flood risk 8/10 · Major
- FEMA flood zone
- X (shaded)
- Chance of flooding over 30 yrs
- 0.74%
- Est. flood insurance / yr
- $507 – $1,088
Fire risk 1/10 · Minimal
- Est. fire insurance / yr
- $1,269 – $2,357
Heat risk 10/10 · Severe
- Hot days now (above 108°F)
- 7 days/yr
- Hot days in 30 yrs
- 22 days/yr
Wind risk 10/10 · Severe
- Chance of severe wind over 30 yrs
- 99.0%
Air-quality risk 2/10 · Minimal
- Unhealthy air days now
- 2 days/yr
- Unhealthy air days in 30 yrs
- 2 days/yr
Risk factors via First Street. Map © Google.
Why this score? — see what drove the C grade
The composite is a weighted blend of 9 inputs, each scored 0–100. Each bar is that input's sub-score; the figure is the points it added to the 100-point composite (weight × sub-score).
- Cash flow +20.1/30.0
- ARV discount +13.9/15.0
- DSCR +6.4/10.0
- Schools +5.0/10.0
- 1% rule +4.6/10.0
- Rent growth +3.3/5.0
- Livability +3.2/5.0
- Condition / age +2.5/5.0
- Appreciation +0.0/10.0
$229,900
🖨 Deal sheet (PDF) 📄 Offer letter ✓ Due diligence
Listing remarks MLS
Charming 3 bedroom, 2 bathroom home tucked away on a quiet cul-de-sac in an established neighborhood. This property offers a comfortable floor plan with spacious bedrooms, hard-surface flooring throughout, and a practical layout that works well for everyday living. The kitchen and living areas provide an easy flow, while the fully fenced backyard and patio create a great space for relaxing, entertaining, pets, or outdoor gatherings. Major updates include a roof and water heater replaced in 2023, giving buyers added peace of mind. Conveniently located with easy access to nearby shopping, dining, work routes, and city amenities while still offering a neighborhood feel. Located in Flood Zone X. A great opportunity for buyers looking for a move-in ready home in a quiet setting!
Key facts
- Easy access
- Major updates
- Cul-de-sac
Tags
Property features AI
Finance
- HOA & community: Common grounds/area
Exterior
- Parking: Attached garage with two spaces
- Utilities: Public water; Public sewer
- Home design: Single-story; Very good condition
- Construction: Brick construction; Shingle roof; Slab foundation; Built with very good condition
- Exterior features: Fenced yard; Concrete covered patio/porch; City lot; Rectangular lot; Lot dimensions approximately 29 x 37 x 87 x 60 x 110
Interior
- Kitchen: Dishwasher; Oven; Range
- Bedrooms: Total rooms: 7
- Bathrooms: 2 full bathrooms
- Heating & cooling: Central heating; Central air conditioning
- Interior features: Ceiling fan(s); Wood-burning fireplace
- Laundry & utility: Washer hookup; Dryer hookup
Neighborhood map
What this means for you Summary
Snapshot
- This is a 3-bed/2.0-bath single-family listed at $230k.
Deal economics
- At list price, monthly cash flow is $218 ($3k/yr) — positive.
- The deal already cash-flows at list — no discount required.
- To meet the 1% rule (rent ≥ 1% of price), the offer needs to be $220k (4.4% below list).
- Recommended offer: $220k (4.4% below list) — sets the bar for 1% rule.
- Cap rate 7.8% vs local median 5.4% in Chalmette — top-decile yield for the area; either an underpriced asset or a hidden risk that comps aren't pricing in. Stress-test before assuming the spread holds.
Location & tenants
- Location reads 65/100 on livability (#137 in LA) — a middle-class / working-renter tenant base. Strengths: cost of living A+, housing A+, health & safety A; Watch: crime F, amenities F, commute F.
- Market conditions: Rents rising (+3.1%/yr); 213 active listings in the ZIP; 19 comparable units currently listed for rent nearby; rentals leasing fast (median 12d on market — plan ~1-2 weeks tenant-placement turnaround); 112 units permitted in St. Bernard Parish in 2024 (0 in 5+ unit buildings).
- At $2,197/mo this rent would consume 48% of the median local household income ($55k/yr) (locally 881% of renters already pay >50% of income on rent) — very limited rent-growth headroom before tenants either downsize or default.
Forward outlook
- Local home prices are declining (-3.0%/yr); year-one equity from $2k of loan paydown is wiped out by about $7k of value loss. Plan a longer hold.
- St. Bernard County population projected at +89% by 2050 — long-run rental-demand tailwind backs the buy-and-hold thesis.
Negotiation context
- It's been on market 19 days — a 2% lower offer ($226k) is reasonable based on typical stale-listing flexibility.
- 6 sale attempts since 2y ago with the ask held roughly flat each time — persistent listings suggest the price (not the market) is what's stuck; bring a comps-based counter.
- Current owner paid $130k; list at $230k implies a 77% gain — meaningful room to come down on a strong offer.
Risks & watch-outs
- Watch-outs: flood insurance adds $66/mo.
- Climate carrying-cost: severe flood risk; severe wind risk, 99% chance of damaging wind over 30y; extreme-heat days projected 7→22/yr by 2055 (HVAC capex compounding) — expect insurance premiums to compound above CPI over the hold.
Questions for the listing agent
- Built in 1968 — when were the roof, HVAC, electrical panel, plumbing, and water heater last replaced?
- What's the actual annual flood-insurance premium (NFIP or private), and is the property in a SFHA with mandatory coverage?
- Is there a deadline driving the sale (1031 exchange, divorce, estate, relocation)? That informs how much negotiation room exists.
- Crime grade is F in this area — have there been break-ins, vandalism, or insurance claims at this property in the last 3 years? What carrier currently insures it and at what premium?
- What's the average days-on-market for RENTAL listings here right now (not sales)? A rising rental-DOM trend means longer vacancies and softer asking-rent achievability than the comps imply.
- What's the recent tenant-quality profile in this submarket — average credit score on applications, eviction rate, late-payment / NSF rate, and stable-employment percentage? A property-management company in the area should have these aggregated.
- How much new for-sale + rental construction is in the pipeline within 1–3 miles? Heavy new supply typically softens prices + rents 12–24 months out; constrained supply supports both.
Investment metrics
- 1% rule
- 0.96% ✗
- Cap rate
- 7.78%
- Cash-on-cash
- 5.29%
- DSCR
- 1.24
- GRM
- 8.7
CMA / ARV
- ARV (on-the-fly)
- $268,176
- Comps found
- 12
Show comp detail 12 sales within ~0.75 mi
| Address | Dist | Beds/Ba | Sqft | Sold | Price | $/sf | Match |
|---|---|---|---|---|---|---|---|
| 2700 Creely Dr | 0.25mi | 3/2.0 | 1,720 (-3%) | 4mo | $269,000 | $156 | 80 |
| 2204 Congressman Hebert Dr | 0.32mi | 3/2.0 | 1,831 (+3%) | 1mo | $319,000 | $174 | 79 |
| 67 W Claiborne Sq | 0.47mi | 3/2.0 | 1,728 (-3%) | 5mo | $285,000 | $165 | 69 |
| 300 Parish Dr | 0.56mi | 3/2.0 | 1,822 (+3%) | 2mo | $239,900 | $132 | 68 |
| 2329 Congressman Hebert Dr | 0.45mi | 3/2.0 | 1,606 (-10%) | 4mo | $299,900 | $187 | 60 |
| 8416 Colonel Dr | 0.38mi | 3/2.0 | 1,560 (-12%) | 3mo | $205,000 | $131 | 60 |
| 2400 Creely Dr | 0.14mi | 4/2.0 (+1) | 1,525 (-14%) | 9mo | $115,000 | $75 | 58 |
| 59 E Carolina Dr | 0.72mi | 3/2.5 | 1,700 (-4%) | 7mo | $227,500 | $134 | 52 |
| 61 Cochrane Dr | 0.55mi | 4/2.0 (+1) | 1,912 (+8%) | 9mo | $260,000 | $136 | 49 |
| 120 Livingston Ave | 0.74mi | 3/2.0 | 1,559 (-12%) | 1mo | $235,000 | $151 | 44 |
| 8829 Livingston Ave | 0.72mi | 3/2.0 | 1,556 (-12%) | 4mo | $222,000 | $143 | 42 |
| 200 Perrin Dr | 0.73mi | 4/2.5 (+1) | 1,956 (+10%) | 8mo | $335,000 | $171 | 36 |
Match score weights: distance 35% · size 25% · config 20% · recency 20%. Top-matched comps best support the ARV.
Projected returns pro-forma
-3.0% appreciation · 3.11% rent growth · sell at horizon
- IRR
- -9.8%
- Equity multiple
- 0.64×
- Total profit
- $-23,163
- Equity at exit
- $34,279
- IRR
- -0.3%
- Equity multiple
- 0.98×
- Total profit
- $-1,367
- Equity at exit
- $19,878
Cash invested: $64,372 (down + closing). Projections, not guarantees.
Landlord ↔ Tenant lean methodology
- Overall (STATE)
- 90 Strongly Landlord-Friendly
- State Louisiana
- 90 Strongly Landlord-Friendly · R+12
- County
- — inherits STATE
- City
- — inherits STATE
ZIP-level market 70043
- Rents YoY
- 3.1%
- Active inventory
- 213
- Price-to-rent
- 8.7×
Monthly cashflow live
- Estimated rent
- $2,197 high interval (Pro) →
- Mortgage (P&I)
- −$1,206
- Tax from tax record
- −$150 /mo · $1,803/yr
- Insurance
- −$96
- Flood insurance flood zone
- −$66 /mo · $798/yr
- HOA
- −$0
- Vacancy / Maint / Mgmt
- −$461
- Net cashflow
- $218
Break-even live
Sensitivity live
| Price | -10% $348 | -5% $283 | +0% $218 | +5% $153 | +10% $87 |
|---|---|---|---|---|---|
| Rent | -10% $44 | -5% $131 | +0% $218 | +5% $304 | +10% $391 |
| Rate | -1.0pp $333 | -0.5pp $276 | base $218 | +0.5pp $158 | +1.0pp $97 |
UW: 25.0% down · 7.5% · 30yr · 1.5% tax · 5.0% vac · 8.0% maint · 8.0% mgmt
Financing live
Cash to close
- Down payment
- $57,475
- Closing costs
- $6,897
- Reserves months
- —
- Total cash needed
- —
Loan-product check · same deal, 3 products live
Conventional
25% down · 7.5% · 30yr
- Down + closing
- —
- Monthly P&I
- —
- Monthly cashflow
- —
- DSCR
- —
- Eligible?
- —
Personal DTI + credit; lowest rate.
DSCR
20% down · 8.5% · 30yr
- Down + closing
- —
- Monthly P&I
- —
- Monthly cashflow
- —
- DSCR
- —
- Eligible?
- —
No personal income docs; deal must DSCR.
Hard money
10% down · 12.0% · 12mo
- Down + closing
- —
- Monthly P&I
- —
- Monthly cashflow
- —
- DSCR
- —
- Eligible?
- —
Short-term bridge; refi at stabilization.
Rent comps 19 comps
| Address | Beds | Baths | Sqft | Rent | $/sqft | DOM | Units | Dist |
|---|---|---|---|---|---|---|---|---|
| 114 8th St Chalmette, LA | 3.0 | 1.0 | 1275 | $1,695 | $1.33 | 45d | 1 | 0.28mi |
| 32 Old Hickory St Chalmette, LA | 4.0 | 2.0 | 1379 | $1,850 | $1.34 | 24d | 1 | 0.83mi |
| 309 Fawn Dr Arabi, LA | 3.0 | 2.5 | 1745 | $2,500 | $1.43 | 2d | 1 | 0.89mi |
| 1239 Center St Arabi, LA | 4.0 | 2.0 | 1922 | $3,500 | $1.82 | 4d | 1 | 0.91mi |
| 1511 Schnell Dr Arabi, LA | 4.0 | 3.0 | 1700 | $1,850 | $1.09 | 4d | 1 | 0.98mi |
| 438 Friscoville Ave Arabi, LA | 3.0 | 2.0 | 1500 | $3,200 | $2.13 | 4d | 1 | 1.04mi |
| 1529 Schnell Dr Arabi, LA | 3.0 | 2.5 | 1736 | $2,600 | $1.50 | 2d | 1 | 1.04mi |
| 424 Chinchilla Dr Arabi, LA | 3.0 | 2.0 | 1735 | $3,500 | $2.02 | 17d | 1 | 1.05mi |
| 6900 Royal St Arabi, LA | 3.0 | 2.0 | 1579 | $5,888 | $3.73 | 4d | 1 | 1.07mi |
| 2707 Jackson Blvd Chalmette, LA | 3.0 | 3.0 | 1733 | $2,300 | $1.33 | 45d | 1 | 1.08mi |
| 2707 Jackson Blvd Chalmette, LA | 3.0 | 2.5 | 1733 | $2,300 | $1.33 | 24d | 1 | 1.08mi |
| 7532 Patricia St Arabi, LA | 3.0 | 2.0 | 1850 | $1,900 | $1.03 | 3d | 1 | 1.08mi |
| 7532 Patricia St Arabi, LA | 3.0 | 2.0 | 1850 | $1,900 | $1.03 | 4d | 1 | 1.08mi |
| 7532 Patricia St Arabi, LA | 4.0 | 3.0 | 2099 | $2,200 | $1.05 | 45d | 1 | 1.09mi |
| 8600 Patricia St Chalmette, LA | 3.0 | 2.0 | 1255 | $1,550 | $1.24 | 24d | 1 | 1.15mi |
| 103 Danny Dr New Orleans, LA | 4.0 | 2.0 | 2040 | $2,400 | $1.18 | 24d | 1 | 1.27mi |
| 8413 Benjamin Dr Chalmette, LA | 3.0 | 2.0 | 1800 | $2,300 | $1.28 | 4d | 1 | 1.38mi |
| 3606 Pakenham Dr Unit 3606 Chalmette, LA | 3.0 | 2.0 | 1400 | $1,800 | $1.29 | 13d | 1 | 1.39mi |
| 2012 Esteban St Arabi, LA | 3.0 | 2.0 | 1466 | $2,500 | $1.71 | 11d | 1 | 1.46mi |
Listing history 12 events
-
2026-06-21days on market $229,900 Active 19 DOM
-
2026-06-18days on market $229,900 Active 16 DOM
-
2026-06-17days on market $229,900 Active 15 DOM
-
2026-06-16days on market $229,900 Active 14 DOM
-
2026-06-15days on market $229,900 Active 13 DOM
-
2026-06-13days on market $229,900 Active 11 DOM
-
2026-06-10days on market $229,900 Active 8 DOM
-
2026-06-09days on market $229,900 Active 7 DOM
-
2026-06-08days on market $229,900 Active 6 DOM
-
2026-06-07days on market $229,900 Active 5 DOM
-
2026-06-03remarks 699-char remark
-
2026-06-03$229,900 Active 1 DOM
ⓘ Source: listings_history table (triggers on properties + properties_extension) + one-shot
backfill from property_details.listing_events for pre-trigger history.
Tax reassessment forecast LA · Resets to sale price
- Current annual tax
- $1,803 · $150/mo
- Projected year-2 tax
- $1,803 · $150/mo
- Expected delta
- $0/yr ($0/mo · 0.0%)
ⓘ Screening estimate from a state-policy table — verify with the county assessor before closing.
Climate risk First Street
- Flood 8/10 Severe FEMA zone X (shaded) · 74% chance over 30 yrs
- Wildfire 1/10 Low
- Heat 10/10 Extreme 7 d/yr ≥108°F today · 22 d/yr by 30 yrs out
- Wind 10/10 Extreme 99% chance of damaging wind over 30 yrs
- Air quality 2/10 Low 2 unhealthy d/yr today · 2 by 30 yrs out
Nearby sold comps map
Loading sold comps map…
Walkable amenities ~0.75 mi
Loading nearby amenities…
Taxation est. · year 1
- Rental income
- $26,365
- − Mortgage interest
- −$12,878
- − Property taxes
- −$1,803
- − Insurance
- −$1,947
- − Repairs & maintenance
- −$2,109
- − Management
- −$2,109
- − Depreciation
- −$6,688
- Taxable loss
- −$1,169
- Est. tax savings @ 24.0%
- +$281
- After-tax cash flow
- $2,892/yr
For passive investors: Depreciation is non-cash, so a rental often shows a tax loss while cash-flowing — sheltering income. Rental losses are passive: they offset passive income freely, and up to $25,000/yr can offset ordinary (W-2) income if you actively participate and your MAGI is under $100k (phasing out to $0 by $150k); unused losses carry forward. On sale, claimed depreciation is recaptured at up to 25%, and gains may owe capital-gains tax (a 1031 exchange can defer both). Figures are a year-1 estimate at your 24.0% rate — not tax advice; consult a CPA.
Schools (NCES district)
No district data.
Livability — Chalmette
- Score
- 65/100
- State rank
- #137
- US rank
- #12500
Category grades
Schools grade is shown separately in the Schools card above.
Census & demographics
- Census place
- Chalmette, LA
- County
- Saint Bernard Parish · 22,638 people
- City population
- 22,638
- Metro
- New Orleans-Metairie, LA
- Population (ZIP)
- 22,638
- Household income
- $55,068
- Rent vs Own
- Severe rent burden
- 881.0
Population outlook (St. Bernard County) Hauer SSP2
- Today (2025)
- 66,513 people
- By 2030
- 77,768 · +16.9%
- By 2040
- 101,296 · +52.3%
- By 2050
- 125,770 · +89.1%
- By 2075
- 188,160 · +182.9%
- By 2100
- 239,339 · +259.8%
Race, ethnicity, and origin ACS 2023
- Neighborhood character
- Diverse neighborhood (Simpson 0.61)
- Race & ethnicity
- White 55% Black 26% Hispanic / Latino 12% Two or more races 10% Asian 2%
- Hispanic origin (detail)
- Mexican 2%
- Common ancestry
- Lithuanian 13% Slovak 2%
- Foreign-born
- 6% · Canada, Vietnam
- Languages at home
- 88% English-only · Spanish 8% Arabic 1% Vietnamese 1%
Political lean MEDSL · St. Bernard
- 2024 margin
- Strong R (+29.3) · D 34.5% · R 63.8% · Other 1.7%
- 2008→2024 swing
- +16.1pp toward D · 2008: -45.4pp · 2024: -29.3pp
- All cycles
- 2024: R+29.3 2020: R+28.5 2016: R+33.4 2012: R+24.7 2008: R+45.4
Not yet ingested
- Civics
- —
Market trends
- HPI YoY
- ▼ -211.77%
- Current HPI
- 194.8123
- Rent YoY
- ▲ 3.11%
- Metro
- New Orleans-Metairie, LA
- State GDP YoY
- ▲ 3.29%
- F500 in state
- 10
Industry mix (Fortune 500 HQ in LA)
| Industry | F500 HQs | Revenue |
|---|---|---|
| Telecommunications | 2 | $23B |
|
||
| Utilities | 1 | $12B |
|
||
| Wholesale / Distribution | 1 | $5B |
|
||
| Advertising | 1 | $2B |
|
||
Price history
+76.8% since first listed14 events — show timeline
- 2026-06-02 Listed $229,900 GSREIN
- 2026-06-02 Listed $229,900 AcadianaMLS
- 2025-10-31 Listed $230,000 AcadianaMLS
- 2025-08-21 Rental Removed $1,750 GSREIN
- 2025-08-09 Listed for Rent $1,750 GSREIN
- 2025-07-14 Price Changed $230,000 AcadianaMLS
- 2025-07-14 Price Changed $230,000 GSREIN
- 2025-04-30 Listed $239,000 AcadianaMLS
- 2025-03-24 Price Changed $239,000 AcadianaMLS
- 2025-03-24 Price Changed $239,000 GSREIN
- 2024-12-04 Price Changed $249,000 AcadianaMLS
- 2024-12-04 Price Changed $249,000 GSREIN
- 2024-10-28 Listed $259,000 AcadianaMLS
- 2005-07-25 Sold (Public Records) $130,000 Public Records
Property tax history
+2.1%/yrLatest (2025): $1,803 · -0.7% YoY. Source: county tax records.
Cash-flow waterfall
monthlySold comps — $/sqft
last 12 mo · ≤1 miLoading sold comps…