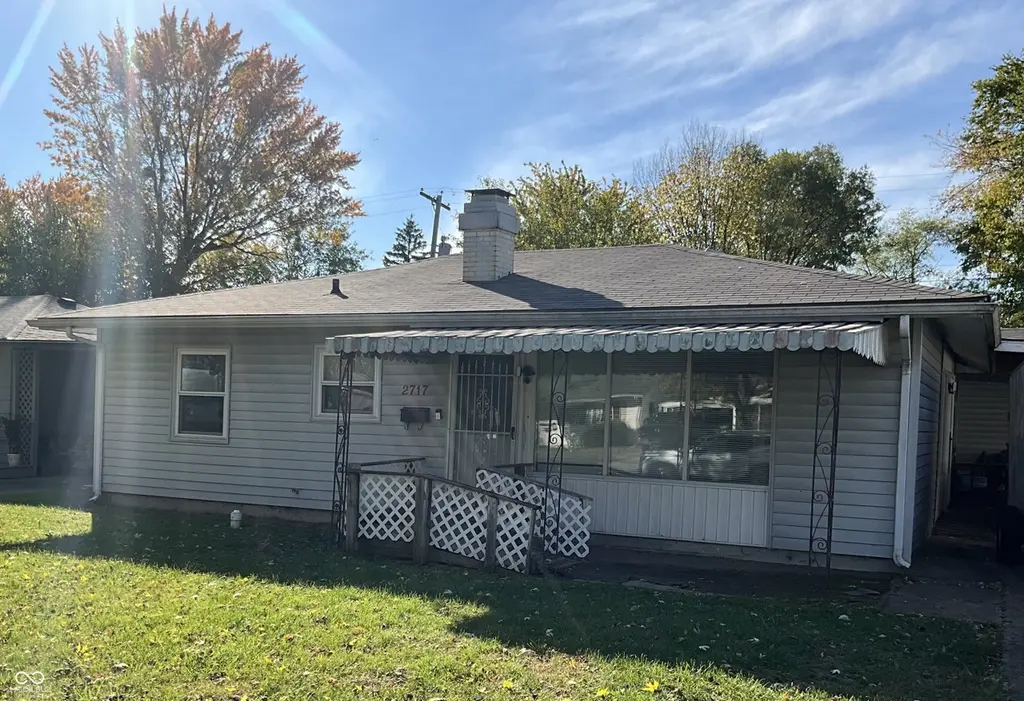
2717 Apache Dr · Anderson, IN
Flood risk 1/10 · Minimal
- FEMA flood zone
- X (unshaded)
- Chance of flooding over 30 yrs
- 0.0%
- Est. flood insurance / yr
- $507 – $1,088
Fire risk 1/10 · Minimal
- Est. fire insurance / yr
- $717 – $1,331
Heat risk 3/10 · Minor
- Hot days now (above 100°F)
- 7 days/yr
- Hot days in 30 yrs
- 18 days/yr
Wind risk 2/10 · Minimal
- Chance of severe wind over 30 yrs
- 0.0%
Air-quality risk 3/10 · Minor
- Unhealthy air days now
- 2 days/yr
- Unhealthy air days in 30 yrs
- 3 days/yr
Risk factors via First Street. Map © Google.
Why this score? — see what drove the B- grade
The composite is a weighted blend of 9 inputs, each scored 0–100. Each bar is that input's sub-score; the figure is the points it added to the 100-point composite (weight × sub-score).
- Cash flow +25.5/30.0
- ARV discount +15.0/15.0
- DSCR +8.5/10.0
- 1% rule +6.5/10.0
- Rent growth +3.0/5.0
- Livability +3.0/5.0
- Condition / age +2.5/5.0
- Schools +1.6/10.0
- Appreciation +0.0/10.0
$110,900
🖨 Deal sheet 📄 Offer letter ✓ Due diligence
Listing remarks MLS
Welcome home to this affordable and move-in ready property located at 2717 Apache Dr. in Anderson! Priced at just $110,900, this home features several recent updates including a newer roof within the last couple of years, stylish vinyl plank flooring throughout, updated bathroom fixtures and facilities, and new carpeting. Conveniently located close to shopping, dining, and everyday amenities, this home offers both comfort and value. Don't miss your opportunity to own this well-maintained home priced to sell! With 1542 square feet of living area, the residence provides generous space for relaxation and comfort.
Key facts
- 6,655 sq ft lot
- Built 1953
- Listed 233 days
Neighborhood map
What this means for you Summary
Snapshot
- This is a 2-bed/1.0-bath single-family listed at $111k.
Deal economics
- At list price, monthly cash flow is $260 ($3k/yr) — positive.
- The deal already cash-flows at list — no discount required.
- Meets the 1% rule at list price ($1k rent vs $111k).
- Recommended offer: $98k (12.0% below list) — sets the bar for market timing.
- Cap rate 9.1% vs local median 6.5% in Anderson — top-decile yield for the area; either an underpriced asset or a hidden risk that comps aren't pricing in. Stress-test before assuming the spread holds.
Location & tenants
- Location reads 60/100 on livability (#521 in IN) — a middle-class / working-renter tenant base. Strengths: cost of living A+, housing A+; Watch: schools F, crime D-, amenities F.
- Anderson Community School Corporation (urban): math 15% / reading 23% proficiency, ranked #280 of 301 in IN (top 93%) — low school quality limits family demand, transient renter base, plan for 1-2y turnover; 70% free/reduced lunch — lower-income household profile, screen leases tightly.
- Market conditions: Rents rising (+1.8%/yr); 159 active listings in the ZIP; 3 comparable units currently listed for rent nearby; rentals at typical pace (median 16d on market — plan ~3-4 weeks tenant-placement turnaround); 184 units permitted in Madison County in 2024 (0 in 5+ unit buildings).
Forward outlook
- Local home prices are declining (-3.0%/yr); year-one equity from $767 of loan paydown is wiped out by about $3k of value loss. Plan a longer hold.
- Madison County population projected at -14% by 2050 — secular population decline; favor cash flow + early exit over multi-decade hold.
Negotiation context
- It's been on market 233 days — a 12% lower offer ($98k) is reasonable based on typical stale-listing flexibility.
Risks & watch-outs
- Watch-outs: built in 1953 — expect roof / HVAC / electrical / plumbing capex.
Questions for the listing agent
- It's been on market 233 days. Have you received any prior offers? Is the seller open to a 12% concession, seller financing, or rate buy-down credit?
- Built in 1953 — when were the roof, HVAC, electrical panel, plumbing, and water heater last replaced?
- Why hasn't it sold? Are there any deal-killer items the seller is aware of (foundation, flood, title, zoning, code violations)?
- Is there a deadline driving the sale (1031 exchange, divorce, estate, relocation)? That informs how much negotiation room exists.
- Schools are F-rated, which usually means shorter tenancies and higher turnover. Who's the typical renter profile here, and what's been the actual vacancy rate?
- Crime grade is D in this area — have there been break-ins, vandalism, or insurance claims at this property in the last 3 years? What carrier currently insures it and at what premium?
- What's the average days-on-market for RENTAL listings here right now (not sales)? A rising rental-DOM trend means longer vacancies and softer asking-rent achievability than the comps imply.
- What's the recent tenant-quality profile in this submarket — average credit score on applications, eviction rate, late-payment / NSF rate, and stable-employment percentage? A property-management company in the area should have these aggregated.
- How much new for-sale + rental construction is in the pipeline within 1–3 miles? Heavy new supply typically softens prices + rents 12–24 months out; constrained supply supports both.
Investment metrics
- 1% rule
- 1.15% ✓
- Cap rate
- 9.10%
- Cash-on-cash
- 10.03%
- DSCR
- 1.45
- GRM
- 7.3
CMA / ARV
- ARV (median comp)
- $148,358
- List price
- $110,900
- Delta
- -25.25%
- Verdict
- UNDERPRICED
- Comps
- 20 within 1.0 mi
Show comp detail 6 sales within ~0.75 mi
| Address | Dist | Beds/Ba | Sqft | Sold | Price | $/sf | Match |
|---|---|---|---|---|---|---|---|
| 318 E 300 N | 0.46mi | 3/1.5 (+1) | 1,468 (-5%) | 1mo | $250,000 | $170 | 62 |
| 224 E Cross St | 0.70mi | 2/1.0 | 1,440 (-7%) | 2mo | $50,000 | $35 | 55 |
| 1328 Toner Dr | 0.55mi | 3/2.0 (+1) | 1,600 (+4%) | 11mo | $289,900 | $181 | 49 |
| 3215 Alexandria Pike | 0.75mi | 3/1.5 (+1) | 1,440 (-7%) | 3mo | $245,900 | $171 | 44 |
| 2025 Crystal St | 0.68mi | 2/2.0 | 1,404 (-9%) | 21mo | $128,000 | $91 | 32 |
| 1342 S Durbin Dr | 0.70mi | 3/2.0 (+1) | 1,323 (-14%) | 10mo | $224,900 | $170 | 26 |
Match score weights: distance 35% · size 25% · config 20% · recency 20%. Top-matched comps best support the ARV.
Projected returns pro-forma
-3.0% appreciation · 1.82% rent growth · sell at horizon
- IRR
- -2.5%
- Equity multiple
- 0.91×
- Total profit
- $-2,922
- Equity at exit
- $16,536
- IRR
- 5.9%
- Equity multiple
- 1.41×
- Total profit
- $12,790
- Equity at exit
- $9,589
Cash invested: $31,052 (down + closing). Projections, not guarantees.
Landlord ↔ Tenant lean methodology
- Overall (STATE)
- 90 Strongly Landlord-Friendly
- State Indiana
- 90 Strongly Landlord-Friendly · R+11
- County
- — inherits STATE
- City
- — inherits STATE
ZIP-level market 46012
- Home prices YoY
- -18.6%
- Rents YoY
- 1.8%
- Active inventory
- 159
- Price-to-rent
- 7.3×
Monthly cashflow live
- Estimated rent
- $1,273 medium interval (Pro) →
- Mortgage (P&I)
- −$582
- Tax from tax record
- −$118 /mo · $1,416/yr
- Insurance
- −$46
- HOA
- −$0
- Vacancy / Maint / Mgmt
- −$267
- Net cashflow
- $260
Break-even live
UW: 25.0% down · 7.5% · 30yr · 1.5% tax · 5.0% vac · 8.0% maint · 8.0% mgmt
Financing live
Cash to close
- Down payment
- $27,725
- Closing costs
- $3,327
- Reserves months
- —
- Total cash needed
- —
Loan-product check · same deal, 3 products live
Conventional
25% down · 7.5% · 30yr
- Down + closing
- —
- Monthly P&I
- —
- Monthly cashflow
- —
- DSCR
- —
- Eligible?
- —
Personal DTI + credit; lowest rate.
DSCR
20% down · 8.5% · 30yr
- Down + closing
- —
- Monthly P&I
- —
- Monthly cashflow
- —
- DSCR
- —
- Eligible?
- —
No personal income docs; deal must DSCR.
Hard money
10% down · 12.0% · 12mo
- Down + closing
- —
- Monthly P&I
- —
- Monthly cashflow
- —
- DSCR
- —
- Eligible?
- —
Short-term bridge; refi at stabilization.
Rent comps 3 comps
| Address | Beds | Baths | Sqft | Rent | $/sqft | DOM | Units | Dist |
|---|---|---|---|---|---|---|---|---|
| 220 W Willow St Anderson, IN | 3.0 | 1.0 | 1200 | $1,250 | $1.04 | 1d | 1 | 0.55mi |
| 632 W 300 N Anderson, IN | 3.0 | 1.0 | 1196 | $1,395 | $1.17 | 44d | 1 | 0.72mi |
| 521 W Vinyard St Anderson, IN | 3.0 | 2.0 | 1712 | $1,495 | $0.87 | 16d | 1 | 1.29mi |
Listing history 15 events
-
2026-06-18days on market $110,900 Active 233 DOM
-
2026-06-17days on market $110,900 Active 232 DOM
-
2026-06-16days on market $110,900 Active 231 DOM
-
2026-06-15days on market $110,900 Active 230 DOM
-
2026-06-13days on market $110,900 Active 228 DOM
-
2026-06-09days on market $110,900 Active 224 DOM
-
2026-06-08days on market $110,900 Active 223 DOM
-
2026-06-07days on market $110,900 Active 222 DOM
-
2026-06-05days on market $110,900 Active 219 DOM
-
2026-06-03days on market $110,900 Active 218 DOM
-
2026-06-02days on market $110,900 Active 217 DOM
-
2026-06-01days on market $110,900 Active 216 DOM
-
2026-05-31days on market $110,900 Active 215 DOM
-
2026-05-14price $110,900 617-char remark
Show marketing remark (617 chars)
Welcome home to this affordable and move-in ready property located at 2717 Apache Dr. in Anderson! Priced at just $110,900, this home features several recent updates including a newer roof within the last couple of years, stylish vinyl plank flooring throughout, updated bathroom fixtures and facilities, and new carpeting. Conveniently located close to shopping, dining, and everyday amenities, this home offers both comfort and value. Don't miss your opportunity to own this well-maintained home priced to sell! With 1542 square feet of living area, the residence provides generous space for relaxation and comfort.
-
2025-10-26$119,900 Active 617-char remark
Show marketing remark (617 chars)
Welcome home to this affordable and move-in ready property located at 2717 Apache Dr. in Anderson! Priced at just $110,900, this home features several recent updates including a newer roof within the last couple of years, stylish vinyl plank flooring throughout, updated bathroom fixtures and facilities, and new carpeting. Conveniently located close to shopping, dining, and everyday amenities, this home offers both comfort and value. Don't miss your opportunity to own this well-maintained home priced to sell! With 1542 square feet of living area, the residence provides generous space for relaxation and comfort.
ⓘ Source: listings_history table (triggers on properties + properties_extension) + one-shot
backfill from property_details.listing_events for pre-trigger history.
Tax reassessment forecast IN · Partial reset (capped growth)
- Current annual tax
- $1,416 · $118/mo
- Projected year-2 tax
- $1,416 · $118/mo
- Expected delta
- $0/yr ($0/mo · 0.0%)
ⓘ Screening estimate from a state-policy table — verify with the county assessor before closing.
Climate risk First Street
- Flood 1/10 Low FEMA zone X (unshaded) · 0% chance over 30 yrs
- Wildfire 1/10 Low
- Heat 3/10 Moderate 7 d/yr ≥100°F today · 18 d/yr by 30 yrs out
- Wind 2/10 Low 0% chance of damaging wind over 30 yrs
- Air quality 3/10 Moderate 2 unhealthy d/yr today · 3 by 30 yrs out
Nearby sold comps map
Loading sold comps map…
Walkable amenities ~0.75 mi
Loading nearby amenities…
Taxation est. · year 1
- Rental income
- $15,271
- − Mortgage interest
- −$6,212
- − Property taxes
- −$1,416
- − Insurance
- −$554
- − Repairs & maintenance
- −$1,222
- − Management
- −$1,222
- − Depreciation
- −$3,226
- Taxable income
- $1,420
- Est. tax owed @ 24.0%
- −$341
- After-tax cash flow
- $2,775/yr
For passive investors: Depreciation is non-cash, so a rental often shows a tax loss while cash-flowing — sheltering income. Rental losses are passive: they offset passive income freely, and up to $25,000/yr can offset ordinary (W-2) income if you actively participate and your MAGI is under $100k (phasing out to $0 by $150k); unused losses carry forward. On sale, claimed depreciation is recaptured at up to 25%, and gains may owe capital-gains tax (a 1031 exchange can defer both). Figures are a year-1 estimate at your 24.0% rate — not tax advice; consult a CPA.
Schools (NCES district)
- District
- Anderson Community School Corporation
- NCES district ID
- 1800150
- Math proficiency
- 15% ▼ -14.00%
- Reading proficiency
- 23% ▼ -7.00%
- Median HH income
- $38,208
- Composite
- 15.93/100
- National rank
- #9250
- State rank
- #280 of 301 in IN
Livability — Anderson
- Score
- 60/100
- State rank
- #521
- US rank
- #18709
Category grades
Schools grade is shown separately in the Schools card above.
Census & demographics
- Census place
- Anderson, IN
- County
- Madison County · 69,445 people
- City population
- 57,762
- Metro
- Indianapolis-Carmel-Anderson, IN
- Population (ZIP)
- 20,855
- Household income
- $58,041
- Rent vs Own
- Severe rent burden
- 987.0
Population outlook (Madison County) Hauer SSP2
- Today (2025)
- 125,800 people
- By 2030
- 122,640 · -2.5%
- By 2040
- 115,420 · -8.3%
- By 2050
- 108,148 · -14.0%
- By 2075
- 91,838 · -27.0%
- By 2100
- 75,670 · -39.8%
Race, ethnicity, and origin ACS 2023
- Neighborhood character
- Predominantly White (85%)
- Race & ethnicity
- White 85% Hispanic / Latino 5% Two or more races 4% Black 4%
- Hispanic origin (detail)
- Mexican 4%
- Common ancestry
- Slovak 3% Serbian 2% Italian 1%
- Foreign-born
- 2% · Canada, Vietnam
- Languages at home
- 96% English-only · Spanish 3%
Political lean MEDSL · Madison
- 2024 margin
- Strong R (+26.9) · D 35.6% · R 62.5% · Other 1.9%
- 2008→2024 swing
- -33.5pp toward R · 2008: 6.5pp · 2024: -26.9pp
- All cycles
- 2024: R+26.9 2020: R+22.6 2016: R+25.7 2012: R+4.5 2008: D+6.5
Not yet ingested
- Civics
- —
Market trends
- HPI YoY
- ▼ -61.16%
- Current HPI
- 266.9819
- Rent YoY
- ▲ 1.82%
- Metro
- Indianapolis-Carmel-Anderson, IN
- State GDP YoY
- ▲ 2.90%
- F500 in state
- 18
Industry mix (Fortune 500 HQ in IN)
| Industry | F500 HQs | Revenue |
|---|---|---|
| Industrial Machinery | 2 | $37B |
|
||
| Healthcare | 1 | $177B |
|
||
| Pharmaceuticals | 1 | $45B |
|
||
| Metals / Steel | 1 | $18B |
|
||
| Agriculture | 1 | $17B |
|
||
| Packaging | 1 | $12B |
|
||
Price history
-7.5% since first listed2 events — show timeline
- 2026-05-14 Price Changed $110,900 MIBOR as Distributed by MLS Grid
- 2025-10-26 Listed $119,900 MIBOR as Distributed by MLS Grid
Property tax history
+1.5%/yrLatest (2024): $1,416 · +129.0% YoY. Source: county tax records.
Cash-flow waterfall
monthlySold comps — $/sqft
last 12 mo · ≤1 miLoading sold comps…