8270 W Meadow Brook Cir · Rathdrum, ID
Flood risk 9/10 · Severe
- FEMA flood zone
- AE
- Chance of flooding over 30 yrs
- 0.99%
- Est. flood insurance / yr
- $1,737 – $8,500
Fire risk 6/10 · Moderate
- Est. fire insurance / yr
- $584 – $1,086
Heat risk 2/10 · Minimal
- Hot days now (above 92°F)
- 7 days/yr
- Hot days in 30 yrs
- 15 days/yr
Wind risk 1/10 · Minimal
- Chance of severe wind over 30 yrs
- —
Air-quality risk 8/10 · Major
- Unhealthy air days now
- 15 days/yr
- Unhealthy air days in 30 yrs
- 16 days/yr
Risk factors via First Street. Map © Google.
Why this score? — see what drove the B grade
The composite is a weighted blend of 9 inputs, each scored 0–100. Each bar is that input's sub-score; the figure is the points it added to the 100-point composite (weight × sub-score).
- Cash flow +30.0/30.0
- 1% rule +10.0/10.0
- DSCR +10.0/10.0
- ARV discount +7.5/15.0
- Schools +4.2/10.0
- Livability +3.7/5.0
- Rent growth +2.5/5.0
- Condition / age +2.5/5.0
- Appreciation +0.0/10.0
$99,900
🖨 Deal sheet 📄 Offer letter ✓ Due diligence
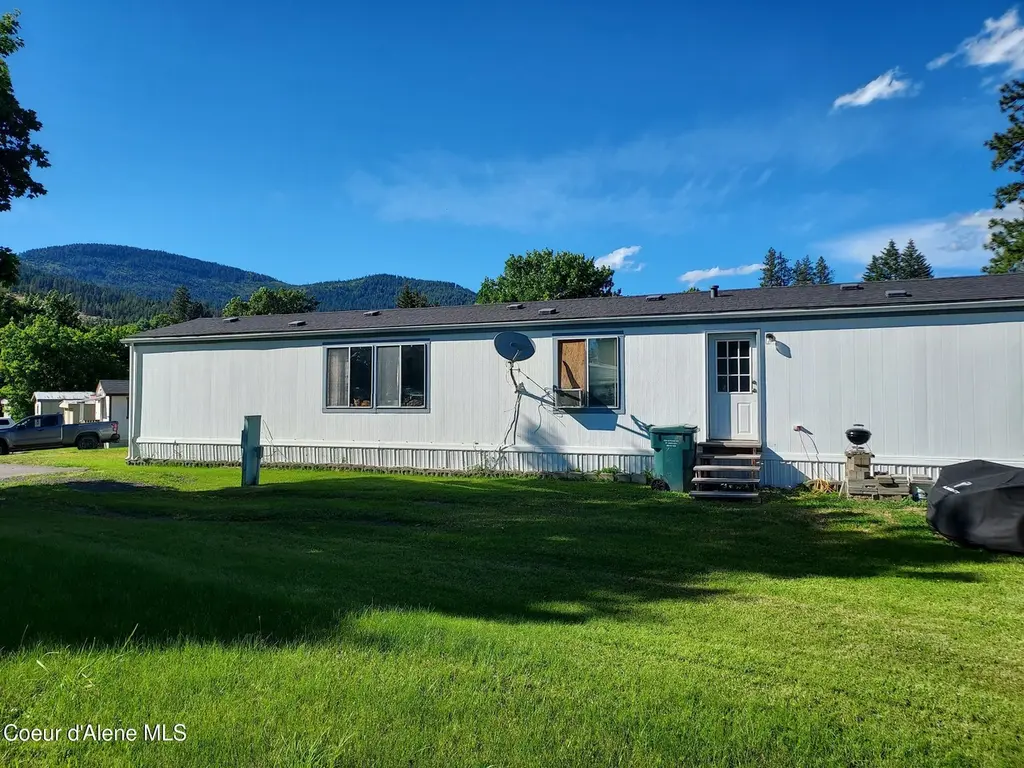
Listing remarks
Beautiful single wide manufactured home on a HUGE lot in Rathdrum, ID. This home features 2 BD/2 BA and is very large at 1061 sq/ft. The new buyer will love the convenient location, covered porch, city services, and split bedroom floor plan. Additional amenities include a garden shed, large fenced yard, 5 year-old roof, and mountain views. Enjoy an easy commute to Spokane or CDA as well!
Key facts
- Covered porch
- Large fenced yard
- Huge lot
Tags
Property features AI
Finance
- HOA & community: Has association with monthly fee
Exterior
- Parking: Paved parking
- Utilities: Public water; Public sewer
- Home design: Manufactured home; Open, sloped, corner and level lot features; Public-maintained paved road access
- Construction: T1-11 exterior siding; Composition roof; Pillar/post/pier and block foundation; Built as a manufactured structure
- Exterior features: Covered porch; Outdoor lighting; Rain gutters; Lawn; Shed(s)
Interior
- Kitchen: Electric range; Dishwasher
- Bedrooms: 2 main-level bedrooms
- Flooring: Vinyl flooring; Carpet
- Bathrooms: 2 main-level bathrooms
- Heating & cooling: Electric heating; Forced air furnace
- Interior features: Washer hookup; Crawl space (no full basement)
- Laundry & utility: Electric dryer hookup
Neighborhood map
What this means for you Summary
Snapshot
- This is a 2-bed/2.0-bath single-family listed at $100k.
Deal economics
- At list price, monthly cash flow is $269 ($3k/yr) — positive.
- The deal already cash-flows at list — no discount required.
- Meets the 1% rule at list price ($2k rent vs $100k).
- Cap rate 14.6% vs local median 1.3% in Rathdrum — top-decile yield for the area; either an underpriced asset or a hidden risk that comps aren't pricing in. Stress-test before assuming the spread holds.
Location & tenants
- Location reads 74/100 on livability (#30 in ID, #4,401 nationally) — a middle-class / working-renter tenant base. Strengths: crime A+, housing A+, health & safety B; Watch: amenities F, commute F.
- Lakeland District (rural): math 41% / reading 57% proficiency, ranked #34 of 92 in ID (top 37%) — families likely to look elsewhere, expect single-tenant / working-renter base with shorter leases.
- Market conditions: 524 active listings in the ZIP; 6 comparable units currently listed for rent nearby; rentals leasing fast (median 13d on market — plan ~1-2 weeks tenant-placement turnaround); 1,606 units permitted in Kootenai County in 2024 (154 in 5+ unit buildings).
Forward outlook
- Local home prices are declining (-3.0%/yr); year-one equity from $691 of loan paydown is wiped out by about $3k of value loss. Plan a longer hold.
- Kootenai County population projected at +33% by 2050 — long-run rental-demand tailwind backs the buy-and-hold thesis.
- At projected returns (-3.0% appreciation + 3.0% rent growth), your $28k cash investment doubles in ~10 years — after that, you're playing with house money.
Negotiation context
- Only 7 days on market — expect competitive offers; lowballing is unlikely to land.
- 2 sale attempts since 2y ago; this cycle's ask has dropped $15k (13%) from the opening price — seller is motivated, your offer sets the floor, not the list.
Risks & watch-outs
- Watch-outs: flood insurance adds $427/mo.
- Climate carrying-cost: in FEMA flood zone AE (mandatory federal flood insurance); major wildfire risk — expect insurance premiums to compound above CPI over the hold.
Questions for the listing agent
- What's the actual annual flood-insurance premium (NFIP or private), and is the property in a SFHA with mandatory coverage?
- Is there a deadline driving the sale (1031 exchange, divorce, estate, relocation)? That informs how much negotiation room exists.
- What's the average days-on-market for RENTAL listings here right now (not sales)? A rising rental-DOM trend means longer vacancies and softer asking-rent achievability than the comps imply.
- What's the recent tenant-quality profile in this submarket — average credit score on applications, eviction rate, late-payment / NSF rate, and stable-employment percentage? A property-management company in the area should have these aggregated.
- How much new for-sale + rental construction is in the pipeline within 1–3 miles? Heavy new supply typically softens prices + rents 12–24 months out; constrained supply supports both.
Investment metrics
- 1% rule
- 1.76% ✓
- Cap rate
- 14.64%
- Cash-on-cash
- 29.83%
- DSCR
- 2.33
- GRM
- 4.7
CMA / ARV
- ARV (on-the-fly)
- $376,655
- Comps found
- 12
Show comp detail 12 sales within ~0.75 mi
| Address | Dist | Beds/Ba | Sqft | Sold | Price | $/sf | Match |
|---|---|---|---|---|---|---|---|
| 8745 W Meadow Brook Cir | 0.21mi | 3/2.0 (+1) | 1,080 (+2%) | 2mo | $119,900 | $111 | 80 |
| 8310 W Meadow Brook Cir | 0.04mi | 3/2.0 (+1) | 924 (-13%) | 4mo | $98,500 | $107 | 68 |
| 8220 W Bordon Ct | 0.08mi | 3/2.0 (+1) | 924 (-13%) | 4mo | $94,900 | $103 | 67 |
| 15867 N Roosevelt St | 0.54mi | 2/1.0 | 1,104 (+4%) | 2mo | $359,000 | $325 | 62 |
| 14851 N Arbor St | 0.21mi | 3/2.0 (+1) | 924 (-13%) | 3mo | $104,500 | $113 | 61 |
| 7530 W Meadow Lark Ln | 0.53mi | 3/1.0 (+1) | 1,040 (-2%) | 3mo | $370,000 | $356 | 60 |
| 8572 W Park Loop | 0.20mi | 3/2.0 (+1) | 924 (-13%) | 4mo | $87,400 | $95 | 60 |
| 8402 W California St | 0.59mi | 3/2.0 (+1) | 1,118 (+5%) | 2mo | $450,000 | $403 | 57 |
| 15664 N Spring St | 0.39mi | 3/1.0 (+1) | 1,172 (+10%) | 5mo | $445,000 | $380 | 51 |
| 13953 N Rainier Loop | 0.74mi | 2/2.0 | 1,005 (-5%) | 8mo | $459,000 | $457 | 50 |
| 7531 W Meadow Lark Ln | 0.51mi | 3/2.0 (+1) | 1,196 (+13%) | 8mo | $425,000 | $355 | 44 |
| 15158 N Wright St | 0.60mi | 3/2.0 (+1) | 1,194 (+12%) | 6mo | $429,900 | $360 | 41 |
Match score weights: distance 35% · size 25% · config 20% · recency 20%. Top-matched comps best support the ARV.
Projected returns pro-forma
-3.0% appreciation · 3.0% rent growth · sell at horizon
- IRR
- 1.1%
- Equity multiple
- 1.04×
- Total profit
- $1,218
- Equity at exit
- $14,895
- IRR
- 11.0%
- Equity multiple
- 1.87×
- Total profit
- $24,274
- Equity at exit
- $8,638
Cash invested: $27,972 (down + closing). Projections, not guarantees.
Landlord ↔ Tenant lean methodology
- Overall (STATE)
- 91 Strongly Landlord-Friendly
- State Idaho
- 91 Strongly Landlord-Friendly · R+18
- County
- — inherits STATE
- City
- — inherits STATE
ZIP-level market 83858
- Home prices YoY
- -22.0%
- Active inventory
- 524
- Price-to-rent
- 4.7×
Monthly cashflow live
- Estimated rent
- $1,754 high interval (Pro) →
- Mortgage (P&I)
- −$524
- Tax est. 1.5%
- −$125 /mo · $1,498/yr
- Insurance
- −$42
- Flood insurance flood zone
- −$427 /mo · $5,118/yr
- HOA
- −$0
- Vacancy / Maint / Mgmt
- −$368
- Net cashflow
- $269
Break-even live
UW: 25.0% down · 7.5% · 30yr · 1.5% tax · 5.0% vac · 8.0% maint · 8.0% mgmt
Financing live
Cash to close
- Down payment
- $24,975
- Closing costs
- $2,997
- Reserves months
- —
- Total cash needed
- —
Loan-product check · same deal, 3 products live
Conventional
25% down · 7.5% · 30yr
- Down + closing
- —
- Monthly P&I
- —
- Monthly cashflow
- —
- DSCR
- —
- Eligible?
- —
Personal DTI + credit; lowest rate.
DSCR
20% down · 8.5% · 30yr
- Down + closing
- —
- Monthly P&I
- —
- Monthly cashflow
- —
- DSCR
- —
- Eligible?
- —
No personal income docs; deal must DSCR.
Hard money
10% down · 12.0% · 12mo
- Down + closing
- —
- Monthly P&I
- —
- Monthly cashflow
- —
- DSCR
- —
- Eligible?
- —
Short-term bridge; refi at stabilization.
Rent comps 6 comps
| Address | Beds | Baths | Sqft | Rent | $/sqft | DOM | Units | Dist |
|---|---|---|---|---|---|---|---|---|
| 15170 N Stevens St Rathdrum, ID | 3.0 | 2.5 | 1450 | $1,975 | $1.36 | 21d | 1 | 0.37mi |
| 7282 W Lakeland St Rathdrum, ID | 3.0 | 2.0 | 1226 | $1,725 | $1.41 | 13d | 1 | 0.57mi |
| 7164 E Winchester St Unit 1 Rathdrum, ID | 3.0 | 1.0 | 1350 | $1,650 | $1.22 | 13d | 1 | 0.63mi |
| 6923 Silverado St Unit D208 Rathdrum, ID | 2.0 | 2.0 | 1080 | $1,400 | $1.30 | 13d | 1 | 0.86mi |
| 7808 W Kayak Ct Post Falls, ID | 3.0 | 2.0 | 1171 | $2,200 | $1.88 | 13d | 1 | 0.91mi |
| 7005 W Timberline St Unit B Rathdrum, ID | 2.0 | 1.0 | 850 | $1,350 | $1.59 | 21d | 1 | 1.06mi |
Listing history 15 events
-
2026-06-19days on market $99,900 Active 7 DOM
-
2026-06-18days on market $99,900 Active 6 DOM
-
2026-06-17days on market $99,900 Active 5 DOM
-
2026-06-16days on market $99,900 Active 4 DOM
-
2026-06-15days on market $99,900 Active 3 DOM
-
2026-06-13remarks 390-char remark
-
2026-06-13pricedays on market $99,900 Active 1 DOM
-
2026-06-01days on market $103,000 Active 343 DOM
-
2026-05-31days on market $103,000 Active 342 DOM
-
2026-05-30days on market $103,000 Active 341 DOM
-
2026-04-06price $103,000
-
2025-07-28price $105,000
-
2025-06-23$115,000 Active
-
2024-09-18price $102,000
-
2024-08-29$150,000 Active
ⓘ Source: listings_history table (triggers on properties + properties_extension) + one-shot
backfill from property_details.listing_events for pre-trigger history.
Climate risk First Street
- Flood 9/10 Extreme FEMA zone AE · 99% chance over 30 yrs
- Wildfire 6/10 Major
- Heat 2/10 Low 7 d/yr ≥92°F today · 15 d/yr by 30 yrs out
- Wind 1/10 Low
- Air quality 8/10 Severe 15 unhealthy d/yr today · 16 by 30 yrs out
Nearby sold comps map
Loading sold comps map…
Walkable amenities ~0.75 mi
Loading nearby amenities…
Taxation est. · year 1
- Rental income
- $21,048
- − Mortgage interest
- −$5,596
- − Property taxes
- −$1,498
- − Insurance
- −$5,618
- − Repairs & maintenance
- −$1,684
- − Management
- −$1,684
- − Depreciation
- −$2,906
- Taxable income
- $2,062
- Est. tax owed @ 24.0%
- −$495
- After-tax cash flow
- $2,730/yr
For passive investors: Depreciation is non-cash, so a rental often shows a tax loss while cash-flowing — sheltering income. Rental losses are passive: they offset passive income freely, and up to $25,000/yr can offset ordinary (W-2) income if you actively participate and your MAGI is under $100k (phasing out to $0 by $150k); unused losses carry forward. On sale, claimed depreciation is recaptured at up to 25%, and gains may owe capital-gains tax (a 1031 exchange can defer both). Figures are a year-1 estimate at your 24.0% rate — not tax advice; consult a CPA.
Schools (NCES district)
- District
- Lakeland District
- NCES district ID
- 1601800
- Math proficiency
- 41% ▼ -6.00%
- Reading proficiency
- 57% ▼ -2.00%
- Median HH income
- $52,454
- Composite
- 42.13/100
- National rank
- #3310
- State rank
- #34 of 92 in ID
Livability — Rathdrum
- Score
- 74/100
- State rank
- #30
- US rank
- #4401
Category grades
Schools grade is shown separately in the Schools card above.
Census & demographics
- Census place
- Rathdrum, ID
- Population (ZIP)
- 19,315
Population outlook (Kootenai County) Hauer SSP2
- Today (2025)
- 177,692 people
- By 2030
- 190,689 · +7.3%
- By 2040
- 214,704 · +20.8%
- By 2050
- 236,510 · +33.1%
- By 2075
- 285,984 · +60.9%
- By 2100
- 316,459 · +78.1%
Race, ethnicity, and origin ACS 2023
- Neighborhood character
- Predominantly White (86%)
- Race & ethnicity
- White 86% Two or more races 10% Hispanic / Latino 7%
- Hispanic origin (detail)
- Mexican 5%
- Common ancestry
- Portuguese 6% Slovak 4% Italian 3%
- Foreign-born
- 2% · Canada
- Languages at home
- 95% English-only · Spanish 3% Russian/Polish/Slavic 0%
Political lean MEDSL · Kootenai
- 2024 margin
- Solid R (+51.9) · D 22.9% · R 74.8% · Other 2.2%
- 2008→2024 swing
- -25.6pp toward R · 2008: -26.3pp · 2024: -51.9pp
- All cycles
- 2024: R+51.9 2020: R+42.9 2016: R+42.5 2012: R+34.3 2008: R+26.3
Not yet ingested
- Civics
- —
Market trends
- HPI YoY
- ▼ -75.25%
- Current HPI
- 266.5011
- Rent YoY
- —
- Metro
- —
- State GDP YoY
- ▲ 4.51%
- F500 in state
- 6
Industry mix (Fortune 500 HQ in ID)
| Industry | F500 HQs | Revenue |
|---|---|---|
| Retail | 1 | $79B |
|
||
| Technology | 1 | $25B |
|
||
| Food / Agriculture | 1 | $6B |
|
||
Price history
-31.3% since first listed5 events — show timeline
- 2026-04-06 Price Changed $103,000 CDAMLS
- 2025-07-28 Price Changed $105,000 CDAMLS
- 2025-06-23 Listed $115,000 CDAMLS
- 2024-09-18 Price Changed $102,000 CDAMLS
- 2024-08-29 Listed $150,000 CDAMLS
Cash-flow waterfall
monthlySold comps — $/sqft
last 12 mo · ≤1 miLoading sold comps…