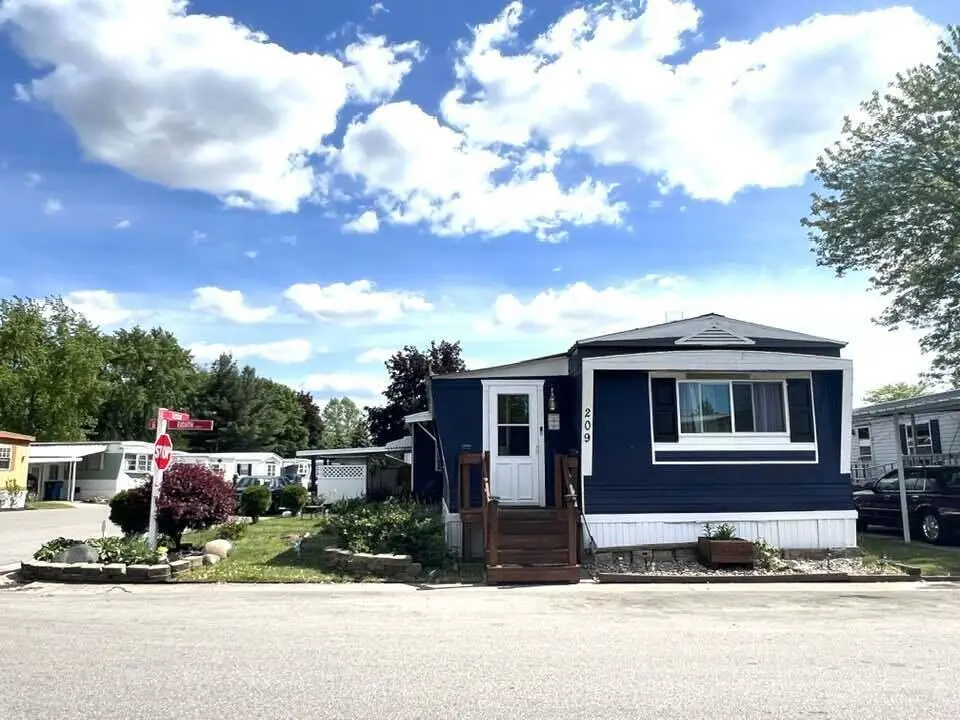
333 E Lakewood Blvd #209 · Holland, MI
Flood risk No data
- FEMA flood zone
- —
- Chance of flooding over 30 yrs
- —
- Est. flood insurance / yr
- —
Fire risk No data
- Est. fire insurance / yr
- —
Heat risk No data
- Hot days now (above threshold)
- —
- Hot days in 30 yrs
- —
Wind risk No data
- Chance of severe wind over 30 yrs
- —
Air-quality risk No data
- Unhealthy air days now
- —
- Unhealthy air days in 30 yrs
- —
Risk factors via First Street. Map © Google.
Why this score? — see what drove the B grade
The composite is a weighted blend of 9 inputs, each scored 0–100. Each bar is that input's sub-score; the figure is the points it added to the 100-point composite (weight × sub-score).
- Cash flow +30.0/30.0
- 1% rule +10.0/10.0
- DSCR +10.0/10.0
- ARV discount +7.5/15.0
- Livability +4.1/5.0
- Condition / age +4.0/5.0
- Schools +3.9/10.0
- Rent growth +3.8/5.0
- Appreciation +0.0/10.0
$99,900
🖨 Deal sheet 📄 Offer letter ✓ Due diligence
Listing remarks MLS
Check out the recently remodeled interior of this home. Updates include new gas stove, refrigerator, built in microwave, dishwasher, steel appliances, windows and 16 new shades, new water heater, new windows and ceiling fan in bedroom, new kitchen sink and faucet and countertop, all this plus brand-new wood flooring throughout. You will also find 2 bedrooms possible 3rd bedroom with the 4-season porch. There is recently added addition that created an open concept living area. Check with park manager about the future lot rent.
Key facts
- Open concept living
- Recently remodeled
- Built in microwave
Tags
Neighborhood map
What this means for you Summary
Snapshot
- This is a 2-bed/1.0-bath manufactured listed at $100k. Condition is rated good.
Deal economics
- At list price, monthly cash flow is $605 ($7k/yr) — positive.
- The deal already cash-flows at list — no discount required.
- Meets the 1% rule at list price ($2k rent vs $100k).
- Recommended offer: $94k (6.0% below list) — sets the bar for market timing.
- Cap rate 13.6% vs local median 2.5% in Holland — top-decile yield for the area; either an underpriced asset or a hidden risk that comps aren't pricing in. Stress-test before assuming the spread holds.
Location & tenants
- Location reads 82/100 on livability (#46 in MI, #1,066 nationally) — a professional / high-income tenant draw. Strengths: cost of living A+, housing A+, health & safety A+; Watch: schools C-, amenities F.
- West Ottawa Public School District (suburban): math 37% / reading 52% proficiency, ranked #140 of 540 in MI (top 26%) — families likely to look elsewhere, expect single-tenant / working-renter base with shorter leases.
- Market conditions: Rents rising fast (+5.1%/yr); 343 active listings in the ZIP; 4 comparable units currently listed for rent nearby; rentals at typical pace (median 15d on market — plan ~3-4 weeks tenant-placement turnaround); solid renter incomes; 1,237 units permitted in Ottawa County in 2024 (443 in 5+ unit buildings).
Forward outlook
- Local home prices are declining (-3.0%/yr); year-one equity from $691 of loan paydown is wiped out by about $3k of value loss. Plan a longer hold.
- Ottawa County population projected at +24% by 2050 — long-run rental-demand tailwind backs the buy-and-hold thesis.
- At projected returns (-3.0% appreciation + 5.1% rent growth), your $28k cash investment doubles in ~5 years — after that, you're playing with house money.
Negotiation context
- It's been on market 84 days — a 6% lower offer ($94k) is reasonable based on typical stale-listing flexibility.
- 5 sale attempts with the ask held roughly flat each time — persistent listings suggest the price (not the market) is what's stuck; bring a comps-based counter.
Questions for the listing agent
- It's been on market 84 days. Have you received any prior offers? Is the seller open to a 6% concession, seller financing, or rate buy-down credit?
- Built in 1973 — when were the roof, HVAC, electrical panel, plumbing, and water heater last replaced?
- Why hasn't it sold? Are there any deal-killer items the seller is aware of (foundation, flood, title, zoning, code violations)?
- Is there a deadline driving the sale (1031 exchange, divorce, estate, relocation)? That informs how much negotiation room exists.
- What's the average days-on-market for RENTAL listings here right now (not sales)? A rising rental-DOM trend means longer vacancies and softer asking-rent achievability than the comps imply.
- What's the recent tenant-quality profile in this submarket — average credit score on applications, eviction rate, late-payment / NSF rate, and stable-employment percentage? A property-management company in the area should have these aggregated.
- How much new for-sale + rental construction is in the pipeline within 1–3 miles? Heavy new supply typically softens prices + rents 12–24 months out; constrained supply supports both.
Investment metrics
- 1% rule
- 1.64% ✓
- Cap rate
- 13.56%
- Cash-on-cash
- 25.97%
- DSCR
- 2.16
- GRM
- 5.1
CMA / ARV
- ARV (median comp)
- $49,808
- List price
- $99,900
- Delta
- 100.57%
- Verdict
- OVERPRICED
- Comps
- 4 within 1.0 mi
Show comp detail 4 sales within ~0.75 mi
| Address | Dist | Beds/Ba | Sqft | Sold | Price | $/sf | Match |
|---|---|---|---|---|---|---|---|
| 333 E Lakewood Blvd #350 | 0.07mi | 2/1.0 | 896 (-3%) | 10mo | $66,000 | $74 | 83 |
| 333 E Lakewood Blvd #203 | 0.00mi | 2/2.0 | 896 (-3%) | 10mo | $45,000 | $50 | 82 |
| 333 E Lakewood Blvd #87 | 0.00mi | 2/2.0 | 896 (-3%) | 10mo | $75,000 | $84 | 82 |
| 333 E Lakewood Blvd #315 | 0.07mi | 2/2.0 | 896 (-3%) | 11mo | $40,000 | $45 | 78 |
Match score weights: distance 35% · size 25% · config 20% · recency 20%. Top-matched comps best support the ARV.
Projected returns pro-forma
-3.0% appreciation · 5.08% rent growth · sell at horizon
- IRR
- 22.0%
- Equity multiple
- 1.93×
- Total profit
- $25,893
- Equity at exit
- $14,895
- IRR
- 31.4%
- Equity multiple
- 4.12×
- Total profit
- $87,293
- Equity at exit
- $8,638
Cash invested: $27,972 (down + closing). Projections, not guarantees.
Landlord ↔ Tenant lean methodology
- Overall (STATE)
- 62 Landlord-Friendly
- State Michigan
- 62 Landlord-Friendly · EVEN
- County
- — inherits STATE
- City
- — inherits STATE
ZIP-level market 49424
- Rents YoY
- 5.1%
- Active inventory
- 343
- Price-to-rent
- 5.1×
Monthly cashflow live
- Estimated rent
- $1,640 medium interval (Pro) →
- Mortgage (P&I)
- −$524
- Tax est. 1.5%
- −$125 /mo · $1,498/yr
- Insurance
- −$42
- HOA
- −$0
- Vacancy / Maint / Mgmt
- −$344
- Net cashflow
- $605
Break-even live
UW: 25.0% down · 7.5% · 30yr · 1.5% tax · 5.0% vac · 8.0% maint · 8.0% mgmt
Financing live
Cash to close
- Down payment
- $24,975
- Closing costs
- $2,997
- Reserves months
- —
- Total cash needed
- —
Loan-product check · same deal, 3 products live
Conventional
25% down · 7.5% · 30yr
- Down + closing
- —
- Monthly P&I
- —
- Monthly cashflow
- —
- DSCR
- —
- Eligible?
- —
Personal DTI + credit; lowest rate.
DSCR
20% down · 8.5% · 30yr
- Down + closing
- —
- Monthly P&I
- —
- Monthly cashflow
- —
- DSCR
- —
- Eligible?
- —
No personal income docs; deal must DSCR.
Hard money
10% down · 12.0% · 12mo
- Down + closing
- —
- Monthly P&I
- —
- Monthly cashflow
- —
- DSCR
- —
- Eligible?
- —
Short-term bridge; refi at stabilization.
Rent comps 4 comps
| Address | Beds | Baths | Sqft | Rent | $/sqft | DOM | Units | Dist |
|---|---|---|---|---|---|---|---|---|
| 2716 Kragspough Ct Holland, MI | 2.0 | 1.0 | 1000 | $1,495 | $1.50 | 14d | 1 | 0.83mi |
| 122 Burke Ave Holland, MI | 2.0 | 1.0 | 950 | $1,325 | $1.39 | 23d | 2 | 1.11mi |
| 12181 Felch St Holland, MI | 1.0–3.0 | 1.0–2.0 | 890 | $1,938 | $2.18 | 3d | 2 | 1.21mi |
| 539 136th Ave Holland, MI | 2.0 | 1.0 | 889 | $1,450 | $1.63 | 3d | 1 | 1.32mi |
Listing history 18 events
-
2026-06-18days on market $99,900 Active 84 DOM
-
2026-06-17days on market $99,900 Active 83 DOM
-
2026-06-16days on market $99,900 Active 82 DOM
-
2026-06-15days on market $99,900 Active 81 DOM
-
2026-06-14days on market $99,900 Active 79 DOM
-
2026-06-10days on market $99,900 Active 76 DOM
-
2026-06-09days on market $99,900 Active 75 DOM
-
2026-06-09status $99,900 Active 74 DOM
-
2026-03-13$99,900 Active 533-char remark
Show marketing remark (531 chars)
Check out the recently remodeled interior of this home. Updates include new gas stove, refrigerator, built in microwave, dishwasher, steel appliances, windows and 16 new shades, new water heater, new windows and ceiling fan in bedroom, new kitchen sink and faucet and countertop, all this plus brand-new wood flooring throughout. You will also find 2 bedrooms possible 3rd bedroom with the 4-season porch. There is recently added addition that created an open concept living area. Check with park manager about the future lot rent.
-
2026-03-13$99,900 Active 531-char remark
Show marketing remark (531 chars)
Check out the recently remodeled interior of this home. Updates include new gas stove, refrigerator, built in microwave, dishwasher, steel appliances, windows and 16 new shades, new water heater, new windows and ceiling fan in bedroom, new kitchen sink and faucet and countertop, all this plus brand-new wood flooring throughout. You will also find 2 bedrooms possible 3rd bedroom with the 4-season porch. There is recently added addition that created an open concept living area. Check with park manager about the future lot rent.
-
2026-03-13$99,900 Active
Show marketing remark (531 chars)
Check out the recently remodeled interior of this home. Updates include new gas stove, refrigerator, built in microwave, dishwasher, steel appliances, windows and 16 new shades, new water heater, new windows and ceiling fan in bedroom, new kitchen sink and faucet and countertop, all this plus brand-new wood flooring throughout. You will also find 2 bedrooms possible 3rd bedroom with the 4-season porch. There is recently added addition that created an open concept living area. Check with park manager about the future lot rent.
-
2025-12-13historical
-
2025-12-12historical
-
2025-08-21price $99,900
-
2025-08-20price $99,900
-
2025-08-20price $99,900
-
2025-05-27$109,900 Active
-
2025-05-27$109,900 Active
ⓘ Source: listings_history table (triggers on properties + properties_extension) + one-shot
backfill from property_details.listing_events for pre-trigger history.
Nearby sold comps map
Loading sold comps map…
Walkable amenities ~0.75 mi
Loading nearby amenities…
Taxation est. · year 1
- Rental income
- $19,682
- − Mortgage interest
- −$5,596
- − Property taxes
- −$1,498
- − Insurance
- −$500
- − Repairs & maintenance
- −$1,575
- − Management
- −$1,575
- − Depreciation
- −$2,906
- Taxable income
- $6,032
- Est. tax owed @ 24.0%
- −$1,448
- After-tax cash flow
- $5,816/yr
For passive investors: Depreciation is non-cash, so a rental often shows a tax loss while cash-flowing — sheltering income. Rental losses are passive: they offset passive income freely, and up to $25,000/yr can offset ordinary (W-2) income if you actively participate and your MAGI is under $100k (phasing out to $0 by $150k); unused losses carry forward. On sale, claimed depreciation is recaptured at up to 25%, and gains may owe capital-gains tax (a 1031 exchange can defer both). Figures are a year-1 estimate at your 24.0% rate — not tax advice; consult a CPA.
Condition & rehab AI · 12 photos
This recently remodeled manufactured home offers a good condition with new updates throughout, making it move-in ready for both resale and rental.
Value-add opportunities
- Both Painting exterior and interior walls — Enhances curb appeal and interior aesthetics
- Both Landscaping improvements — Enhances curb appeal and adds value
- Both New flooring in bathrooms — Improves functionality and aesthetics
- Both New lighting fixtures — Enhances interior aesthetics and functionality
Renovation cost estimate screening
Value-add ROI direction
- Both Painting exterior and interior walls — Enhances curb appeal and interior aesthetics ↑
- Both Landscaping improvements — Enhances curb appeal and adds value ↑
- Both New flooring in bathrooms — Improves functionality and aesthetics ↑
- Both New lighting fixtures — Enhances interior aesthetics and functionality ↑
ⓘ Cost ranges are severity-bucket heuristics (US national rule-of-thumb). Get contractor quotes + a written scope before underwriting a rehab budget.
Schools (NCES district)
- District
- West Ottawa Public School District
- NCES district ID
- 2635910
- Math proficiency
- 37% ▼ -4.00%
- Reading proficiency
- 52% ▼ -4.00%
- Median HH income
- $58,127
- Composite
- 38.94/100
- National rank
- #4087
- State rank
- #140 of 540 in MI
Livability — Holland
- Score
- 82/100
- State rank
- #46
- US rank
- #1066
Category grades
Schools grade is shown separately in the Schools card above.
Census & demographics
- County
- Ottawa County · 144,142 people
- City population
- 96,870
- Metro
- Grand Rapids-Kentwood, MI
- Population (ZIP)
- 49,810
- Household income
- $85,478
- Rent vs Own
- Severe rent burden
- 864.0
Population outlook (Ottawa County) Hauer SSP2
- Today (2025)
- 313,561 people
- By 2030
- 330,027 · +5.3%
- By 2040
- 361,118 · +15.2%
- By 2050
- 388,414 · +23.9%
- By 2075
- 452,175 · +44.2%
- By 2100
- 473,041 · +50.9%
Race, ethnicity, and origin ACS 2023
- Neighborhood character
- Predominantly White (65%)
- Race & ethnicity
- White 65% Hispanic / Latino 25% Two or more races 10% Asian 6% Black 1%
- Hispanic origin (detail)
- Mexican 19% Puerto Rican 1%
- Common ancestry
- Iranian 22% Romanian 3% Lithuanian 2%
- Foreign-born
- 11% · Canada, Vietnam, South Korea
- Languages at home
- 80% English-only · Spanish 15% Other Asian/Pacific 3% Vietnamese 1%
Political lean MEDSL · Ottawa
- 2024 margin
- Strong R (+20.4) · D 39.0% · R 59.5% · Other 1.5%
- 2008→2024 swing
- +3.4pp toward D · 2008: -23.9pp · 2024: -20.4pp
- All cycles
- 2024: R+20.4 2020: R+21.5 2016: R+30.4 2012: R+34.2 2008: R+23.9
Not yet ingested
- Civics
- —
Market trends
- HPI YoY
- ▼ -240.90%
- Current HPI
- 252.5142
- Rent YoY
- ▲ 5.08%
- Metro
- Grand Rapids-Kentwood, MI
- State GDP YoY
- ▲ 1.37%
- F500 in state
- 28
Industry mix (Fortune 500 HQ in MI)
| Industry | F500 HQs | Revenue |
|---|---|---|
| Automotive Parts | 3 | $48B |
|
||
| Automotive | 2 | $372B |
|
||
| Chemicals | 1 | $45B |
|
||
| Automotive Retail | 1 | $29B |
|
||
| Healthcare / Medical Devices | 1 | $23B |
|
||
| Automotive Technology | 1 | $20B |
|
||
Price history
-9.1% since first listed10 events — show timeline
- 2026-03-13 Listed $99,900 SW Michigan MLS
- 2026-03-13 Listed $99,900 MiRealSource-MiMLS
- 2026-03-13 Listed $99,900 REALCOMP
- 2025-12-13 Listing Removed — MiRealSource-MiMLS
- 2025-12-12 Listing Removed — REALCOMP
- 2025-08-21 Price Changed $99,900 MiRealSource-MiMLS
- 2025-08-20 Price Changed $99,900 REALCOMP
- 2025-08-20 Price Changed $99,900 SW Michigan MLS
- 2025-05-27 Listed $109,900 REALCOMP
- 2025-05-27 Listed $109,900 MiRealSource-MiMLS
Cash-flow waterfall
monthlySold comps — $/sqft
last 12 mo · ≤1 miLoading sold comps…