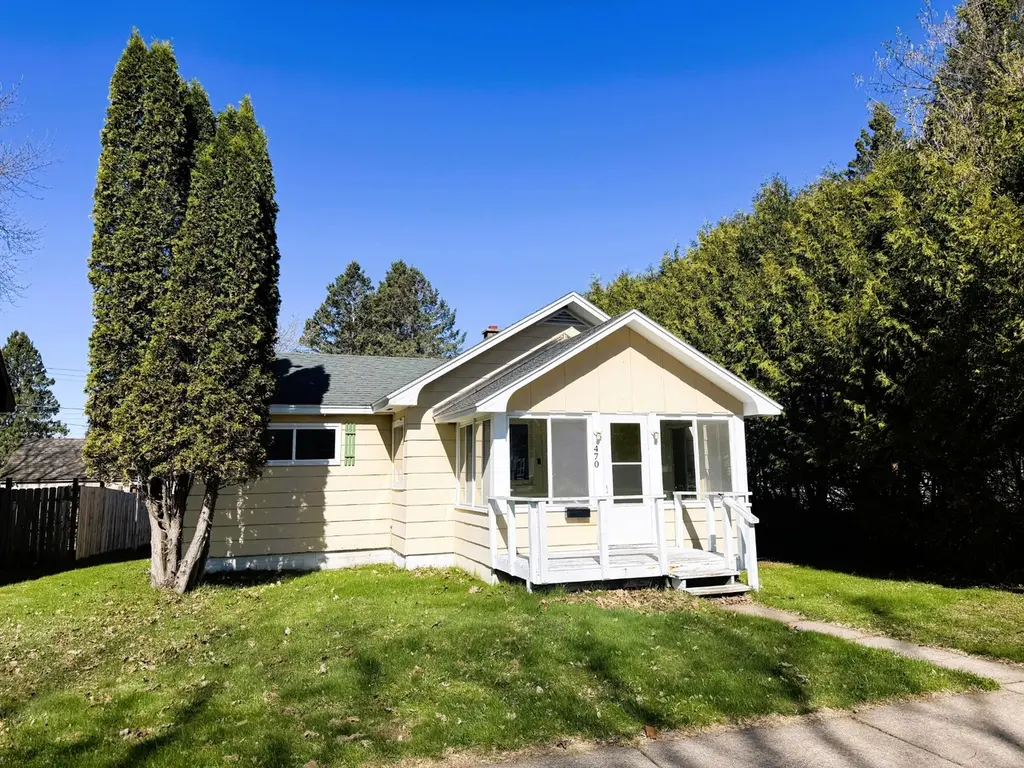
470 7th Ave · Park Falls, WI
Flood risk 1/10 · Minimal
- FEMA flood zone
- X
- Chance of flooding over 30 yrs
- 0.0%
- Est. flood insurance / yr
- $473 – $860
Fire risk 2/10 · Minimal
- Est. fire insurance / yr
- $636 – $1,182
Heat risk 1/10 · Minimal
- Hot days now (above 92°F)
- 7 days/yr
- Hot days in 30 yrs
- 13 days/yr
Wind risk 1/10 · Minimal
- Chance of severe wind over 30 yrs
- —
Air-quality risk 1/10 · Minimal
- Unhealthy air days now
- 0 days/yr
- Unhealthy air days in 30 yrs
- 0 days/yr
Risk factors via First Street. Map © Google.
Why this score? — see what drove the C grade
The composite is a weighted blend of 9 inputs, each scored 0–100. Each bar is that input's sub-score; the figure is the points it added to the 100-point composite (weight × sub-score).
- Cash flow +25.4/30.0
- DSCR +8.4/10.0
- ARV discount +8.1/15.0
- 1% rule +6.2/10.0
- Livability +3.5/5.0
- Rent growth +2.5/5.0
- Condition / age +2.5/5.0
- Schools +2.3/10.0
- Appreciation +0.0/10.0
$84,900
🖨 Deal sheet 📄 Offer letter ✓ Due diligence
Listing remarks MLS
(355) Great Starter Home or Retirement Home Priced to Sell! This cozy one-story home is located on a 50x120+/- ft. lot in an established Park Falls residential neighborhood has a roomy living room, kitchen, bath and three bedrooms. There is an enclosed front porch and an enclosed rear porch with closet. Partial basement. Trane natural gas forced air furnace and central air. One car detached garage. $39,900
Key facts
- Gravel parking
- Spacious kitchen
- Large living room
Tags
Property features AI
Exterior
- Parking: Detached 1-car garage
- Utilities: Public water; Public sewer
- Home design: Single-family residence; One story; Residential property
- Construction: Frame and Masonite construction; Composition/shingle roof; Built with a single level (1 story)
- Exterior features: City street frontage; Public maintained road
Interior
- Flooring: Carpet; Vinyl
- Bathrooms: 1 full bathroom
- Heating & cooling: Forced air heating (natural gas); Central air conditioning
- Interior features: Electric water heater; No fireplace
Neighborhood map
What this means for you Summary
Snapshot
- This is a 3-bed/1.0-bath single-family listed at $85k.
Deal economics
- At list price, monthly cash flow is $196 ($2k/yr) — positive.
- The deal already cash-flows at list — no discount required.
- Meets the 1% rule at list price ($952 rent vs $85k).
- Recommended offer: $82k (3.0% below list) — sets the bar for market timing.
Location & tenants
- Location reads 69/100 on livability (#329 in WI) — a middle-class / working-renter tenant base. Strengths: cost of living A+, health & safety A+, housing A-; Watch: employment D, schools D-, amenities F.
- Chequamegon School District (rural): math 25% / reading 29% proficiency, ranked #303 of 342 in WI (top 89%) — low school quality limits family demand, transient renter base, plan for 1-2y turnover.
- Market conditions: 74 active listings in the ZIP; 47 units permitted in Price County in 2024 (0 in 5+ unit buildings).
Forward outlook
- Local home prices are declining (-3.0%/yr); year-one equity from $587 of loan paydown is wiped out by about $3k of value loss. Plan a longer hold.
- Price County population projected at -25% by 2050 — secular population decline; favor cash flow + early exit over multi-decade hold.
Negotiation context
- It's been on market 45 days — a 3% lower offer ($82k) is reasonable based on typical stale-listing flexibility.
- 2 sale attempts since 8y ago with the ask held roughly flat each time — persistent listings suggest the price (not the market) is what's stuck; bring a comps-based counter.
- Current owner paid $35k; list at $85k implies a 143% gain — meaningful room to come down on a strong offer.
Questions for the listing agent
- It's been on market 45 days. Have you received any prior offers? Is the seller open to a 3% concession, seller financing, or rate buy-down credit?
- Is there a deadline driving the sale (1031 exchange, divorce, estate, relocation)? That informs how much negotiation room exists.
- Schools are D-rated, which usually means shorter tenancies and higher turnover. Who's the typical renter profile here, and what's been the actual vacancy rate?
- What's the average days-on-market for RENTAL listings here right now (not sales)? A rising rental-DOM trend means longer vacancies and softer asking-rent achievability than the comps imply.
- What's the recent tenant-quality profile in this submarket — average credit score on applications, eviction rate, late-payment / NSF rate, and stable-employment percentage? A property-management company in the area should have these aggregated.
- How much new for-sale + rental construction is in the pipeline within 1–3 miles? Heavy new supply typically softens prices + rents 12–24 months out; constrained supply supports both.
Investment metrics
- 1% rule
- 1.12% ✓
- Cap rate
- 9.07%
- Cash-on-cash
- 9.92%
- DSCR
- 1.44
- GRM
- 7.4
CMA / ARV
- ARV (median comp)
- $86,068
- List price
- $84,900
- Delta
- -1.36%
- Verdict
- FAIR
- Comps
- 20 within 1.0 mi
Show comp detail 7 sales within ~0.75 mi
| Address | Dist | Beds/Ba | Sqft | Sold | Price | $/sf | Match |
|---|---|---|---|---|---|---|---|
| N15539 10th Ave | 0.19mi | 3/1.0 | 875 (-6%) | 2mo | $161,500 | $185 | 79 |
| W7900 Lafayette St | 0.34mi | 2/1.0 (-1) | 948 (+2%) | 16mo | $110,000 | $116 | 63 |
| 847 4th Ave Ave S | 0.38mi | 2/1.0 (-1) | 988 (+6%) | 15mo | $141,500 | $143 | 55 |
| 384 Court St | 0.64mi | 2/1.0 (-1) | 1,000 (+7%) | 1mo | $95,000 | $95 | 52 |
| 377 5th Ave | 0.27mi | 2/1.0 (-1) | 862 (-8%) | 23mo | $80,000 | $93 | 51 |
| 970 S 4th Avenue South | 0.54mi | 2/1.0 (-1) | 846 (-9%) | 9mo | $90,000 | $106 | 47 |
| 663 2nd Ave | 0.72mi | 2/1.0 (-1) | 1,061 (+14%) | 22mo | $92,000 | $87 | 20 |
Match score weights: distance 35% · size 25% · config 20% · recency 20%. Top-matched comps best support the ARV.
Projected returns pro-forma
-3.0% appreciation · 3.0% rent growth · sell at horizon
- IRR
- -1.4%
- Equity multiple
- 0.95×
- Total profit
- $-1,253
- Equity at exit
- $12,659
- IRR
- 8.3%
- Equity multiple
- 1.63×
- Total profit
- $14,998
- Equity at exit
- $7,341
Cash invested: $23,772 (down + closing). Projections, not guarantees.
Landlord ↔ Tenant lean methodology
- Overall (STATE)
- 73 Landlord-Friendly
- State Wisconsin
- 73 Landlord-Friendly · R+2
- County
- — inherits STATE
- City
- — inherits STATE
ZIP-level market 54552
- Home prices YoY
- -27.7%
- Active inventory
- 74
- Price-to-rent
- 7.4×
Monthly cashflow live
- Estimated rent
- $952 medium interval (Pro) →
- Mortgage (P&I)
- −$445
- Tax from tax record
- −$75 /mo · $896/yr
- Insurance
- −$35
- HOA
- −$0
- Vacancy / Maint / Mgmt
- −$200
- Net cashflow
- $196
Break-even live
UW: 25.0% down · 7.5% · 30yr · 1.5% tax · 5.0% vac · 8.0% maint · 8.0% mgmt
Financing live
Cash to close
- Down payment
- $21,225
- Closing costs
- $2,547
- Reserves months
- —
- Total cash needed
- —
Loan-product check · same deal, 3 products live
Conventional
25% down · 7.5% · 30yr
- Down + closing
- —
- Monthly P&I
- —
- Monthly cashflow
- —
- DSCR
- —
- Eligible?
- —
Personal DTI + credit; lowest rate.
DSCR
20% down · 8.5% · 30yr
- Down + closing
- —
- Monthly P&I
- —
- Monthly cashflow
- —
- DSCR
- —
- Eligible?
- —
No personal income docs; deal must DSCR.
Hard money
10% down · 12.0% · 12mo
- Down + closing
- —
- Monthly P&I
- —
- Monthly cashflow
- —
- DSCR
- —
- Eligible?
- —
Short-term bridge; refi at stabilization.
Listing history 23 events
-
2026-06-18days on market $84,900 Active 45 DOM
-
2026-06-17days on market $84,900 Active 44 DOM
-
2026-06-16days on market $84,900 Active 43 DOM
-
2026-06-15days on market $84,900 Active 42 DOM
-
2026-06-15days on market $84,900 Active 41 DOM
-
2026-06-13days on market $84,900 Active 40 DOM
-
2026-06-12days on market $84,900 Active 39 DOM
-
2026-06-09days on market $84,900 Active 36 DOM
-
2026-06-08days on market $84,900 Active 35 DOM
-
2026-06-08days on market $84,900 Active 34 DOM
-
2026-06-05days on market $84,900 Active 32 DOM
-
2026-06-03days on market $84,900 Active 30 DOM
-
2026-06-02days on market $84,900 Active 29 DOM
-
2026-06-01days on market $84,900 Active 28 DOM
-
2026-05-31days on market $84,900 Active 27 DOM
-
2026-05-01$84,900 Active 585-char remark
-
2018-08-24soldstatus $35,000 409-char remark
Show marketing remark (409 chars)
(355) Great Starter Home or Retirement Home Priced to Sell! This cozy one-story home is located on a 50x120+/- ft. lot in an established Park Falls residential neighborhood has a roomy living room, kitchen, bath and three bedrooms. There is an enclosed front porch and an enclosed rear porch with closet. Partial basement. Trane natural gas forced air furnace and central air. One car detached garage. $39,900
-
2018-07-11$39,900 409-char remark
Show marketing remark (409 chars)
(355) Great Starter Home or Retirement Home Priced to Sell! This cozy one-story home is located on a 50x120+/- ft. lot in an established Park Falls residential neighborhood has a roomy living room, kitchen, bath and three bedrooms. There is an enclosed front porch and an enclosed rear porch with closet. Partial basement. Trane natural gas forced air furnace and central air. One car detached garage. $39,900
-
2006-07-24soldstatus $15,900
-
2006-07-24soldstatus $19,100
-
2005-02-09soldstatus $9,800
-
2005-01-25soldstatus $9,800
-
2004-11-30soldstatus $9,800
ⓘ Source: listings_history table (triggers on properties + properties_extension) + one-shot
backfill from property_details.listing_events for pre-trigger history.
Tax reassessment forecast WI · Partial reset (capped growth)
- Current annual tax
- $896 · $75/mo
- Projected year-2 tax
- $1,233 · $103/mo
- Expected delta
- +$337/yr (+$28/mo · 37.6%)
ⓘ Screening estimate from a state-policy table — verify with the county assessor before closing.
Climate risk First Street
- Flood 1/10 Low FEMA zone X · 0% chance over 30 yrs
- Wildfire 2/10 Low
- Heat 1/10 Low 7 d/yr ≥92°F today · 13 d/yr by 30 yrs out
- Wind 1/10 Low
- Air quality 1/10 Low 0 unhealthy d/yr today · 0 by 30 yrs out
Nearby sold comps map
Loading sold comps map…
Walkable amenities ~0.75 mi
Loading nearby amenities…
Taxation est. · year 1
- Rental income
- $11,418
- − Mortgage interest
- −$4,756
- − Property taxes
- −$896
- − Insurance
- −$424
- − Repairs & maintenance
- −$913
- − Management
- −$913
- − Depreciation
- −$2,470
- Taxable income
- $1,045
- Est. tax owed @ 24.0%
- −$251
- After-tax cash flow
- $2,106/yr
For passive investors: Depreciation is non-cash, so a rental often shows a tax loss while cash-flowing — sheltering income. Rental losses are passive: they offset passive income freely, and up to $25,000/yr can offset ordinary (W-2) income if you actively participate and your MAGI is under $100k (phasing out to $0 by $150k); unused losses carry forward. On sale, claimed depreciation is recaptured at up to 25%, and gains may owe capital-gains tax (a 1031 exchange can defer both). Figures are a year-1 estimate at your 24.0% rate — not tax advice; consult a CPA.
Schools (NCES district)
- District
- Chequamegon School District
- NCES district ID
- 5500058
- Math proficiency
- 25% ▼ -18.00%
- Reading proficiency
- 29% ▼ -9.00%
- Median HH income
- $42,432
- Composite
- 22.98/100
- National rank
- #7984
- State rank
- #303 of 342 in WI
Livability — Park Falls
- Score
- 69/100
- State rank
- #329
- US rank
- #8515
Category grades
Schools grade is shown separately in the Schools card above.
Census & demographics
- Census place
- Park Falls, WI
- Population (ZIP)
- 4,290
Population outlook (Price County) Hauer SSP2
- Today (2025)
- 12,757 people
- By 2030
- 12,157 · -4.7%
- By 2040
- 10,761 · -15.6%
- By 2050
- 9,515 · -25.4%
- By 2075
- 8,293 · -35.0%
- By 2100
- 7,470 · -41.4%
Race, ethnicity, and origin ACS 2023
- Neighborhood character
- Predominantly White (93%)
- Race & ethnicity
- White 93% Two or more races 4% Hispanic / Latino 2%
- Common ancestry
- Portuguese 8% Romanian 6% Lithuanian 4%
- Foreign-born
- 2% · Canada
- Languages at home
- 98% English-only · Spanish 1% Other Asian/Pacific 1%
Political lean MEDSL · Price
- 2024 margin
- Solid R (+31.1) · D 33.9% · R 65.1%
- 2008→2024 swing
- -44.5pp toward R · 2008: 13.4pp · 2024: -31.1pp
- All cycles
- 2024: R+31.1 2020: R+27.6 2016: R+25.0 2012: D+0.0 2008: D+13.4
Not yet ingested
- Civics
- —
Market trends
- HPI YoY
- ▼ -77.87%
- Current HPI
- 203.0866
- Rent YoY
- —
- Metro
- —
- State GDP YoY
- ▲ 2.10%
- F500 in state
- 20
Industry mix (Fortune 500 HQ in WI)
| Industry | F500 HQs | Revenue |
|---|---|---|
| Industrial Machinery | 4 | $23B |
|
||
| Industrial Technology | 2 | $36B |
|
||
| Insurance | 1 | $36B |
|
||
| Professional Services | 1 | $19B |
|
||
| Utilities | 1 | $9B |
|
||
| Consumer Goods | 1 | $3B |
|
||
Price history
+766.3% since first listed8 events — show timeline
- 2026-05-01 Listed $84,900 GNMLS
- 2018-08-24 Sold (MLS) $35,000 GNMLS
- 2018-07-11 Listed $39,900 GNMLS
- 2006-07-24 Sold (Public Records) $19,100 Public Records
- 2006-07-24 Sold (Public Records) $15,900 Public Records
- 2005-02-09 Sold (Public Records) $9,800 Public Records
- 2005-01-25 Sold (Public Records) $9,800 Public Records
- 2004-11-30 Sold (Public Records) $9,800 Public Records
Property tax history
+0.2%/yrLatest (2025): $896 · +3.8% YoY. Source: county tax records.
Cash-flow waterfall
monthlySold comps — $/sqft
last 12 mo · ≤1 miLoading sold comps…