2130 Sunset Dr #55 · Vista, CA
Flood risk 1/10 · Minimal
- FEMA flood zone
- X (unshaded)
- Chance of flooding over 30 yrs
- 0.0%
- Est. flood insurance / yr
- $507 – $1,088
Fire risk 1/10 · Minimal
- Est. fire insurance / yr
- $659 – $1,223
Heat risk 5/10 · Moderate
- Hot days now (above 88°F)
- 7 days/yr
- Hot days in 30 yrs
- 21 days/yr
Wind risk 1/10 · Minimal
- Chance of severe wind over 30 yrs
- —
Air-quality risk 4/10 · Minor
- Unhealthy air days now
- 5 days/yr
- Unhealthy air days in 30 yrs
- 5 days/yr
Risk factors via First Street. Map © Google.
Why this score? — see what drove the B- grade
The composite is a weighted blend of 9 inputs, each scored 0–100. Each bar is that input's sub-score; the figure is the points it added to the 100-point composite (weight × sub-score).
- Cash flow +30.0/30.0
- DSCR +10.0/10.0
- 1% rule +9.3/10.0
- ARV discount +5.9/15.0
- Schools +4.0/10.0
- Rent growth +3.1/5.0
- Livability +3.0/5.0
- Condition / age +2.5/5.0
- Appreciation +0.0/10.0
$222,900
🖨 Deal sheet 📄 Offer letter ✓ Due diligence
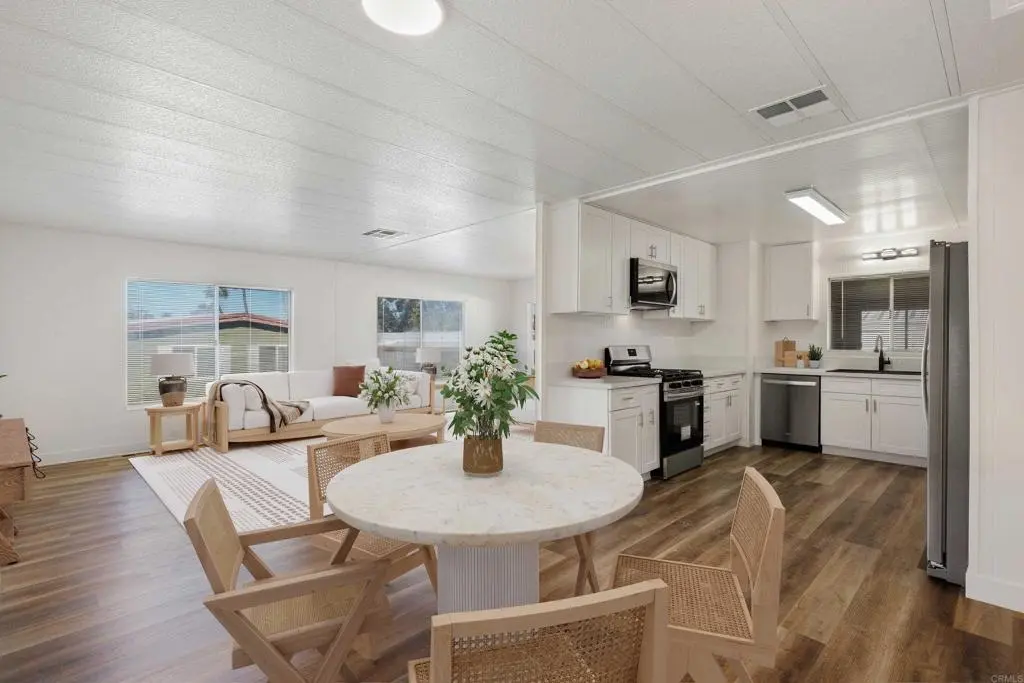
Listing remarks
Remodeled home + NEW roof located in a well kept 55+ park near shopping, Costco, TriCity Medical, highways 78 & 5, Carlsbad and Oceanside beaches, shopping mall & more! Interior has been fully remodeled with a brand new Kitchen and Bathrooms, new flooring throughout (LVP in the living and wet areas and carpet for comfort in the bedrooms), new paint and fixtures and so much more! The Primary Suite offers double closets as well as dual sinks in the ensuite bathroom. The enclosed porch is not included in the listed square footage but offers additional usable space for hobbies, office, or storage. Low maintenance yard with garden box and storage shed. Conveniently located near gue
Key facts
- Dual sinks
- Brand new kitchen
- Double closets
Tags
Neighborhood map
What this means for you Summary
Snapshot
- This is a 2-bed/2.0-bath manufactured listed at $223k.
Deal economics
- At list price, monthly cash flow is $977 ($12k/yr) — positive.
- The deal already cash-flows at list — no discount required.
- Meets the 1% rule at list price ($3k rent vs $223k).
- Recommended offer: $220k (1.5% below list) — sets the bar for market timing.
- Cap rate 11.6% vs local median 2.4% in Vista — top-decile yield for the area; either an underpriced asset or a hidden risk that comps aren't pricing in. Stress-test before assuming the spread holds.
Location & tenants
- Location reads 60/100 on livability (#584 in CA) — a middle-class / working-renter tenant base. Strengths: commute A+, employment A-; Watch: schools F, amenities F, cost of living F.
- Vista Unified (suburban): math 32% / reading 59% proficiency, ranked #175 of 517 in CA (top 34%) — families likely to look elsewhere, expect single-tenant / working-renter base with shorter leases.
- Market conditions: Rents rising (+2.4%/yr); 82 active listings in the ZIP; 21 comparable units currently listed for rent nearby; rentals at typical pace (median 17d on market — plan ~3-4 weeks tenant-placement turnaround); solid renter incomes; 11,759 units permitted in San Diego County in 2024 (7,244 in 5+ unit buildings).
- This rent runs 36% of the median local income ($105k/yr) — at the standard rent-burdened threshold; future hikes will face affordability resistance.
Forward outlook
- Local home prices are declining (-3.0%/yr); year-one equity from $2k of loan paydown is wiped out by about $7k of value loss. Plan a longer hold.
- San Diego County population projected at +20% by 2050 — long-run rental-demand tailwind backs the buy-and-hold thesis.
- At projected returns (-3.0% appreciation + 2.4% rent growth), your $62k cash investment doubles in ~7 years — after that, you're playing with house money.
Negotiation context
- It's been on market 28 days — a 2% lower offer ($220k) is reasonable based on typical stale-listing flexibility.
Risks & watch-outs
- Climate carrying-cost: extreme-heat days projected 7→21/yr by 2055 (HVAC capex compounding) — expect insurance premiums to compound above CPI over the hold.
Questions for the listing agent
- Built in 1975 — when were the roof, HVAC, electrical panel, plumbing, and water heater last replaced?
- Is there a deadline driving the sale (1031 exchange, divorce, estate, relocation)? That informs how much negotiation room exists.
- Schools are F-rated, which usually means shorter tenancies and higher turnover. Who's the typical renter profile here, and what's been the actual vacancy rate?
- What's the average days-on-market for RENTAL listings here right now (not sales)? A rising rental-DOM trend means longer vacancies and softer asking-rent achievability than the comps imply.
- What's the recent tenant-quality profile in this submarket — average credit score on applications, eviction rate, late-payment / NSF rate, and stable-employment percentage? A property-management company in the area should have these aggregated.
- How much new for-sale + rental construction is in the pipeline within 1–3 miles? Heavy new supply typically softens prices + rents 12–24 months out; constrained supply supports both.
Investment metrics
- 1% rule
- 1.43% ✓
- Cap rate
- 11.55%
- Cash-on-cash
- 18.78%
- DSCR
- 1.84
- GRM
- 5.8
CMA / ARV
- ARV (on-the-fly)
- $215,040
- Comps found
- 12
Show comp detail 12 sales within ~0.75 mi
| Address | Dist | Beds/Ba | Sqft | Sold | Price | $/sf | Match |
|---|---|---|---|---|---|---|---|
| 101 Havenview Ln #101 | 0.26mi | 2/2.0 | 1,344 (0%) | 2mo | $225,000 | $167 | 86 |
| 2130 Sunset Dr #70 | 0.00mi | 2/2.0 | 1,440 (+7%) | 2mo | $245,000 | $170 | 86 |
| 2130 Sunset Dr #135 | 0.00mi | 2/2.0 | 1,440 (+7%) | 3mo | $199,000 | $138 | 86 |
| 2130 Sunset Dr #14 | 0.01mi | 2/2.0 | 1,440 (+7%) | 3mo | $185,000 | $128 | 85 |
| 2130 Sunset Dr #73 | 0.00mi | 2/2.0 | 1,440 (+7%) | 5mo | $193,000 | $134 | 84 |
| 2130 Sunset Dr Spc 94 | 0.01mi | 2/2.0 | 1,440 (+7%) | 6mo | $150,000 | $104 | 83 |
| 127 Brookside Ln | 0.33mi | 2/2.0 | 1,368 (+2%) | 7mo | $280,000 | $205 | 76 |
| 2130 Sunset Dr #69 | 0.01mi | 3/2.0 (+1) | 1,520 (+13%) | 2mo | $349,900 | $230 | 71 |
| 240 Havenview Ln | 0.34mi | 2/2.0 | 1,440 (+7%) | 5mo | $245,000 | $170 | 68 |
| 283 Picnic View Ln | 0.43mi | 2/2.0 | 1,440 (+7%) | 0mo | $165,000 | $115 | 68 |
| 243 Havenview Ln | 0.35mi | 2/2.0 | 1,464 (+9%) | 4mo | $183,000 | $125 | 66 |
| 201 Bright Creek Ln | 0.40mi | 2/2.0 | 1,440 (+7%) | 6mo | $230,000 | $160 | 64 |
Match score weights: distance 35% · size 25% · config 20% · recency 20%. Top-matched comps best support the ARV.
Projected returns pro-forma
-3.0% appreciation · 2.44% rent growth · sell at horizon
- IRR
- 10.0%
- Equity multiple
- 1.39×
- Total profit
- $24,356
- Equity at exit
- $33,235
- IRR
- 18.6%
- Equity multiple
- 2.51×
- Total profit
- $94,269
- Equity at exit
- $19,272
Cash invested: $62,412 (down + closing). Projections, not guarantees.
Landlord ↔ Tenant lean methodology
- Overall (STATE)
- 18 Strongly Tenant-Friendly
- State California
- 18 Strongly Tenant-Friendly · D+13
- County
- — inherits STATE
- City
- — inherits STATE
ZIP-level market 92081
- Rents YoY
- 2.4%
- Active inventory
- 82
- Price-to-rent
- 5.8×
Monthly cashflow live
- Estimated rent
- $3,186 high interval (Pro) →
- Mortgage (P&I)
- −$1,169
- Tax est. 1.5%
- −$279 /mo · $3,344/yr
- Insurance
- −$93
- HOA
- −$0
- Vacancy / Maint / Mgmt
- −$669
- Net cashflow
- $977
Break-even live
UW: 25.0% down · 7.5% · 30yr · 1.5% tax · 5.0% vac · 8.0% maint · 8.0% mgmt
Financing live
Cash to close
- Down payment
- $55,725
- Closing costs
- $6,687
- Reserves months
- —
- Total cash needed
- —
Loan-product check · same deal, 3 products live
Conventional
25% down · 7.5% · 30yr
- Down + closing
- —
- Monthly P&I
- —
- Monthly cashflow
- —
- DSCR
- —
- Eligible?
- —
Personal DTI + credit; lowest rate.
DSCR
20% down · 8.5% · 30yr
- Down + closing
- —
- Monthly P&I
- —
- Monthly cashflow
- —
- DSCR
- —
- Eligible?
- —
No personal income docs; deal must DSCR.
Hard money
10% down · 12.0% · 12mo
- Down + closing
- —
- Monthly P&I
- —
- Monthly cashflow
- —
- DSCR
- —
- Eligible?
- —
Short-term bridge; refi at stabilization.
Rent comps 21 comps
| Address | Beds | Baths | Sqft | Rent | $/sqft | DOM | Units | Dist |
|---|---|---|---|---|---|---|---|---|
| 3407 Del Este Way Oceanside, CA | 3.0 | 2.0 | 1110 | $3,434 | $3.09 | 44d | 1 | 0.23mi |
| 3402 Los Mochis Way Oceanside, CA | 3.0 | 2.0 | 1101 | $3,250 | $2.95 | 44d | 1 | 0.26mi |
| 3465 Los Mochis Way Oceanside, CA | 2.0 | 1.5 | 1280 | $3,100 | $2.42 | 16d | 1 | 0.29mi |
| 4463 Jasper Ln Oceanside, CA | 2.0 | 2.0 | 1436 | $3,495 | $2.43 | 44d | 1 | 0.46mi |
| 3657 Harbor View Way Oceanside, CA | 3.0 | 1.5 | 1191 | $3,050 | $2.56 | 44d | 1 | 0.49mi |
| 333 N Emerald Dr Vista, CA | 1.0–2.0 | 1.0–2.0 | 840 | $3,009 | $3.58 | 2d | 46 | 0.63mi |
| 1515 Date St Vista, CA | 2.0 | 2.0 | 881 | $2,795 | $3.17 | 3d | 1 | 0.82mi |
| 1427 Janis Lynn Ln Vista, CA | 3.0 | 2.5 | 1824 | $3,700 | $2.03 | 44d | 1 | 0.93mi |
| 4619 Waverly Rd Oceanside, CA | 3.0 | 2.5 | 1754 | $4,200 | $2.39 | 2d | 1 | 0.95mi |
| 3675 Barnard Dr Oceanside, CA | 1.0–2.0 | 1.0–2.0 | 915 | $2,895 | $3.16 | 17d | 4 | 1.01mi |
| 3675 Barnard Dr Oceanside, CA | 1.0–2.0 | 1.0–2.0 | 915 | $2,895 | $3.16 | 24d | 3 | 1.02mi |
| 3675 Barnard Dr Oceanside, CA | 1.0–2.0 | 1.0–2.0 | 915 | $2,895 | $3.16 | 5d | 7 | 1.02mi |
| 3675 Barnard Dr Oceanside, CA | 2.0 | 2.0 | 1015 | $2,845 | $2.80 | 18d | 3 | 1.02mi |
| 164 Santa Barbara Way Vista, CA | 3.0 | 2.0 | 1260 | $3,800 | $3.02 | 44d | 1 | 1.03mi |
| 3114 Dilla Pl Carlsbad, CA | 3.0 | 2.5 | 1700 | $1,900 | $1.12 | 18d | 1 | 1.11mi |
| 2825 College Blvd Oceanside, CA | 3.0 | 2.0 | 1140 | $3,100 | $2.72 | 44d | 1 | 1.14mi |
| 3661 Harvard Dr Oceanside, CA | 3.0 | 2.5 | 1353 | $3,295 | $2.44 | 15d | 1 | 1.17mi |
| 3251 Marisol Pl Carlsbad, CA | 1.0–3.0 | 1.0–2.0 | 1082 | $3,726 | $3.44 | 2d | 13 | 1.28mi |
| 3716 Jetty Pt Carlsbad, CA | 3.0 | 2.0 | 1390 | $4,200 | $3.02 | 2d | 1 | 1.42mi |
| 4014 Backshore Ct Carlsbad, CA | 3.0 | 2.5 | 1509 | $4,350 | $2.88 | 2d | 1 | 1.48mi |
| 701 Breeze Hill Rd Vista, CA | 1.0–3.0 | 1.0–2.5 | 1013 | $3,478 | $3.43 | 2d | 1 | 1.48mi |
Listing history 17 events
-
2026-06-18days on market $222,900 Active 28 DOM
-
2026-06-17days on market $222,900 Active 27 DOM
-
2026-06-16days on market $222,900 Active 26 DOM
-
2026-06-15days on market $222,900 Active 25 DOM
-
2026-06-13days on market $222,900 Active 23 DOM
-
2026-06-13days on market $222,900 Active 22 DOM
-
2026-06-09days on market $222,900 Active 19 DOM
-
2026-06-08days on market $222,900 Active 18 DOM
-
2026-06-07days on market $222,900 Active 17 DOM
-
2026-06-04days on market $222,900 Active 14 DOM
-
2026-06-03days on market $222,900 Active 13 DOM
-
2026-06-02days on market $222,900 Active 12 DOM
-
2026-06-01days on market $222,900 Active 11 DOM
-
2026-05-31days on market $222,900 Active 10 DOM
-
2026-05-14historical
-
2026-02-16price $239,900
-
2025-12-05$249,900 Active
ⓘ Source: listings_history table (triggers on properties + properties_extension) + one-shot
backfill from property_details.listing_events for pre-trigger history.
Climate risk First Street
- Flood 1/10 Low FEMA zone X (unshaded) · 0% chance over 30 yrs
- Wildfire 1/10 Low
- Heat 5/10 Major 7 d/yr ≥88°F today · 21 d/yr by 30 yrs out
- Wind 1/10 Low
- Air quality 4/10 Moderate 5 unhealthy d/yr today · 5 by 30 yrs out
Nearby sold comps map
Loading sold comps map…
Walkable amenities ~0.75 mi
Loading nearby amenities…
Taxation est. · year 1
- Rental income
- $38,236
- − Mortgage interest
- −$12,486
- − Property taxes
- −$3,344
- − Insurance
- −$1,114
- − Repairs & maintenance
- −$3,059
- − Management
- −$3,059
- − Depreciation
- −$6,484
- Taxable income
- $8,690
- Est. tax owed @ 24.0%
- −$2,086
- After-tax cash flow
- $9,636/yr
For passive investors: Depreciation is non-cash, so a rental often shows a tax loss while cash-flowing — sheltering income. Rental losses are passive: they offset passive income freely, and up to $25,000/yr can offset ordinary (W-2) income if you actively participate and your MAGI is under $100k (phasing out to $0 by $150k); unused losses carry forward. On sale, claimed depreciation is recaptured at up to 25%, and gains may owe capital-gains tax (a 1031 exchange can defer both). Figures are a year-1 estimate at your 24.0% rate — not tax advice; consult a CPA.
Schools (NCES district)
- District
- Vista Unified
- NCES district ID
- 0641190
- Math proficiency
- 32% ▼ -5.00%
- Reading proficiency
- 59% ▲ 9.00%
- Median HH income
- $60,067
- Composite
- 39.91/100
- National rank
- #3850
- State rank
- #175 of 517 in CA
Livability — Vista
- Score
- 60/100
- State rank
- #584
- US rank
- #18990
Category grades
Schools grade is shown separately in the Schools card above.
Census & demographics
- Census place
- Vista, CA
- County
- San Diego County · 3,178,799 people
- City population
- 117,104
- Metro
- San Diego-Chula Vista-Carlsbad, CA
- Population (ZIP)
- 29,002
- Household income
- $105,379
- Rent vs Own
- Severe rent burden
- 1683.0
Population outlook (San Diego County) Hauer SSP2
- Today (2025)
- 3,678,185 people
- By 2030
- 3,856,546 · +4.8%
- By 2040
- 4,171,407 · +13.4%
- By 2050
- 4,421,607 · +20.2%
- By 2075
- 4,831,599 · +31.4%
- By 2100
- 4,832,502 · +31.4%
Race, ethnicity, and origin ACS 2023
- Neighborhood character
- Diverse neighborhood (Simpson 0.62)
- Race & ethnicity
- White 53% Hispanic / Latino 30% Two or more races 20% Asian 8% Black 4%
- Hispanic origin (detail)
- Mexican 26% Puerto Rican 2%
- Common ancestry
- Lithuanian 3% Romanian 2% Slovak 2%
- Foreign-born
- 16% · Canada, China, Vietnam
- Languages at home
- 75% English-only · Spanish 17% Other Indo-European 2% Chinese 1%
Political lean MEDSL · San Diego
- 2024 margin
- D (+16.8) · D 56.9% · R 40.1% · Other 2.9%
- 2008→2024 swing
- +6.6pp toward D · 2008: 10.2pp · 2024: 16.8pp
- All cycles
- 2024: D+16.8 2020: D+22.8 2016: D+17.8 2012: D+5.1 2008: D+10.2
Not yet ingested
- Civics
- —
Market trends
- HPI YoY
- ▼ -279.77%
- Current HPI
- 370.3578
- Rent YoY
- ▲ 2.44%
- Metro
- San Diego-Chula Vista-Carlsbad, CA
- State GDP YoY
- ▲ 3.21%
- F500 in state
- 116
Industry mix (Fortune 500 HQ in CA)
| Industry | F500 HQs | Revenue |
|---|---|---|
| Technology | 27 | $1,492B |
|
||
| Financial Services | 3 | $174B |
|
||
| Retail | 3 | $44B |
|
||
| Insurance | 3 | $26B |
|
||
| Media / Entertainment | 2 | $115B |
|
||
| Pharmaceuticals / Biotech | 2 | $62B |
|
||
Price history
-4.0% since first listed3 events — show timeline
- 2026-05-14 Listing Removed — CRMLS
- 2026-02-16 Price Changed $239,900 CRMLS
- 2025-12-05 Listed $249,900 CRMLS
Property tax history
-15.8%/yrLatest (2013): $205 · -1.0% YoY. Source: county tax records.
Cash-flow waterfall
monthlySold comps — $/sqft
last 12 mo · ≤1 miLoading sold comps…