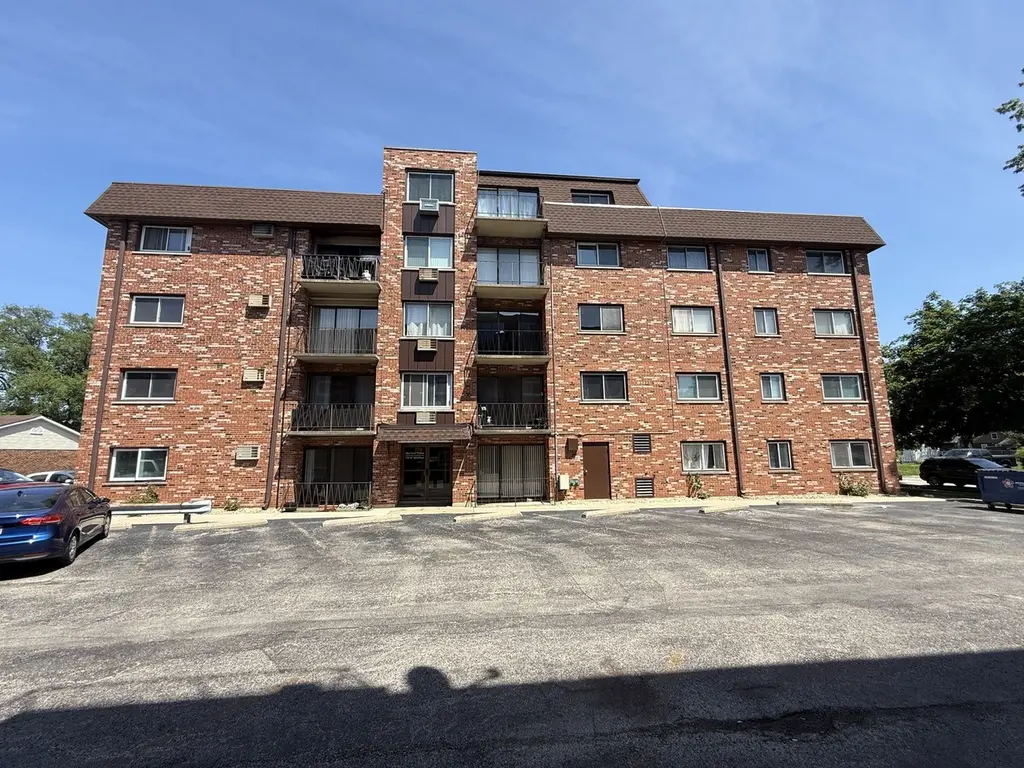
7110 W 93rd Pl Unit 3F · Oak Lawn, IL
Flood risk 1/10 · Minimal
- FEMA flood zone
- X (unshaded)
- Chance of flooding over 30 yrs
- 0.0%
- Est. flood insurance / yr
- $507 – $1,088
Fire risk 1/10 · Minimal
- Est. fire insurance / yr
- $804 – $1,492
Heat risk 3/10 · Minor
- Hot days now (above 101°F)
- 7 days/yr
- Hot days in 30 yrs
- 15 days/yr
Wind risk 2/10 · Minimal
- Chance of severe wind over 30 yrs
- 0.0%
Air-quality risk 3/10 · Minor
- Unhealthy air days now
- 4 days/yr
- Unhealthy air days in 30 yrs
- 4 days/yr
Risk factors via First Street. Map © Google.
Why this score? — see what drove the C+ grade
The composite is a weighted blend of 9 inputs, each scored 0–100. Each bar is that input's sub-score; the figure is the points it added to the 100-point composite (weight × sub-score).
- Cash flow +24.8/30.0
- DSCR +8.0/10.0
- ARV discount +7.5/15.0
- 1% rule +7.2/10.0
- Rent growth +4.6/5.0
- Livability +4.0/5.0
- Condition / age +2.5/5.0
- Schools +1.9/10.0
- Appreciation +0.0/10.0
$122,900
🖨 Deal sheet (PDF) 📄 Offer letter ✓ Due diligence
Listing remarks
Location, location, location! Beautiful 1-bedroom condo in Oak Lawn with easy access to I-294. Situated in a well-maintained building, this charming unit offers convenience, comfort, and a great location close to shopping, dining, and transportation.
Key facts
- Easy access to i-294
- $18 HOA
- Parking
Tags
Property features AI
Finance
- Other: Building contains 25 units; Living area is estimated
- HOA & community: Annual association fee of $210; HOA fee includes heat, water, and parking; Pets not allowed
Exterior
- Parking: One assigned parking space; Guest parking available; Other parking options
- Utilities: Water source: Lake Michigan; Public sewer
- Home design: Attached single condo; Entry on third level; Condo ownership; Built 51–60 years ago; Pre-1978 construction
- Construction: Brick construction
- Exterior features: Common lot; School bus service and commuter/interstate access nearby
Interior
- Kitchen: Kitchen with wood laminate flooring
- Bedrooms: 1 bedroom; Additional bedroom possibilities listed
- Flooring: Carpet in master bedroom; Wood laminate in kitchen
- Bathrooms: 1 full bath
- Heating & cooling: Steam heating; Baseboard heating; Wall-mounted cooling unit(s)
- Interior features: Four total rooms; Accessible / disability equipped
- Laundry & utility: Main-level laundry room
Neighborhood map
What this means for you Summary
Snapshot
- This is a 1-bed/1.0-bath condo listed at $123k.
Deal economics
- At list price, monthly cash flow is $259 ($3k/yr) — positive.
- The deal already cash-flows at list — no discount required.
- Meets the 1% rule at list price ($1k rent vs $123k).
- Recommended offer: $119k (3.0% below list) — sets the bar for market timing.
- Cap rate 8.8% vs local median 4.4% in Oak Lawn — top-decile yield for the area; either an underpriced asset or a hidden risk that comps aren't pricing in. Stress-test before assuming the spread holds.
Location & tenants
- Location reads 80/100 on livability (#102 in IL, #1,614 nationally) — a professional / high-income tenant draw. Strengths: commute A+, housing A+, employment A-.
- Oak Lawn Chsd 229 (suburban): math 22% / reading 21% proficiency, ranked #384 of 620 in IL (top 62%) — low school quality limits family demand, transient renter base, plan for 1-2y turnover.
- Zoned schools: Oak Lawn Comm High School (math 22% / reading 21%, grade F, #345 of 693 statewide, top 50%, 1,834 students, 0% FRL).
- Market conditions: Rents rising fast (+8.2%/yr); 188 active listings in the ZIP; 3 comparable units currently listed for rent nearby; rentals at typical pace (median 17d on market — plan ~3-4 weeks tenant-placement turnaround); solid renter incomes; 6,272 units permitted in Cook County in 2024 (4,658 in 5+ unit buildings).
Forward outlook
- Local home prices are declining (-3.0%/yr); year-one equity from $850 of loan paydown is wiped out by about $4k of value loss. Plan a longer hold.
- At projected returns (-3.0% appreciation + 8.0% rent growth), your $34k cash investment doubles in ~8 years — after that, you're playing with house money.
Negotiation context
- It's been on market 43 days — a 3% lower offer ($119k) is reasonable based on typical stale-listing flexibility.
- Current owner paid $55k; list at $123k implies a 123% gain — meaningful room to come down on a strong offer.
Questions for the listing agent
- It's been on market 43 days. Have you received any prior offers? Is the seller open to a 3% concession, seller financing, or rate buy-down credit?
- Built in 1971 — when were the roof, HVAC, electrical panel, plumbing, and water heater last replaced?
- What does the HOA fee cover, when was the last increase, and are there any pending special assessments or reserve-fund shortfalls?
- Any open or pending special assessments — roof, HVAC, plumbing, elevator, façade? What's the per-unit balance and payoff schedule, and is the seller paying it off at close or rolling it to the buyer?
- Is there a deadline driving the sale (1031 exchange, divorce, estate, relocation)? That informs how much negotiation room exists.
- What's the average days-on-market for RENTAL listings here right now (not sales)? A rising rental-DOM trend means longer vacancies and softer asking-rent achievability than the comps imply.
- What's the recent tenant-quality profile in this submarket — average credit score on applications, eviction rate, late-payment / NSF rate, and stable-employment percentage? A property-management company in the area should have these aggregated.
- How much new apartment / multifamily construction is in the pipeline within 1–3 miles? Heavy new supply (>2% of stock underway) typically softens rents 12–24 months out; light construction supports rent growth.
Investment metrics
- 1% rule
- 1.22% ✓
- Cap rate
- 8.82%
- Cash-on-cash
- 9.04%
- DSCR
- 1.40
- GRM
- 6.8
CMA / ARV
No comps found within radius.
Projected returns pro-forma
-3.0% appreciation · 8.0% rent growth · sell at horizon
- IRR
- 3.3%
- Equity multiple
- 1.13×
- Total profit
- $4,573
- Equity at exit
- $18,325
- IRR
- 17.3%
- Equity multiple
- 2.79×
- Total profit
- $61,499
- Equity at exit
- $10,626
Cash invested: $34,412 (down + closing). Projections, not guarantees.
Landlord ↔ Tenant lean methodology
- Overall (STATE)
- 43 Moderately Tenant-Leaning
- State Illinois
- 43 Moderately Tenant-Leaning · D+7
- County
- — inherits STATE
- City
- — inherits STATE
ZIP-level market 60453
- Rents YoY
- 8.2%
- Active inventory
- 188
- Price-to-rent
- 6.8×
Monthly cashflow live
- Estimated rent
- $1,496 medium interval (Pro) →
- Mortgage (P&I)
- −$645
- Tax from tax record
- −$209 /mo · $2,503/yr
- Insurance
- −$51
- HOA
- −$18
- Vacancy / Maint / Mgmt
- −$314
- Net cashflow
- $259
Break-even live
Sensitivity live
| Price | -10% $329 | -5% $294 | +0% $259 | +5% $225 | +10% $190 |
|---|---|---|---|---|---|
| Rent | -10% $141 | -5% $200 | +0% $259 | +5% $318 | +10% $377 |
| Rate | -1.0pp $321 | -0.5pp $291 | base $259 | +0.5pp $227 | +1.0pp $195 |
UW: 25.0% down · 7.5% · 30yr · 1.5% tax · 5.0% vac · 8.0% maint · 8.0% mgmt
Financing live
Cash to close
- Down payment
- $30,725
- Closing costs
- $3,687
- Reserves months
- —
- Total cash needed
- —
Loan-product check · same deal, 3 products live
Conventional
25% down · 7.5% · 30yr
- Down + closing
- —
- Monthly P&I
- —
- Monthly cashflow
- —
- DSCR
- —
- Eligible?
- —
Personal DTI + credit; lowest rate.
DSCR
20% down · 8.5% · 30yr
- Down + closing
- —
- Monthly P&I
- —
- Monthly cashflow
- —
- DSCR
- —
- Eligible?
- —
No personal income docs; deal must DSCR.
Hard money
10% down · 12.0% · 12mo
- Down + closing
- —
- Monthly P&I
- —
- Monthly cashflow
- —
- DSCR
- —
- Eligible?
- —
Short-term bridge; refi at stabilization.
Rent comps 3 comps
| Address | Beds | Baths | Sqft | Rent | $/sqft | DOM | Units | Dist |
|---|---|---|---|---|---|---|---|---|
| 7834 95th St Unit 1C Hickory Hills, IL | 1.0 | 1.0 | 750 | $1,600 | $2.13 | 25d | 1 | 0.93mi |
| 10210 Ridgeland Ave Chicago Ridge, IL | 1.0 | 1.0 | 700 | $1,500 | $2.14 | 17d | 1 | 1.39mi |
| 10210 Ridgeland Ave Chicago Ridge, IL | 1.0 | 1.0 | 700 | $1,425 | $2.04 | 0d | 2 | 1.39mi |
HOA detail condo
- Monthly dues
- $18 · $216/yr
- Assessments
- None detected in remarks — confirm with the listing agent.
Listing history 16 events
-
2026-06-21days on market $122,900 Active 43 DOM
-
2026-06-18days on market $122,900 Active 40 DOM
-
2026-06-17pricedays on market $122,900 Active 39 DOM
-
2026-06-16days on market $129,900 Active 38 DOM
-
2026-06-15days on market $129,900 Active 37 DOM
-
2026-06-13days on market $129,900 Active 35 DOM
-
2026-06-13days on market $129,900 Active 34 DOM
-
2026-06-09days on market $129,900 Active 31 DOM
-
2026-06-08days on market $129,900 Active 30 DOM
-
2026-06-07days on market $129,900 Active 29 DOM
-
2026-06-04days on market $129,900 Active 26 DOM
-
2026-06-03days on market $129,900 Active 25 DOM
-
2026-06-02pricedays on market $129,900 Active 24 DOM
-
2026-06-01days on market $134,900 Active 23 DOM
-
2026-05-31days on market $134,900 Active 22 DOM
-
1997-10-06soldstatus $55,000
ⓘ Source: listings_history table (triggers on properties + properties_extension) + one-shot
backfill from property_details.listing_events for pre-trigger history.
Tax reassessment forecast IL · Partial reset (capped growth)
- Current annual tax
- $2,503 · $209/mo
- Projected year-2 tax
- $2,646 · $221/mo
- Expected delta
- +$144/yr (+$12/mo · 5.7%)
ⓘ Screening estimate from a state-policy table — verify with the county assessor before closing.
Climate risk First Street
- Flood 1/10 Low FEMA zone X (unshaded) · 0% chance over 30 yrs
- Wildfire 1/10 Low
- Heat 3/10 Moderate 7 d/yr ≥101°F today · 15 d/yr by 30 yrs out
- Wind 2/10 Low 0% chance of damaging wind over 30 yrs
- Air quality 3/10 Moderate 4 unhealthy d/yr today · 4 by 30 yrs out
Nearby sold comps map
Loading sold comps map…
Walkable amenities ~0.75 mi
Loading nearby amenities…
Taxation est. · year 1
- Rental income
- $17,948
- − Mortgage interest
- −$6,884
- − Property taxes
- −$2,503
- − Insurance
- −$614
- − Repairs & maintenance
- −$1,436
- − Management
- −$1,436
- − HOA
- −$216
- − Depreciation
- −$3,575
- Taxable income
- $1,284
- Est. tax owed @ 24.0%
- −$308
- After-tax cash flow
- $2,804/yr
For passive investors: Depreciation is non-cash, so a rental often shows a tax loss while cash-flowing — sheltering income. Rental losses are passive: they offset passive income freely, and up to $25,000/yr can offset ordinary (W-2) income if you actively participate and your MAGI is under $100k (phasing out to $0 by $150k); unused losses carry forward. On sale, claimed depreciation is recaptured at up to 25%, and gains may owe capital-gains tax (a 1031 exchange can defer both). Figures are a year-1 estimate at your 24.0% rate — not tax advice; consult a CPA.
Schools (NCES district)
- District
- Oak Lawn Chsd 229
- NCES district ID
- 1729220
- Math proficiency
- 22% ▼ -4.00%
- Reading proficiency
- 21% ▼ -4.00%
- Median HH income
- $52,505
- Composite
- 19.41/100
- National rank
- #8777
- State rank
- #384 of 620 in IL
Livability — Oak Lawn
- Score
- 80/100
- State rank
- #102
- US rank
- #1614
Category grades
Schools grade is shown separately in the Schools card above.
Census & demographics
- Census place
- Oak Lawn, IL
- County
- Cook County · 4,486,803 people
- City population
- 56,861
- Metro
- Chicago-Naperville-Elgin, IL-IN-WI
- Population (ZIP)
- 56,861
- Household income
- $83,911
- Rent vs Own
- Severe rent burden
- 827.0
Population outlook (Cook County) Hauer SSP2
- Today (2025)
- 5,347,519 people
- By 2030
- 5,357,703 · +0.2%
- By 2040
- 5,324,924 · -0.4%
- By 2050
- 5,230,762 · -2.2%
- By 2075
- 4,785,735 · -10.5%
- By 2100
- 4,188,836 · -21.7%
Race, ethnicity, and origin ACS 2023
- Neighborhood character
- Majority White (64%)
- Race & ethnicity
- White 64% Hispanic / Latino 24% Two or more races 9% Black 8% Asian 2%
- Hispanic origin (detail)
- Mexican 21%
- Common ancestry
- Romanian 16% Iranian 1% Armenian 1%
- Foreign-born
- 16% · Canada, Vietnam
- Languages at home
- 70% English-only · Spanish 17% Russian/Polish/Slavic 5% Arabic 4%
Political lean MEDSL · Cook
- 2024 margin
- Solid D (+42.0) · D 70.4% · R 28.4% · Other 1.2%
- 2008→2024 swing
- -11.4pp toward R · 2008: 53.4pp · 2024: 42.0pp
- All cycles
- 2024: D+42.0 2020: D+50.3 2016: D+53.0 2012: D+49.4 2008: D+53.4
Not yet ingested
- Civics
- —
Market trends
- HPI YoY
- ▼ -259.83%
- Current HPI
- 214.6977
- Rent YoY
- ▲ 8.23%
- Metro
- Chicago-Naperville-Elgin, IL-IN-WI
- State GDP YoY
- ▲ 1.59%
- F500 in state
- 60
Industry mix (Fortune 500 HQ in IL)
| Industry | F500 HQs | Revenue |
|---|---|---|
| Insurance | 4 | $201B |
|
||
| Consumer Goods | 4 | $87B |
|
||
| Industrial Machinery | 3 | $64B |
|
||
| Healthcare | 2 | $55B |
|
||
| Retail / Pharmacy | 1 | $148B |
|
||
| Agriculture / Food | 1 | $86B |
|
||
Price history
1 event — show timeline
- 1997-10-06 Sold (Public Records) $55,000 Public Records
Property tax history
+12.6%/yrLatest (2023): $2,503 · +59.2% YoY. Source: county tax records.
Cash-flow waterfall
monthlySold comps — $/sqft
last 12 mo · ≤1 miLoading sold comps…