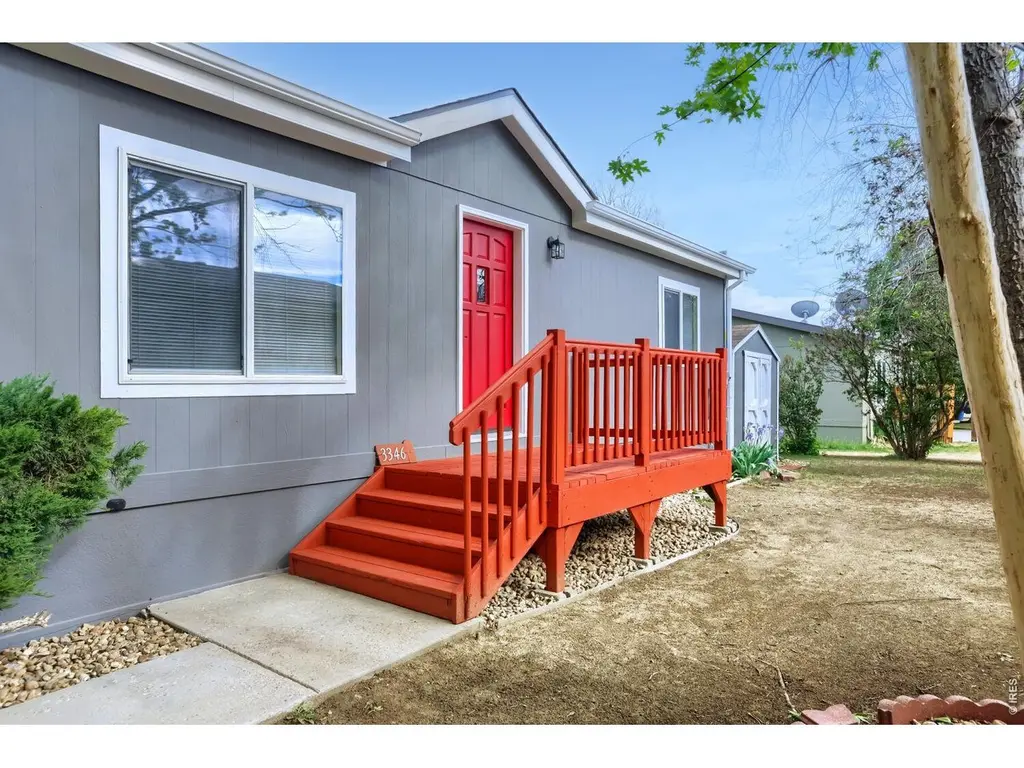
3346 Teton #365 · Firestone, CO
Flood risk No data
- FEMA flood zone
- —
- Chance of flooding over 30 yrs
- —
- Est. flood insurance / yr
- —
Fire risk No data
- Est. fire insurance / yr
- —
Heat risk No data
- Hot days now (above threshold)
- —
- Hot days in 30 yrs
- —
Wind risk No data
- Chance of severe wind over 30 yrs
- —
Air-quality risk No data
- Unhealthy air days now
- —
- Unhealthy air days in 30 yrs
- —
Risk factors via First Street. Map © Google.
Why this score? — see what drove the C+ grade
The composite is a weighted blend of 9 inputs, each scored 0–100. Each bar is that input's sub-score; the figure is the points it added to the 100-point composite (weight × sub-score).
- Cash flow +30.0/30.0
- DSCR +10.0/10.0
- 1% rule +9.9/10.0
- Schools +3.8/10.0
- Livability +3.7/5.0
- ARV discount +2.6/15.0
- Condition / age +2.5/5.0
- Rent growth +1.9/5.0
- Appreciation +0.0/10.0
$169,900
🖨 Deal sheet (PDF) 📄 Offer letter ✓ Due diligence
Listing remarks
Simply Sensational! Beautifully remodeled home. Bright and clean, all new high end kitchen appliances, cabinets, newly painted inside and out, new laminate flooring, carpets, fixtures, decks. Everything is done. This home is located in a unique community with beautifully landscaped grounds, it includes a swimming pool, a playground, picnic area & other amenities. All of this for $1,195.00 per month. Shopping is located near by, Home Depot, Costco, Walmart, Safeway, King Soopers, Whole Foods, restaurants as well as a skate park, climbing gym, Union Reservoir, which has spectacular views of the Rocky Mountains, St. Vrain's bike path connecting to all of Longmont, Longs Peak Hospital &a
Key facts
- Picnic area
- Swimming pool
- Playground
Tags
Property features AI
Finance
- Other: Directions: Hiway 119 and Cr 3.5 North to Longview Blvd. Turn right. Left on Longview Blvd and follow around to Teton. Turn right.
- HOA & community: No association fees; No association transfer fee; No association reserves
Exterior
- Parking: No garage; No designated parking features
- Utilities: City water (meter installed); Public sewer; Natural gas available (Black Hills); Electricity available; Trash service: Longview
- Home design: Manufactured in-park home; Mobile home; Located on a cul-de-sac; Level lot; Minimal flood risk (C rating)
- Construction: Frame construction; Composition roof; Post and pier foundation
- Exterior features: Deck; Storage structure
Interior
- Kitchen: Gas range; Dishwasher; Refrigerator; Microwave
- Bedrooms: 3 bedrooms; All bedrooms conforming
- Bathrooms: 2 full bathrooms
- Heating & cooling: Forced air heating; Central air conditioning; Ceiling fans
- Interior features: Eat-in kitchen; Separate dining room; Window coverings
Neighborhood map
What this means for you Summary
Snapshot
- This is a 3-bed/2.0-bath manufactured listed at $170k.
Deal economics
- At list price, monthly cash flow is $830 ($10k/yr) — positive.
- The deal already cash-flows at list — no discount required.
- Meets the 1% rule at list price ($3k rent vs $170k).
- Recommended offer: $165k (3.0% below list) — sets the bar for market timing.
- Cap rate 12.2% vs local median 2.9% in Firestone — top-decile yield for the area; either an underpriced asset or a hidden risk that comps aren't pricing in. Stress-test before assuming the spread holds.
Location & tenants
- Location reads 73/100 on livability (#44 in CO) — a middle-class / working-renter tenant base. Strengths: employment A+, housing A+, crime A; Watch: amenities F, commute F, cost of living F.
- St. Vrain Valley School District No. Re1J (suburban): math 32% / reading 51% proficiency, ranked #23 of 86 in CO (top 27%) — families likely to look elsewhere, expect single-tenant / working-renter base with shorter leases.
- Zoned schools: Mead Elementary School (math 27% / reading 57%, grade F, #321 of 966 statewide, top 35%, 833 students, 19% FRL); Mead High School (math 34% / reading 59%, grade D-, #137 of 381 statewide, top 36%, 1,119 students, 25% FRL).
- Market conditions: Rents soft (-2.3%/yr); 534 active listings in the ZIP; 2 comparable units currently listed for rent nearby; high-income renter base; 3,170 units permitted in Weld County in 2024 (278 in 5+ unit buildings).
Forward outlook
- Local home prices are declining (-3.0%/yr); year-one equity from $1k of loan paydown is wiped out by about $5k of value loss. Plan a longer hold.
- Weld County population projected at +46% by 2050 — long-run rental-demand tailwind backs the buy-and-hold thesis.
- At projected returns (-3.0% appreciation + 0.0% rent growth), your $48k cash investment doubles in ~8 years — after that, you're playing with house money.
Negotiation context
- It's been on market 41 days — a 3% lower offer ($165k) is reasonable based on typical stale-listing flexibility.
- Current owner paid $58k; list at $170k implies a 192% gain — meaningful room to come down on a strong offer.
Questions for the listing agent
- It's been on market 41 days. Have you received any prior offers? Is the seller open to a 3% concession, seller financing, or rate buy-down credit?
- Is there a deadline driving the sale (1031 exchange, divorce, estate, relocation)? That informs how much negotiation room exists.
- What's the average days-on-market for RENTAL listings here right now (not sales)? A rising rental-DOM trend means longer vacancies and softer asking-rent achievability than the comps imply.
- What's the recent tenant-quality profile in this submarket — average credit score on applications, eviction rate, late-payment / NSF rate, and stable-employment percentage? A property-management company in the area should have these aggregated.
- How much new for-sale + rental construction is in the pipeline within 1–3 miles? Heavy new supply typically softens prices + rents 12–24 months out; constrained supply supports both.
Investment metrics
- 1% rule
- 1.49% ✓
- Cap rate
- 12.15%
- Cash-on-cash
- 20.93%
- DSCR
- 1.93
- GRM
- 5.6
CMA / ARV
- ARV (on-the-fly)
- $153,216
- Comps found
- 12
Show comp detail 12 sales within ~0.75 mi
| Address | Dist | Beds/Ba | Sqft | Sold | Price | $/sf | Match |
|---|---|---|---|---|---|---|---|
| 3340 Longview Blvd #379 | 0.08mi | 2/2.0 (-1) | 1,232 (-8%) | 3mo | $99,000 | $80 | 75 |
| 3340 Longview Blvd | 0.08mi | 2/2.0 (-1) | 1,232 (-8%) | 3mo | $99,900 | $81 | 75 |
| 11305 Bryce #231 | 0.14mi | 2/2.0 (-1) | 1,248 (-7%) | 4mo | $162,500 | $130 | 73 |
| 11090 Zion | 0.11mi | 2/2.0 (-1) | 1,232 (-8%) | 4mo | $140,000 | $114 | 73 |
| 11090 Zion #326 | 0.11mi | 2/2.0 (-1) | 1,232 (-8%) | 4mo | $140,000 | $114 | 73 |
| 11171 Bluff Ldg #7 | 0.15mi | 3/2.0 | 1,456 (+8%) | 10mo | $119,000 | $82 | 71 |
| 11128 Bluff | 0.14mi | 2/2.0 (-1) | 1,232 (-8%) | 7mo | $179,000 | $145 | 69 |
| 11494 Glacier Pt #62 | 0.34mi | 3/2.0 | 1,456 (+8%) | 3mo | $181,400 | $125 | 68 |
| 11128 Bluff Ldg #1 | 0.16mi | 2/2.0 (-1) | 1,232 (-8%) | 7mo | $179,000 | $145 | 68 |
| 11481 Hot Spgs | 0.31mi | 3/— | 1,536 (+14%) | 5mo | $155,000 | $101 | 58 |
| 11481 Hot Spgs #78 | 0.31mi | 3/2.0 | 1,536 (+14%) | 5mo | $155,000 | $101 | 58 |
| 3297 Far Vw | 0.31mi | 3/2.0 | 1,522 (+13%) | 7mo | $192,750 | $127 | 58 |
Match score weights: distance 35% · size 25% · config 20% · recency 20%. Top-matched comps best support the ARV.
Projected returns pro-forma
-3.0% appreciation · 0.0% rent growth · sell at horizon
- IRR
- 9.9%
- Equity multiple
- 1.38×
- Total profit
- $17,918
- Equity at exit
- $25,333
- IRR
- 16.4%
- Equity multiple
- 2.16×
- Total profit
- $55,077
- Equity at exit
- $14,690
Cash invested: $47,572 (down + closing). Projections, not guarantees.
Landlord ↔ Tenant lean methodology
- Overall (STATE)
- 38 Tenant-Leaning
- State Colorado
- 38 Tenant-Leaning · D+4
- County
- — inherits STATE
- City
- — inherits STATE
ZIP-level market 80504
- Rents YoY
- -2.3%
- Active inventory
- 534
- Price-to-rent
- 5.6×
Monthly cashflow live
- Estimated rent
- $2,537 medium interval (Pro) →
- Mortgage (P&I)
- −$891
- Tax est. 1.5%
- −$212 /mo · $2,548/yr
- Insurance
- −$71
- HOA
- −$0
- Vacancy / Maint / Mgmt
- −$533
- Net cashflow
- $830
Break-even live
Sensitivity live
| Price | -10% $947 | -5% $888 | +0% $830 | +5% $771 | +10% $712 |
|---|---|---|---|---|---|
| Rent | -10% $629 | -5% $730 | +0% $830 | +5% $930 | +10% $1,030 |
| Rate | -1.0pp $915 | -0.5pp $873 | base $830 | +0.5pp $786 | +1.0pp $741 |
UW: 25.0% down · 7.5% · 30yr · 1.5% tax · 5.0% vac · 8.0% maint · 8.0% mgmt
Financing live
Cash to close
- Down payment
- $42,475
- Closing costs
- $5,097
- Reserves months
- —
- Total cash needed
- —
Loan-product check · same deal, 3 products live
Conventional
25% down · 7.5% · 30yr
- Down + closing
- —
- Monthly P&I
- —
- Monthly cashflow
- —
- DSCR
- —
- Eligible?
- —
Personal DTI + credit; lowest rate.
DSCR
20% down · 8.5% · 30yr
- Down + closing
- —
- Monthly P&I
- —
- Monthly cashflow
- —
- DSCR
- —
- Eligible?
- —
No personal income docs; deal must DSCR.
Hard money
10% down · 12.0% · 12mo
- Down + closing
- —
- Monthly P&I
- —
- Monthly cashflow
- —
- DSCR
- —
- Eligible?
- —
Short-term bridge; refi at stabilization.
Rent comps 2 comps
| Address | Beds | Baths | Sqft | Rent | $/sqft | DOM | Units | Dist |
|---|---|---|---|---|---|---|---|---|
| 2315 Zlaten Dr Longmont, CO | 2.0–3.0 | 2.0 | 1155 | $2,000 | $1.73 | 22d | 1 | 1.07mi |
| 2051 Zlaten Dr Longmont, CO | 3.0 | 1.0–2.0 | 993 | $2,984 | $3.01 | 14d | 32 | 1.27mi |
Listing history 17 events
-
2026-06-18days on market $169,900 Active 41 DOM
-
2026-06-17price $169,900 Active 40 DOM
-
2026-06-17days on market $179,900 Active 40 DOM
-
2026-06-16days on market $179,900 Active 39 DOM
-
2026-06-15days on market $179,900 Active 38 DOM
-
2026-06-14days on market $179,900 Active 36 DOM
-
2026-06-13days on market $179,900 Active 35 DOM
-
2026-06-09days on market $179,900 Active 32 DOM
-
2026-06-09days on market $179,900 Active 31 DOM
-
2026-06-07days on market $179,900 Active 30 DOM
-
2026-06-02days on market $179,900 Active 25 DOM
-
2026-06-01days on market $179,900 Active 24 DOM
-
2026-05-31days on market $179,900 Active 23 DOM
-
2026-05-30days on market $179,900 Active 22 DOM
-
2026-05-08$179,900 Active
-
2025-12-19soldstatus $58,200
-
2004-11-29soldstatus $68,000
ⓘ Source: listings_history table (triggers on properties + properties_extension) + one-shot
backfill from property_details.listing_events for pre-trigger history.
Nearby sold comps map
Loading sold comps map…
Walkable amenities ~0.75 mi
Loading nearby amenities…
Taxation est. · year 1
- Rental income
- $30,438
- − Mortgage interest
- −$9,517
- − Property taxes
- −$2,548
- − Insurance
- −$850
- − Repairs & maintenance
- −$2,435
- − Management
- −$2,435
- − Depreciation
- −$4,943
- Taxable income
- $7,711
- Est. tax owed @ 24.0%
- −$1,851
- After-tax cash flow
- $8,106/yr
For passive investors: Depreciation is non-cash, so a rental often shows a tax loss while cash-flowing — sheltering income. Rental losses are passive: they offset passive income freely, and up to $25,000/yr can offset ordinary (W-2) income if you actively participate and your MAGI is under $100k (phasing out to $0 by $150k); unused losses carry forward. On sale, claimed depreciation is recaptured at up to 25%, and gains may owe capital-gains tax (a 1031 exchange can defer both). Figures are a year-1 estimate at your 24.0% rate — not tax advice; consult a CPA.
Schools (NCES district)
- District
- St. Vrain Valley School District No. Re1J
- NCES district ID
- 0805370
- Math proficiency
- 32% ▼ -8.00%
- Reading proficiency
- 51% ▬ 0.00%
- Median HH income
- $71,571
- Composite
- 37.73/100
- National rank
- #4353
- State rank
- #23 of 86 in CO
Livability — Firestone
- Score
- 73/100
- State rank
- #44
- US rank
- #5060
Category grades
Schools grade is shown separately in the Schools card above.
Census & demographics
- County
- Weld County · 332,652 people
- City population
- 1,684
- Metro
- Greeley, CO
- Population (ZIP)
- 63,451
- Household income
- $113,643
- Rent vs Own
- Severe rent burden
- 1028.0
Population outlook (Weld County) Hauer SSP2
- Today (2025)
- 351,957 people
- By 2030
- 385,304 · +9.5%
- By 2040
- 451,818 · +28.4%
- By 2050
- 514,478 · +46.2%
- By 2075
- 648,733 · +84.3%
- By 2100
- 720,400 · +104.7%
Race, ethnicity, and origin ACS 2023
- Neighborhood character
- Predominantly White (68%)
- Race & ethnicity
- White 68% Hispanic / Latino 24% Two or more races 13% Asian 3%
- Hispanic origin (detail)
- Mexican 18%
- Common ancestry
- Lithuanian 3% Italian 2% Iranian 2%
- Foreign-born
- 8% · Canada, Vietnam
- Languages at home
- 84% English-only · Spanish 13% Other Asian/Pacific 1%
Political lean MEDSL · Weld
- 2024 margin
- Strong R (+21.0) · D 38.2% · R 59.2% · Other 2.6%
- 2008→2024 swing
- -12.2pp toward R · 2008: -8.7pp · 2024: -21.0pp
- All cycles
- 2024: R+21.0 2020: R+18.0 2016: R+22.4 2012: R+13.2 2008: R+8.7
Not yet ingested
- Civics
- —
Market trends
- HPI YoY
- ▼ -534.45%
- Current HPI
- 245.1351
- Rent YoY
- ▼ -2.34%
- Metro
- Greeley, CO
- State GDP YoY
- ▲ 1.95%
- F500 in state
- 14
Industry mix (Fortune 500 HQ in CO)
| Industry | F500 HQs | Revenue |
|---|---|---|
| Technology Distribution | 1 | $31B |
|
||
| Food / Agriculture | 1 | $18B |
|
||
| Packaging | 1 | $14B |
|
||
| Healthcare | 1 | $13B |
|
||
| Energy | 1 | $10B |
|
||
| Technology | 1 | $4B |
|
||
Price history
+164.6% since first listed3 events — show timeline
- 2026-05-08 Listed $179,900 IRES
- 2025-12-19 Sold (Public Records) $58,200 Public Records
- 2004-11-29 Sold (Public Records) $68,000 Public Records
Property tax history
-5.1%/yrLatest (2024): $133 · +4.2% YoY. Source: county tax records.
Cash-flow waterfall
monthlySold comps — $/sqft
last 12 mo · ≤1 miLoading sold comps…