 Duplex
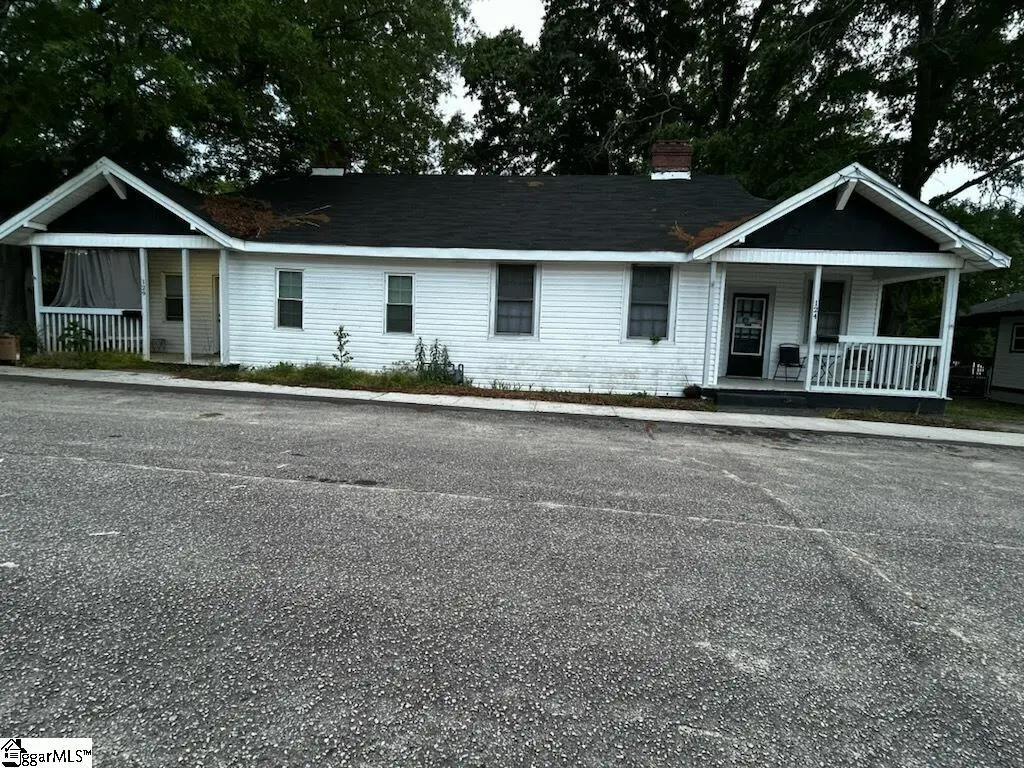
124 Rice St · Belton, SC
Flood risk 1/10 · Minimal
- FEMA flood zone
- X (unshaded)
- Chance of flooding over 30 yrs
- 0.0%
- Est. flood insurance / yr
- $507 – $1,088
Fire risk 4/10 · Minor
- Est. fire insurance / yr
- $783 – $1,453
Heat risk 6/10 · Moderate
- Hot days now (above 105°F)
- 7 days/yr
- Hot days in 30 yrs
- 17 days/yr
Wind risk 3/10 · Minor
- Chance of severe wind over 30 yrs
- 4.0%
Air-quality risk 3/10 · Minor
- Unhealthy air days now
- 2 days/yr
- Unhealthy air days in 30 yrs
- 4 days/yr
Risk factors via First Street. Map © Google.
Why this score? — see what drove the B grade
The composite is a weighted blend of 9 inputs, each scored 0–100. Each bar is that input's sub-score; the figure is the points it added to the 100-point composite (weight × sub-score).
- Cash flow +29.8/30.0
- DSCR +10.0/10.0
- 1% rule +7.9/10.0
- ARV discount +7.5/15.0
- Schools +4.1/10.0
- Livability +3.7/5.0
- Appreciation +2.6/10.0
- Rent growth +2.5/5.0
- Condition / age +2.5/5.0
$178,999
🖨 Deal sheet 📄 Offer letter ✓ Due diligence
Multi-family units
County records classify this as Multi-Family (2-4 Unit). Listing-text estimate: 2 units. confirmed
Listing remarks
Welcome to an investment opportunity in Belton SC. This duplex was recently updated and is income bearing. Leases are in place until the end of June one side is $925 and other is $975. With tenants in place inspections please do not disturb. With approved offer you will be able to preform any inspections.
Key facts
- 0.27 acre lot
- 2 parking spots
- Built 1950
Property features AI
Finance
- HOA & community: No community amenities listed
Exterior
- Parking: On-street parking
- Utilities: Public water; Public sewer; Electric water heater; Public garbage pickup
- Home design: Single-story building; Built circa 1950; Crawl space foundation; Lot roughly 97 x 119 x 97 x 119
- Construction: Architectural roof
- Exterior features: Vinyl siding
Interior
- Kitchen: Unit 2 includes refrigerator and electric cooktop
- Bedrooms: Unit 1: 2 bedrooms; Unit 2: 2 bedrooms
- Bathrooms: Unit 1: 1 full bathroom; Unit 2: 1 full bathroom
- Heating & cooling: Ductless heating; Ductless cooling
- Interior features: Two separate utility meters for electric, gas and water; Units 3 and 4 have no listed features
- Laundry & utility: Separate utility meters for each unit (electric, gas, water)
Neighborhood map
What this means for you Summary
Snapshot
- This is a 2 × 2-bed/1.0-bath units multifamily listed at $179k.
Deal economics
- At list price, monthly cash flow is $658 ($8k/yr) — positive. Per door: $329/mo.
- The deal already cash-flows at list — no discount required.
- Meets the 1% rule at list price ($2k rent vs $179k).
- Recommended offer: $174k (3.0% below list) — sets the bar for market timing.
- Cap rate 10.7% vs local median 4.3% in Belton — top-decile yield for the area; either an underpriced asset or a hidden risk that comps aren't pricing in. Stress-test before assuming the spread holds.
Location & tenants
- Location reads 74/100 on livability (#32 in SC, #4,723 nationally) — a middle-class / working-renter tenant base. Strengths: cost of living A+, health & safety A+, housing A; Watch: commute F, employment F.
- Anderson 02 (rural): math 46% / reading 52% proficiency, ranked #16 of 80 in SC (top 20%) — families likely to look elsewhere, expect single-tenant / working-renter base with shorter leases.
- Zoned schools: Belton Elementary (math 48% / reading 47%, grade D, #199 of 597 statewide, top 35%, 372 students, 86% FRL) — zoned schools average 86% FRL vs 46% district-wide (39 pts higher); higher-poverty schools than district average — tighter screening recommended.
- Market conditions: 134 active listings in the ZIP; 1 comparable units currently listed for rent nearby; 1,255 units permitted in Anderson County in 2024 (0 in 5+ unit buildings).
Forward outlook
- Local home prices are declining (-3.0%/yr); year-one equity from $1k of loan paydown is wiped out by about $5k of value loss. Plan a longer hold.
- Anderson County population projected at +14% by 2050 — modest demand growth; plan on rents tracking national, not racing it.
- At projected returns (-3.0% appreciation + 3.0% rent growth), your $50k cash investment doubles in ~8 years — after that, you're playing with house money.
Negotiation context
- It's been on market 48 days — a 3% lower offer ($174k) is reasonable based on typical stale-listing flexibility.
- Current owner paid $100k; list at $179k implies a 79% gain — meaningful room to come down on a strong offer.
Risks & watch-outs
- Watch-outs: built in 1950 — expect roof / HVAC / electrical / plumbing capex.
- Climate carrying-cost: extreme-heat days projected 7→17/yr by 2055 (HVAC capex compounding) — expect insurance premiums to compound above CPI over the hold.
Questions for the listing agent
- It's been on market 48 days. Have you received any prior offers? Is the seller open to a 3% concession, seller financing, or rate buy-down credit?
- Can we see the unit-by-unit rent roll, current vacancy, and any below-market leases? What's the average tenancy length?
- What capital expenditures (roof, boiler, parking lot, exteriors) have been made in the last 5 years, and what's planned in the next 2?
- Built in 1950 — when were the roof, HVAC, electrical panel, plumbing, and water heater last replaced?
- Is there a deadline driving the sale (1031 exchange, divorce, estate, relocation)? That informs how much negotiation room exists.
- What's the average days-on-market for RENTAL listings here right now (not sales)? A rising rental-DOM trend means longer vacancies and softer asking-rent achievability than the comps imply.
- What's the recent tenant-quality profile in this submarket — average credit score on applications, eviction rate, late-payment / NSF rate, and stable-employment percentage? A property-management company in the area should have these aggregated.
- How much new apartment / multifamily construction is in the pipeline within 1–3 miles? Heavy new supply (>2% of stock underway) typically softens rents 12–24 months out; light construction supports rent growth.
Investment metrics
- 1% rule
- 1.29% ✓
- Cap rate
- 10.70%
- Cash-on-cash
- 15.75%
- DSCR
- 1.70
- GRM
- 6.5
CMA / ARV
No comps found within radius.
Projected returns pro-forma
-3.0% appreciation · 3.0% rent growth · sell at horizon
- IRR
- 6.6%
- Equity multiple
- 1.26×
- Total profit
- $12,889
- Equity at exit
- $26,689
- IRR
- 15.9%
- Equity multiple
- 2.30×
- Total profit
- $65,147
- Equity at exit
- $15,477
Cash invested: $50,120 (down + closing). Projections, not guarantees.
Landlord ↔ Tenant lean methodology
- Overall (STATE)
- 90 Strongly Landlord-Friendly
- State South Carolina
- 90 Strongly Landlord-Friendly · R+6
- County
- — inherits STATE
- City
- — inherits STATE
ZIP-level market 29627
- Home prices YoY
- -1.3%
- Active inventory
- 134
- Price-to-rent
- 12.9×
Monthly cashflow live
- Estimated rent
- $2,310 medium interval (Pro) →
- Mortgage (P&I)
- −$939
- Tax from tax record
- −$154 /mo · $1,845/yr
- Insurance
- −$75
- HOA
- −$0
- Vacancy / Maint / Mgmt
- −$485
- Net cashflow
- $658
Break-even live
2-unit breakdown (identical units grouped — click to expand)
| Units | Beds | Baths | Est. rent |
|---|---|---|---|
| 2× units | 2 | 1 | $2,310 |
| #1 | 2 | 1 | $1,155 |
| #2 | 2 | 1 | $1,155 |
| Total (2 units) | $2,310 | ||
UW: 25.0% down · 7.5% · 30yr · 1.5% tax · 5.0% vac · 8.0% maint · 8.0% mgmt
Financing live
Cash to close
- Down payment
- $44,750
- Closing costs
- $5,370
- Reserves months
- —
- Total cash needed
- —
Loan-product check · same deal, 3 products live
Conventional
25% down · 7.5% · 30yr
- Down + closing
- —
- Monthly P&I
- —
- Monthly cashflow
- —
- DSCR
- —
- Eligible?
- —
Personal DTI + credit; lowest rate.
DSCR
20% down · 8.5% · 30yr
- Down + closing
- —
- Monthly P&I
- —
- Monthly cashflow
- —
- DSCR
- —
- Eligible?
- —
No personal income docs; deal must DSCR.
Hard money
10% down · 12.0% · 12mo
- Down + closing
- —
- Monthly P&I
- —
- Monthly cashflow
- —
- DSCR
- —
- Eligible?
- —
Short-term bridge; refi at stabilization.
Rent comps 1 comps
| Address | Beds | Baths | Sqft | Rent | $/sqft | DOM | Units | Dist |
|---|---|---|---|---|---|---|---|---|
| 130 Ellison St Belton, SC | 3.0 | 2.0 | 1400 | $1,550 | $1.11 | 2d | 1 | 0.23mi |
Listing history 19 events
-
2026-06-18days on market $178,999 Active 48 DOM
-
2026-06-17days on market $178,999 Active 47 DOM
-
2026-06-16days on market $178,999 Active 46 DOM
-
2026-06-15days on market $178,999 Active 45 DOM
-
2026-06-13days on market $178,999 Active 43 DOM
-
2026-06-10days on market $178,999 Active 40 DOM
-
2026-06-09days on market $178,999 Active 39 DOM
-
2026-06-08days on market $178,999 Active 38 DOM
-
2026-06-07days on market $178,999 Active 37 DOM
-
2026-06-03days on market $178,999 Active 33 DOM
-
2026-06-03days on market $178,999 Active 32 DOM
-
2026-06-01days on market $178,999 Active 31 DOM
-
2026-05-31days on market $178,999 Active 30 DOM
-
2026-05-19price $178,999
-
2026-05-01$179,999 Active
-
2025-07-29soldstatus $100,000
-
2015-12-31soldstatus $22,000
-
2014-02-28soldstatus $16,000
-
1996-12-31soldstatus $16,500
ⓘ Source: listings_history table (triggers on properties + properties_extension) + one-shot
backfill from property_details.listing_events for pre-trigger history.
Tax reassessment forecast SC · Resets to sale price
- Current annual tax
- $1,845 · $154/mo
- Projected year-2 tax
- $1,845 · $154/mo
- Expected delta
- $0/yr ($0/mo · -0.0%)
ⓘ Screening estimate from a state-policy table — verify with the county assessor before closing.
Climate risk First Street
- Flood 1/10 Low FEMA zone X (unshaded) · 0% chance over 30 yrs
- Wildfire 4/10 Moderate
- Heat 6/10 Major 7 d/yr ≥105°F today · 17 d/yr by 30 yrs out
- Wind 3/10 Moderate 4% chance of damaging wind over 30 yrs
- Air quality 3/10 Moderate 2 unhealthy d/yr today · 4 by 30 yrs out
Nearby sold comps map
Loading sold comps map…
Walkable amenities ~0.75 mi
Loading nearby amenities…
Taxation est. · year 1
- Rental income
- $27,720
- − Mortgage interest
- −$10,027
- − Property taxes
- −$1,845
- − Insurance
- −$895
- − Repairs & maintenance
- −$2,218
- − Management
- −$2,218
- − Depreciation
- −$5,207
- Taxable income
- $5,311
- Est. tax owed @ 24.0%
- −$1,275
- After-tax cash flow
- $6,620/yr
For passive investors: Depreciation is non-cash, so a rental often shows a tax loss while cash-flowing — sheltering income. Rental losses are passive: they offset passive income freely, and up to $25,000/yr can offset ordinary (W-2) income if you actively participate and your MAGI is under $100k (phasing out to $0 by $150k); unused losses carry forward. On sale, claimed depreciation is recaptured at up to 25%, and gains may owe capital-gains tax (a 1031 exchange can defer both). Figures are a year-1 estimate at your 24.0% rate — not tax advice; consult a CPA.
Schools (NCES district)
- District
- Anderson 02
- NCES district ID
- 4500810
- Math proficiency
- 46% ▼ -1.00%
- Reading proficiency
- 52% ▲ 5.00%
- Median HH income
- $38,940
- Composite
- 40.88/100
- National rank
- #3623
- State rank
- #16 of 80 in SC
Livability — Belton
- Score
- 74/100
- State rank
- #32
- US rank
- #4723
Category grades
Schools grade is shown separately in the Schools card above.
Census & demographics
- Census place
- Belton, SC
- City population
- 16,518
- Population (ZIP)
- 16,518
Population outlook (Anderson County) Hauer SSP2
- Today (2025)
- 210,546 people
- By 2030
- 217,791 · +3.4%
- By 2040
- 230,643 · +9.5%
- By 2050
- 240,220 · +14.1%
- By 2075
- 259,518 · +23.3%
- By 2100
- 258,696 · +22.9%
Race, ethnicity, and origin ACS 2023
- Neighborhood character
- Predominantly White (83%)
- Race & ethnicity
- White 83% Black 12% Two or more races 4% Hispanic / Latino 2%
- Common ancestry
- Serbian 3% Slovak 2% Lithuanian 1%
- Foreign-born
- 2% · Canada
- Languages at home
- 97% English-only · Russian/Polish/Slavic 2% Spanish 1%
Political lean MEDSL · Anderson
- 2024 margin
- Solid R (+47.4) · D 25.7% · R 73.1% · Other 1.2%
- 2008→2024 swing
- -14.1pp toward R · 2008: -33.3pp · 2024: -47.4pp
- All cycles
- 2024: R+47.4 2020: R+42.0 2016: R+43.7 2012: R+36.4 2008: R+33.3
Not yet ingested
- Civics
- —
Market trends
- HPI YoY
- ▼ -4.78%
- Current HPI
- 355.0273
- Rent YoY
- —
- Metro
- —
- State GDP YoY
- ▲ 4.51%
- F500 in state
- 2
Industry mix (Fortune 500 HQ in SC)
| Industry | F500 HQs | Revenue |
|---|---|---|
| Packaging | 1 | $7B |
|
||
Price history
+984.8% since first listed6 events — show timeline
- 2026-05-19 Price Changed $178,999 Greater Greenville MLS
- 2026-05-01 Listed $179,999 Greater Greenville MLS
- 2025-07-29 Sold (Public Records) $100,000 Public Records
- 2015-12-31 Sold (Public Records) $22,000 Public Records
- 2014-02-28 Sold (Public Records) $16,000 Public Records
- 1996-12-31 Sold (Public Records) $16,500 Public Records
Property tax history
+10.3%/yrLatest (2025): $1,845 · +93.6% YoY. Source: county tax records.
Cash-flow waterfall
monthlySold comps — $/sqft
last 12 mo · ≤1 miLoading sold comps…