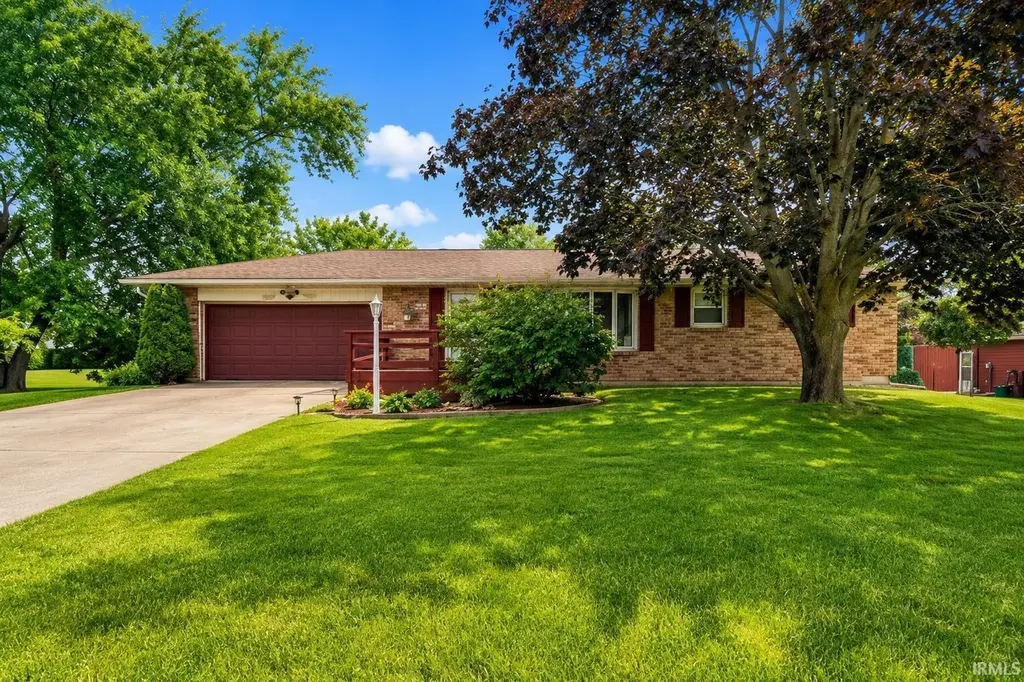
2824 Grape Rd · Mishawaka, IN
Flood risk 1/10 · Minimal
- FEMA flood zone
- X (unshaded)
- Chance of flooding over 30 yrs
- 0.0%
- Est. flood insurance / yr
- $473 – $860
Fire risk 1/10 · Minimal
- Est. fire insurance / yr
- $717 – $1,331
Heat risk 3/10 · Minor
- Hot days now (above 99°F)
- 7 days/yr
- Hot days in 30 yrs
- 16 days/yr
Wind risk 2/10 · Minimal
- Chance of severe wind over 30 yrs
- —
Air-quality risk 3/10 · Minor
- Unhealthy air days now
- 2 days/yr
- Unhealthy air days in 30 yrs
- 3 days/yr
Risk factors via First Street. Map © Google.
Why this score? — see what drove the D- grade
The composite is a weighted blend of 9 inputs, each scored 0–100. Each bar is that input's sub-score; the figure is the points it added to the 100-point composite (weight × sub-score).
- Cash flow +13.7/30.0
- Schools +5.1/10.0
- DSCR +4.1/10.0
- Rent growth +3.8/5.0
- Livability +3.8/5.0
- 1% rule +3.1/10.0
- Condition / age +2.5/5.0
- ARV discount +0.0/15.0
- Appreciation +0.0/10.0
$219,900
🖨 Deal sheet (PDF) 📄 Offer letter ✓ Due diligence
Listing remarks MLS
Amazing quality awaits in this MOVE-IN READY home in Mishawaka! New paint! New carpet! New stainless steel appliances! Tile showers! FINISHED BASEMENT! Many updated lighting and flooring fixtures! UPDATED THROUGHOUT! Don't miss your chance on this home! Call, text, or email for your own personal showing today!
Key facts
- Bright living area
- All brick ranch
- Welcoming front deck
Tags
Property features AI
Exterior
- Parking: Attached 2-car garage
- Utilities: Public water; Public sewer
- Home design: Single-family residence (site-built); One-story
- Construction: Brick construction
- Exterior features: Deck; Full chain-link fencing; Outbuilding
Interior
- Kitchen: Dishwasher; Refrigerator; Gas oven; Gas range
- Bedrooms: Master downstairs
- Flooring: Hardwood; Carpet; Tile
- Bathrooms: 2 full bathrooms (both on main level)
- Heating & cooling: Natural gas forced-air heating; Central air conditioning
- Interior features: Eat-in kitchen; Master bedroom on main level; Finished full basement
- Laundry & utility: Laundry in basement
Neighborhood map
What this means for you Summary
Snapshot
- This is a 3-bed/1.5-bath single-family listed at $220k.
Deal economics
- At list price, monthly cash flow is $15 ($184/yr) — positive.
- The deal already cash-flows at list — no discount required.
- To meet the 1% rule (rent ≥ 1% of price), the offer needs to be $177k (19.3% below list).
- Recommended offer: $177k (19.3% below list) — sets the bar for 1% rule.
- Cap rate 6.4% vs local median 5.3% in Mishawaka — meaningfully above typical; check what's discounted (condition, days-on-market, listing class) to confirm the premium yield is real.
Location & tenants
- Location reads 76/100 on livability (#53 in IN, #3,586 nationally) — a middle-class / working-renter tenant base. Strengths: cost of living A+, housing A+, health & safety B; Watch: amenities F, employment F.
- Penn-Harris-Madison School Corporation (suburban): math 54% / reading 64% proficiency, ranked #19 of 301 in IN (top 6%) — acceptable for families but not a draw, mixed tenant base, ~2y average lease.
- Zoned schools: Walt Disney Elementary School (math 41% / reading 38%, grade F, #500 of 994 statewide, top 53%, 521 students, 56% FRL); Schmucker Middle School (math 40% / reading 56%, grade C-, #60 of 330 statewide, top 18%, 1,004 students, 36% FRL); Penn High School (math 53% / reading 83%, grade B, #22 of 369 statewide, top 6%, 3,624 students, 27% FRL) — zoned schools average 40% FRL vs 21% district-wide (19 pts higher); higher-poverty schools than district average — tighter screening recommended.
- Market conditions: Rents rising fast (+5.2%/yr); 78 active listings in the ZIP; 8 comparable units currently listed for rent nearby; rentals at typical pace (median 16d on market — plan ~3-4 weeks tenant-placement turnaround); 754 units permitted in St. Joseph County in 2024 (460 in 5+ unit buildings).
- This rent runs 37% of the median local income ($57k/yr) — at the standard rent-burdened threshold; future hikes will face affordability resistance.
Forward outlook
- Local home prices are declining (-3.0%/yr); year-one equity from $2k of loan paydown is wiped out by about $7k of value loss. Plan a longer hold.
Negotiation context
- Only 2 days on market — expect competitive offers; lowballing is unlikely to land.
- 2 sale attempts since 11y ago with the ask held roughly flat each time — persistent listings suggest the price (not the market) is what's stuck; bring a comps-based counter.
- Current owner paid $119k; list at $220k implies a 85% gain — meaningful room to come down on a strong offer.
Questions for the listing agent
- Built in 1975 — when were the roof, HVAC, electrical panel, plumbing, and water heater last replaced?
- Is there a deadline driving the sale (1031 exchange, divorce, estate, relocation)? That informs how much negotiation room exists.
- The area grade is low — what's the realistic commute time and amenity access for the typical tenant pool here? Any planned neighborhood developments (good or bad) we should know about?
- What's the average days-on-market for RENTAL listings here right now (not sales)? A rising rental-DOM trend means longer vacancies and softer asking-rent achievability than the comps imply.
- What's the recent tenant-quality profile in this submarket — average credit score on applications, eviction rate, late-payment / NSF rate, and stable-employment percentage? A property-management company in the area should have these aggregated.
- How much new for-sale + rental construction is in the pipeline within 1–3 miles? Heavy new supply typically softens prices + rents 12–24 months out; constrained supply supports both.
Investment metrics
- 1% rule
- 0.81% ✗
- Cap rate
- 6.38%
- Cash-on-cash
- 0.30%
- DSCR
- 1.01
- GRM
- 10.3
CMA / ARV
- ARV (on-the-fly)
- $173,075
- Comps found
- 12
Show comp detail 12 sales within ~0.75 mi
| Address | Dist | Beds/Ba | Sqft | Sold | Price | $/sf | Match |
|---|---|---|---|---|---|---|---|
| 203 Palau Ave | 0.36mi | 3/1.0 | 1,065 (-1%) | 8mo | $167,000 | $157 | 73 |
| 135 Guam Ave | 0.46mi | 3/1.0 | 1,103 (+3%) | 2mo | $179,900 | $163 | 71 |
| 2338 Normandy Dr | 0.59mi | 3/1.0 | 1,080 (+0%) | 8mo | $163,000 | $151 | 63 |
| 2709 N Main St | 0.27mi | 3/1.0 | 1,182 (+10%) | 8mo | $160,000 | $135 | 62 |
| 924 Whitehall Dr | 0.60mi | 3/1.5 | 1,120 (+4%) | 5mo | $210,000 | $188 | 61 |
| 2530 Grape Rd | 0.23mi | 3/2.0 | 1,212 (+13%) | 6mo | $215,000 | $177 | 61 |
| 2604 Normandy Dr | 0.49mi | 3/1.5 | 1,198 (+11%) | 1mo | $175,000 | $146 | 57 |
| 1117 Whitehall Dr | 0.67mi | 3/1.5 | 1,120 (+4%) | 6mo | $180,000 | $161 | 57 |
| 201 E Russ Ave | 0.63mi | 3/1.0 | 1,008 (-6%) | 4mo | $210,000 | $208 | 55 |
| 2407 N Main St | 0.38mi | 2/1.0 (-1) | 1,202 (+12%) | 9mo | $153,000 | $127 | 48 |
| 710 Patterson Dr | 0.71mi | 4/1.0 (+1) | 1,176 (+9%) | 0mo | $115,000 | $98 | 44 |
| 2424 Normandy Dr | 0.53mi | 2/2.0 (-1) | 916 (-15%) | 4mo | $172,000 | $188 | 40 |
Match score weights: distance 35% · size 25% · config 20% · recency 20%. Top-matched comps best support the ARV.
Projected returns pro-forma
-3.0% appreciation · 5.2% rent growth · sell at horizon
- IRR
- -13.6%
- Equity multiple
- 0.50×
- Total profit
- $-30,699
- Equity at exit
- $32,788
- IRR
- -1.9%
- Equity multiple
- 0.86×
- Total profit
- $-8,476
- Equity at exit
- $19,013
Cash invested: $61,572 (down + closing). Projections, not guarantees.
Landlord ↔ Tenant lean methodology
- Overall (STATE)
- 90 Strongly Landlord-Friendly
- State Indiana
- 90 Strongly Landlord-Friendly · R+11
- County
- — inherits STATE
- City
- — inherits STATE
ZIP-level market 46545
- Rents YoY
- 5.2%
- Active inventory
- 78
- Price-to-rent
- 10.3×
Monthly cashflow live
- Estimated rent
- $1,774 high interval (Pro) →
- Mortgage (P&I)
- −$1,153
- Tax from tax record
- −$141 /mo · $1,692/yr
- Insurance
- −$92
- HOA
- −$0
- Vacancy / Maint / Mgmt
- −$372
- Net cashflow
- $15
Break-even live
Sensitivity live
| Price | -10% $140 | -5% $78 | +0% $15 | +5% $-47 | +10% $-109 |
|---|---|---|---|---|---|
| Rent | -10% $-125 | -5% $-55 | +0% $15 | +5% $85 | +10% $155 |
| Rate | -1.0pp $126 | -0.5pp $71 | base $15 | +0.5pp $-42 | +1.0pp $-100 |
UW: 25.0% down · 7.5% · 30yr · 1.5% tax · 5.0% vac · 8.0% maint · 8.0% mgmt
Financing live
Cash to close
- Down payment
- $54,975
- Closing costs
- $6,597
- Reserves months
- —
- Total cash needed
- —
Loan-product check · same deal, 3 products live
Conventional
25% down · 7.5% · 30yr
- Down + closing
- —
- Monthly P&I
- —
- Monthly cashflow
- —
- DSCR
- —
- Eligible?
- —
Personal DTI + credit; lowest rate.
DSCR
20% down · 8.5% · 30yr
- Down + closing
- —
- Monthly P&I
- —
- Monthly cashflow
- —
- DSCR
- —
- Eligible?
- —
No personal income docs; deal must DSCR.
Hard money
10% down · 12.0% · 12mo
- Down + closing
- —
- Monthly P&I
- —
- Monthly cashflow
- —
- DSCR
- —
- Eligible?
- —
Short-term bridge; refi at stabilization.
Rent comps 8 comps
| Address | Beds | Baths | Sqft | Rent | $/sqft | DOM | Units | Dist |
|---|---|---|---|---|---|---|---|---|
| 300 Pin Oak Cir Mishawaka, IN | 1.0–3.0 | 1.0–1.5 | 835 | $1,225 | $1.47 | 15d | 1 | 0.32mi |
| 117 Palau Ave Mishawaka, IN | 3.0 | 1.0 | 1100 | $1,650 | $1.50 | 15d | 1 | 0.33mi |
| 303 Village Dr Mishawaka, IN | 1.0–3.0 | 1.0–1.5 | 918 | $1,975 | $2.15 | 15d | 25 | 0.42mi |
| 302 Village Dr Mishawaka, IN | 1.0–3.0 | 1.0–1.5 | 950 | $2,043 | $2.15 | 15d | 33 | 0.52mi |
| 209 E Edgar Ave Mishawaka, IN | 3.0 | 1.0 | 1400 | $1,400 | $1.00 | 15d | 1 | 0.90mi |
| 3001 E Jefferson Blvd South Bend, IN | 1.0–2.0 | 1.0–2.0 | 848 | $1,329 | $1.57 | 15d | 21 | 1.16mi |
| 116 W Mishawaka Ave Mishawaka, IN | 3.0 | 1.0–2.0 | 948 | $2,321 | $2.45 | 15d | 31 | 1.42mi |
| 232 E Grove St Mishawaka, IN | 3.0 | 1.0 | 1188 | $1,500 | $1.26 | 15d | 1 | 1.43mi |
Listing history 3 events
-
2026-06-22status $219,900 Pending 2 DOM
-
2026-06-21remarks 695-char remark
-
2026-06-21$219,900 Active 2 DOM
ⓘ Source: listings_history table (triggers on properties + properties_extension) + one-shot
backfill from property_details.listing_events for pre-trigger history.
Tax reassessment forecast IN · Partial reset (capped growth)
- Current annual tax
- $1,692 · $141/mo
- Projected year-2 tax
- $1,781 · $148/mo
- Expected delta
- +$88/yr (+$7/mo · 5.2%)
ⓘ Screening estimate from a state-policy table — verify with the county assessor before closing.
Climate risk First Street
- Flood 1/10 Low FEMA zone X (unshaded) · 0% chance over 30 yrs
- Wildfire 1/10 Low
- Heat 3/10 Moderate 7 d/yr ≥99°F today · 16 d/yr by 30 yrs out
- Wind 2/10 Low
- Air quality 3/10 Moderate 2 unhealthy d/yr today · 3 by 30 yrs out
Nearby sold comps map
Loading sold comps map…
Walkable amenities ~0.75 mi
Loading nearby amenities…
Taxation est. · year 1
- Rental income
- $21,284
- − Mortgage interest
- −$12,318
- − Property taxes
- −$1,692
- − Insurance
- −$1,100
- − Repairs & maintenance
- −$1,703
- − Management
- −$1,703
- − Depreciation
- −$6,397
- Taxable loss
- −$3,628
- Est. tax savings @ 24.0%
- +$871
- After-tax cash flow
- $1,055/yr
For passive investors: Depreciation is non-cash, so a rental often shows a tax loss while cash-flowing — sheltering income. Rental losses are passive: they offset passive income freely, and up to $25,000/yr can offset ordinary (W-2) income if you actively participate and your MAGI is under $100k (phasing out to $0 by $150k); unused losses carry forward. On sale, claimed depreciation is recaptured at up to 25%, and gains may owe capital-gains tax (a 1031 exchange can defer both). Figures are a year-1 estimate at your 24.0% rate — not tax advice; consult a CPA.
Schools (NCES district)
- District
- Penn-Harris-Madison School Corporation
- NCES district ID
- 1808760
- Math proficiency
- 54% ▼ -11.00%
- Reading proficiency
- 64% ▼ -6.00%
- Median HH income
- $59,421
- Composite
- 51.11/100
- National rank
- #1764
- State rank
- #19 of 301 in IN
Livability — Mishawaka
- Score
- 76/100
- State rank
- #53
- US rank
- #3586
Category grades
Schools grade is shown separately in the Schools card above.
Census & demographics
- Census place
- Mishawaka, IN
- County
- Saint Joseph County · 189,048 people
- City population
- 57,683
- Metro
- South Bend-Mishawaka, IN-MI
- Population (ZIP)
- 26,606
- Household income
- $56,865
- Rent vs Own
- Severe rent burden
- 1243.0
Population outlook (St. Joseph County) Hauer SSP2
- Today (2025)
- 273,186 people
- By 2030
- 273,594 · +0.1%
- By 2040
- 271,641 · -0.6%
- By 2050
- 269,187 · -1.5%
- By 2075
- 263,136 · -3.7%
- By 2100
- 245,659 · -10.1%
Race, ethnicity, and origin ACS 2023
- Neighborhood character
- Predominantly White (78%)
- Race & ethnicity
- White 78% Two or more races 8% Black 7% Hispanic / Latino 6% Asian 3%
- Hispanic origin (detail)
- Mexican 2%
- Common ancestry
- Romanian 6% Lithuanian 2% English 2%
- Foreign-born
- 8% · Canada, China, South Korea
- Languages at home
- 90% English-only · Spanish 4% Chinese 1% Other Indo-European 1%
Political lean MEDSL · St. Joseph
- 2024 margin
- Toss-up / Even · D 50.0% · R 48.5% · Other 1.5%
- 2008→2024 swing
- -15.6pp toward R · 2008: 17.1pp · 2024: 1.5pp
- All cycles
- 2024: D+1.5 2020: D+5.8 2016: D+0.2 2012: D+3.5 2008: D+17.1
Not yet ingested
- Civics
- —
Market trends
- HPI YoY
- ▼ -114.83%
- Current HPI
- 188.2811
- Rent YoY
- ▲ 5.20%
- Metro
- South Bend-Mishawaka, IN-MI
- State GDP YoY
- ▲ 2.90%
- F500 in state
- 18
Industry mix (Fortune 500 HQ in IN)
| Industry | F500 HQs | Revenue |
|---|---|---|
| Industrial Machinery | 2 | $37B |
|
||
| Healthcare | 1 | $177B |
|
||
| Pharmaceuticals | 1 | $45B |
|
||
| Metals / Steel | 1 | $18B |
|
||
| Agriculture | 1 | $17B |
|
||
| Packaging | 1 | $12B |
|
||
Price history
+83.4% since first listed3 events — show timeline
- 2026-06-19 Listed $219,900 IRMLS
- 2016-02-26 Sold (MLS) $118,700 IRMLS
- 2015-11-10 Listed $119,900 IRMLS
Property tax history
-0.3%/yrLatest (2025): $1,692 · -6.6% YoY. Source: county tax records.
Cash-flow waterfall
monthlySold comps — $/sqft
last 12 mo · ≤1 miLoading sold comps…