411 N Main St · North Sea, NY
Flood risk 1/10 · Minimal
- FEMA flood zone
- X (unshaded)
- Chance of flooding over 30 yrs
- 0.0%
- Est. flood insurance / yr
- $473 – $860
Fire risk 2/10 · Minimal
- Est. fire insurance / yr
- $691 – $1,283
Heat risk 4/10 · Minor
- Hot days now (above 90°F)
- 7 days/yr
- Hot days in 30 yrs
- 20 days/yr
Wind risk 8/10 · Major
- Chance of severe wind over 30 yrs
- 80.0%
Air-quality risk 3/10 · Minor
- Unhealthy air days now
- 3 days/yr
- Unhealthy air days in 30 yrs
- 4 days/yr
Risk factors via First Street. Map © Google.
Why this score? — see what drove the D- grade
The composite is a weighted blend of 9 inputs, each scored 0–100. Each bar is that input's sub-score; the figure is the points it added to the 100-point composite (weight × sub-score).
- ARV discount +10.5/15.0
- Cash flow +8.5/30.0
- Rent growth +5.0/5.0
- Schools +4.8/10.0
- Livability +2.9/5.0
- 1% rule +2.6/10.0
- Condition / age +2.5/5.0
- DSCR +2.3/10.0
- Appreciation +0.0/10.0
$1,995,000
🖨 Deal sheet 📄 Offer letter ✓ Due diligence
Listing remarks MLS
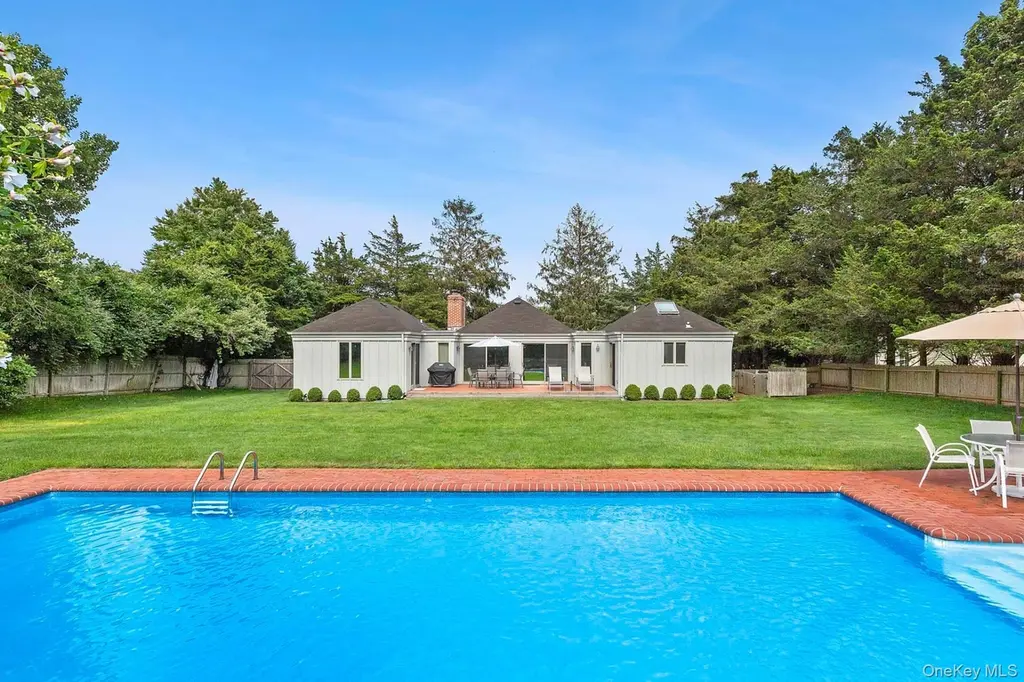
Conveniently located in Southampton, just 2 blocks to the heart of the Village, this 3 bedroom 2 bath home is perfect for your Hampton's getaway. Meticulously kept with light and bright open floor plan enjoy all the Hamptons have to offer. Relax around the heated pool overlooking your expansive yard, or venture to the coveted ocean beaches just minutes away., Additional information: Appearance:excellent,Interior Features:Lr/Dr
Key facts
- Expansive yard
- Prime location
- Heated pool
Tags
Neighborhood map
What this means for you Summary
Snapshot
- This is a 2-bed/2.0-bath single-family listed at $2.00M.
Deal economics
- At list price, monthly cash flow is $-2k ($-21k/yr) — negative.
- To cash-flow at today's rent, offer at most $1.74M (12.7% below list).
- To meet the 1% rule (rent ≥ 1% of price), the offer needs to be $1.52M (23.6% below list).
- Recommended offer: $1.52M (23.6% below list) — sets the bar for 1% rule.
Location & tenants
- Location reads 58/100 on livability (#1,063 in NY) — a working-class tenant base; expect higher turnover. Strengths: crime A+, employment A+; Watch: housing C-, amenities F, commute F.
- Southampton Union Free School District (suburban): math 53% / reading 51% proficiency, ranked #293 of 590 in NY (top 50%) — acceptable for families but not a draw, mixed tenant base, ~2y average lease.
- Zoned schools: Southampton Elementary School (math 42% / reading 57%, grade D, #1,085 of 2,108 statewide, top 56%, 376 students, 51% FRL); Southampton Intermediate School (math 30% / reading 47%, grade F, #437 of 729 statewide, top 60%, 363 students, 44% FRL); Southampton High School (math 98%, 595 students, 48% FRL) — zoned schools average 48% FRL vs 30% district-wide (17 pts higher); higher-poverty schools than district average — tighter screening recommended.
- Market conditions: Rents rising fast (+14.6%/yr); 95 active listings in the ZIP; 9 comparable units currently listed for rent nearby; rentals lingering (median 44d on market — plan ~5-8 weeks vacancy on turnover, expect pricing pressure); 67% of comp listings sitting > 30 days — soft ceiling on asking rent; high-income renter base; 1,366 units permitted in Suffolk County in 2024 (216 in 5+ unit buildings).
- At $15,233/mo this rent would consume 117% of the median local household income ($156k/yr) (locally 274% of renters already pay >50% of income on rent) — very limited rent-growth headroom before tenants either downsize or default.
Forward outlook
- Local home prices are declining (-3.0%/yr); year-one equity from $14k of loan paydown is wiped out by about $60k of value loss. Plan a longer hold.
- Suffolk County population projected to shrink 5% by 2050 — rents likely to lag national; underwrite the cash flow, not the appreciation.
Negotiation context
- It's been on market 40 days — a 3% lower offer ($1.94M) is reasonable based on typical stale-listing flexibility.
- 3 sale attempts since 5y ago with the ask held roughly flat each time — persistent listings suggest the price (not the market) is what's stuck; bring a comps-based counter.
- Current owner paid $1.23M; list at $2.00M implies a 63% gain — meaningful room to come down on a strong offer.
Risks & watch-outs
- Climate carrying-cost: severe wind risk, 80% chance of damaging wind over 30y — expect insurance premiums to compound above CPI over the hold.
Questions for the listing agent
- What do current leases actually rent for vs. the listed asking? Can we see a recent rent roll and the last 12 months of T-12 income?
- It's been on market 40 days. Have you received any prior offers? Is the seller open to a 24% concession, seller financing, or rate buy-down credit?
- Is there a deadline driving the sale (1031 exchange, divorce, estate, relocation)? That informs how much negotiation room exists.
- Schools are D-rated, which usually means shorter tenancies and higher turnover. Who's the typical renter profile here, and what's been the actual vacancy rate?
- The area grade is low — what's the realistic commute time and amenity access for the typical tenant pool here? Any planned neighborhood developments (good or bad) we should know about?
- What's the average days-on-market for RENTAL listings here right now (not sales)? A rising rental-DOM trend means longer vacancies and softer asking-rent achievability than the comps imply.
- What's the recent tenant-quality profile in this submarket — average credit score on applications, eviction rate, late-payment / NSF rate, and stable-employment percentage? A property-management company in the area should have these aggregated.
- How much new for-sale + rental construction is in the pipeline within 1–3 miles? Heavy new supply typically softens prices + rents 12–24 months out; constrained supply supports both.
Investment metrics
- 1% rule
- 0.76% ✗
- Cap rate
- 5.24%
- Cash-on-cash
- -3.77%
- DSCR
- 0.83
- GRM
- 10.9
CMA / ARV
- ARV (median comp)
- $2,139,227
- List price
- $1,995,000
- Delta
- -6.74%
- Verdict
- FAIR
- Comps
- 15 within 1.0 mi
Show comp detail 2 sales within ~0.75 mi
| Address | Dist | Beds/Ba | Sqft | Sold | Price | $/sf | Match |
|---|---|---|---|---|---|---|---|
| 485 N Sea Mecox Rd | 0.60mi | 2/2.0 | 1,774 (+5%) | 4mo | $1,445,000 | $815 | 61 |
| 179 Elm St | 0.64mi | 3/1.5 (+1) | 1,604 (-5%) | 1mo | $2,100,000 | $1,309 | 54 |
Match score weights: distance 35% · size 25% · config 20% · recency 20%. Top-matched comps best support the ARV.
Projected returns pro-forma
-3.0% appreciation · 8.0% rent growth · sell at horizon
- IRR
- -17.2%
- Equity multiple
- 0.37×
- Total profit
- $-354,186
- Equity at exit
- $297,461
- IRR
- -1.8%
- Equity multiple
- 0.85×
- Total profit
- $-84,841
- Equity at exit
- $172,491
Cash invested: $558,600 (down + closing). Projections, not guarantees.
Landlord ↔ Tenant lean methodology
- Overall (STATE)
- 15 Strongly Tenant-Friendly
- State New York
- 15 Strongly Tenant-Friendly · D+10
- County
- — inherits STATE
- City
- — inherits STATE
ZIP-level market 11968
- Home prices YoY
- -28.6%
- Rents YoY
- 14.6%
- Active inventory
- 95
- Price-to-rent
- 10.9×
Monthly cashflow live
- Estimated rent
- $15,233 medium interval (Pro) →
- Mortgage (P&I)
- −$10,462
- Tax est. 1.5%
- −$2,494 /mo · $29,925/yr
- Insurance
- −$831
- HOA
- −$0
- Vacancy / Maint / Mgmt
- −$3,199
- Net cashflow
- $-1,753
Break-even live
UW: 25.0% down · 7.5% · 30yr · 1.5% tax · 5.0% vac · 8.0% maint · 8.0% mgmt
Financing live
Cash to close
- Down payment
- $498,750
- Closing costs
- $59,850
- Reserves months
- —
- Total cash needed
- —
Loan-product check · same deal, 3 products live
Conventional
25% down · 7.5% · 30yr
- Down + closing
- —
- Monthly P&I
- —
- Monthly cashflow
- —
- DSCR
- —
- Eligible?
- —
Personal DTI + credit; lowest rate.
DSCR
20% down · 8.5% · 30yr
- Down + closing
- —
- Monthly P&I
- —
- Monthly cashflow
- —
- DSCR
- —
- Eligible?
- —
No personal income docs; deal must DSCR.
Hard money
10% down · 12.0% · 12mo
- Down + closing
- —
- Monthly P&I
- —
- Monthly cashflow
- —
- DSCR
- —
- Eligible?
- —
Short-term bridge; refi at stabilization.
Rent comps 9 comps
| Address | Beds | Baths | Sqft | Rent | $/sqft | DOM | Units | Dist |
|---|---|---|---|---|---|---|---|---|
| 40 Roman Rd Southampton, NY | 3.0 | 3.0 | 1912 | $6,500 | $3.40 | 43d | 1 | 0.57mi |
| 3 Meadowgrass Ln Southampton, NY | 3.0 | 2.0 | 1434 | $84,000 | $58.58 | 43d | 1 | 0.86mi |
| 10 Leland Ln #19 Southampton, NY | 3.0 | 3.0 | 1400 | $30,000 | $21.43 | 43d | 1 | 0.92mi |
| 10 Leland Ln #35 Southampton, NY | 2.0 | 2.0 | 1092 | $29,000 | $26.56 | 19d | 1 | 0.92mi |
| 520 Hampton Rd #18 Southampton, NY | 3.0 | 3.5 | 2250 | $99,000 | $44.00 | 43d | 1 | 0.99mi |
| 570 Hampton Rd #28 Southampton, NY | 2.0 | 2.0 | 1400 | $55,000 | $39.29 | 22d | 1 | 1.08mi |
| 393 Hill St Southampton, NY | 3.0 | 2.0 | 1345 | $35,000 | $26.02 | 43d | 1 | 1.32mi |
| 36 Corrigan St Southampton, NY | 3.0 | 3.5 | 2089 | $20,000 | $9.57 | 13d | 1 | 1.47mi |
| 15 Lake View Ct Southampton, NY | 3.0 | 2.5 | 1800 | $15,000 | $8.33 | 43d | 1 | 1.47mi |
Listing history 23 events
-
2026-06-18days on market $1,995,000 Active 40 DOM
-
2026-06-17days on market $1,995,000 Active 39 DOM
-
2026-06-16days on market $1,995,000 Active 38 DOM
-
2026-06-15days on market $1,995,000 Active 37 DOM
-
2026-06-13days on market $1,995,000 Active 35 DOM
-
2026-06-13days on market $1,995,000 Active 34 DOM
-
2026-06-09days on market $1,995,000 Active 31 DOM
-
2026-06-08days on market $1,995,000 Active 30 DOM
-
2026-06-07days on market $1,995,000 Active 29 DOM
-
2026-06-04days on market $1,995,000 Active 26 DOM
-
2026-06-03days on market $1,995,000 Active 25 DOM
-
2026-06-02days on market $1,995,000 Active 24 DOM
-
2026-06-01days on market $1,995,000 Active 23 DOM
-
2026-05-31days on market $1,995,000 Active 22 DOM
-
2026-05-09$1,995,000 Active 1083-char remark
-
2026-01-19historical
-
2025-12-09price $2,450,000
-
2025-07-23$2,595,000 Active
-
2022-08-02soldstatus $1,225,000
-
2022-03-18soldstatus $1,225,000 Closed
Show marketing remark (432 chars)
Conveniently located in Southampton, just 2 blocks to the heart of the Village, this 3 bedroom 2 bath home is perfect for your Hampton's getaway. Meticulously kept with light and bright open floor plan enjoy all the Hamptons have to offer. Relax around the heated pool overlooking your expansive yard, or venture to the coveted ocean beaches just minutes away., Additional information: Appearance:excellent,Interior Features:Lr/Dr
-
2021-11-09status Pending
Show marketing remark (432 chars)
Conveniently located in Southampton, just 2 blocks to the heart of the Village, this 3 bedroom 2 bath home is perfect for your Hampton's getaway. Meticulously kept with light and bright open floor plan enjoy all the Hamptons have to offer. Relax around the heated pool overlooking your expansive yard, or venture to the coveted ocean beaches just minutes away., Additional information: Appearance:excellent,Interior Features:Lr/Dr
-
2021-09-24$1,150,000 Active
Show marketing remark (432 chars)
Conveniently located in Southampton, just 2 blocks to the heart of the Village, this 3 bedroom 2 bath home is perfect for your Hampton's getaway. Meticulously kept with light and bright open floor plan enjoy all the Hamptons have to offer. Relax around the heated pool overlooking your expansive yard, or venture to the coveted ocean beaches just minutes away., Additional information: Appearance:excellent,Interior Features:Lr/Dr
-
1991-08-13soldstatus $267,500
ⓘ Source: listings_history table (triggers on properties + properties_extension) + one-shot
backfill from property_details.listing_events for pre-trigger history.
Climate risk First Street
- Flood 1/10 Low FEMA zone X (unshaded) · 0% chance over 30 yrs
- Wildfire 2/10 Low
- Heat 4/10 Moderate 7 d/yr ≥90°F today · 20 d/yr by 30 yrs out
- Wind 8/10 Severe 80% chance of damaging wind over 30 yrs
- Air quality 3/10 Moderate 3 unhealthy d/yr today · 4 by 30 yrs out
Nearby sold comps map
Loading sold comps map…
Walkable amenities ~0.75 mi
Loading nearby amenities…
Taxation est. · year 1
- Rental income
- $182,796
- − Mortgage interest
- −$111,751
- − Property taxes
- −$29,925
- − Insurance
- −$9,975
- − Repairs & maintenance
- −$14,624
- − Management
- −$14,624
- − Depreciation
- −$58,036
- Taxable loss
- −$56,138
- Est. tax savings @ 24.0%
- +$13,473
- After-tax cash flow
- $-7,562/yr
For passive investors: Depreciation is non-cash, so a rental often shows a tax loss while cash-flowing — sheltering income. Rental losses are passive: they offset passive income freely, and up to $25,000/yr can offset ordinary (W-2) income if you actively participate and your MAGI is under $100k (phasing out to $0 by $150k); unused losses carry forward. On sale, claimed depreciation is recaptured at up to 25%, and gains may owe capital-gains tax (a 1031 exchange can defer both). Figures are a year-1 estimate at your 24.0% rate — not tax advice; consult a CPA.
Schools (NCES district)
- District
- Southampton Union Free School District
- NCES district ID
- 3627540
- Math proficiency
- 53% ▬ 0.00%
- Reading proficiency
- 51% ▲ 4.00%
- Median HH income
- $85,977
- Composite
- 47.9/100
- National rank
- #2213
- State rank
- #293 of 590 in NY
Livability — North Sea
- Score
- 58/100
- State rank
- #1063
- US rank
- #21178
Category grades
Schools grade is shown separately in the Schools card above.
Census & demographics
- Census place
- North Sea, NY
- County
- Suffolk County · 679,920 people
- Metro
- New York-Newark-Jersey City, NY-NJ-PA
- Population (ZIP)
- 15,312
- Household income
- $156,219
- Rent vs Own
- Severe rent burden
- 274.0
Population outlook (Suffolk County) Hauer SSP2
- Today (2025)
- 1,505,262 people
- By 2030
- 1,498,318 · -0.5%
- By 2040
- 1,471,101 · -2.3%
- By 2050
- 1,424,848 · -5.3%
- By 2075
- 1,337,157 · -11.2%
- By 2100
- 1,217,720 · -19.1%
Race, ethnicity, and origin ACS 2023
- Neighborhood character
- Predominantly White (71%)
- Race & ethnicity
- White 71% Hispanic / Latino 13% Two or more races 10% Black 9% Asian 3% Native American 2%
- Hispanic origin (detail)
- Mexican 3% Puerto Rican 2%
- Common ancestry
- Romanian 5% Scotch-Irish 2% Danish 2%
- Foreign-born
- 15% · Canada, Jamaica, Vietnam
- Languages at home
- 81% English-only · Spanish 11% Other Indo-European 3% German/W. Germanic 2%
Political lean MEDSL · Suffolk
- 2024 margin
- Lean R (+10.0) · D 45.0% · R 55.0%
- 2008→2024 swing
- -16.0pp toward R · 2008: 6.0pp · 2024: -10.0pp
- All cycles
- 2024: R+10.0 2020: R+0.0 2016: R+8.2 2012: D+2.9 2008: D+6.0
Not yet ingested
- Civics
- —
Market trends
- HPI YoY
- ▼ -184.86%
- Current HPI
- 461.1144
- Rent YoY
- ▲ 14.62%
- Metro
- New York-Newark-Jersey City, NY-NJ-PA
- State GDP YoY
- ▲ 2.60%
- F500 in state
- 92
Industry mix (Fortune 500 HQ in NY)
| Industry | F500 HQs | Revenue |
|---|---|---|
| Financial Services | 10 | $950B |
|
||
| Consumer Goods | 9 | $162B |
|
||
| Insurance | 4 | $225B |
|
||
| Telecommunications | 2 | $144B |
|
||
| Pharmaceuticals | 2 | $112B |
|
||
| Media / Entertainment | 2 | $69B |
|
||
Price history
+645.8% since first listed9 events — show timeline
- 2026-05-09 Listed $1,995,000 OneKey® MLS as Distributed by MLS Grid
- 2026-01-19 Listing Removed — OneKey® MLS as Distributed by MLS Grid
- 2025-12-09 Price Changed $2,450,000 OneKey® MLS as Distributed by MLS Grid
- 2025-07-23 Listed $2,595,000 OneKey® MLS as Distributed by MLS Grid
- 2022-08-02 Sold (Public Records) $1,225,000 Public Records
- 2022-03-18 Sold (MLS) $1,225,000 OneKey® MLS as Distributed by MLS Grid
- 2021-11-09 Pending — OneKey® MLS as Distributed by MLS Grid
- 2021-09-24 Listed $1,150,000 OneKey® MLS as Distributed by MLS Grid
- 1991-08-13 Sold (Public Records) $267,500 Public Records
Property tax history
-0.1%/yrLatest (2024): $2,970 · +0.0% YoY. Source: county tax records.
Cash-flow waterfall
monthlySold comps — $/sqft
last 12 mo · ≤1 miLoading sold comps…