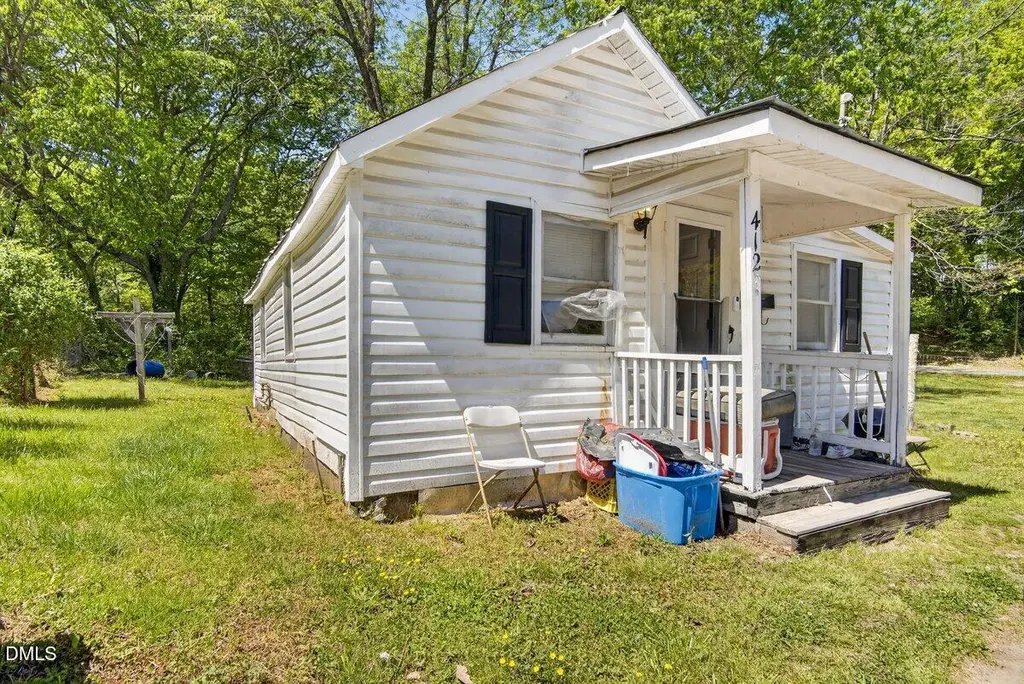
412 Brick St · Henderson, NC
Flood risk 1/10 · Minimal
- FEMA flood zone
- X (unshaded)
- Chance of flooding over 30 yrs
- 0.0%
- Est. flood insurance / yr
- $507 – $1,088
Fire risk 1/10 · Minimal
- Est. fire insurance / yr
- $906 – $1,684
Heat risk 6/10 · Moderate
- Hot days now (above 104°F)
- 7 days/yr
- Hot days in 30 yrs
- 17 days/yr
Wind risk 6/10 · Moderate
- Chance of severe wind over 30 yrs
- 42.0%
Air-quality risk 1/10 · Minimal
- Unhealthy air days now
- 0 days/yr
- Unhealthy air days in 30 yrs
- 0 days/yr
Risk factors via First Street. Map © Google.
Why this score? — see what drove the B- grade
The composite is a weighted blend of 9 inputs, each scored 0–100. Each bar is that input's sub-score; the figure is the points it added to the 100-point composite (weight × sub-score).
- Cash flow +30.0/30.0
- DSCR +10.0/10.0
- 1% rule +9.7/10.0
- ARV discount +7.5/15.0
- Livability +2.9/5.0
- Rent growth +2.5/5.0
- Condition / age +2.5/5.0
- Schools +1.9/10.0
- Appreciation +0.0/10.0
$49,900
🖨 Deal sheet 📄 Offer letter ✓ Due diligence
Listing remarks
* * * INVESTOR opportunity in the heart of Henderson! Located within city limits, this 1-bedroom 1-bath property offers strong potential for rental income or a value-add project. Great opportunity for investors to add value & increase returns with light improvements. Conveniently located just MINUTES from downtown Henderson! * * * The vacant lot located on the adjacent lot is also available for purchase (MLS # 10159925) * * * Do not disturb tenants or walk through the properties without an approved appointment. Proper notice is required.
Key facts
- Value-add project
- 3,920 sq ft lot
- 2 parking spots
Tags
Property features AI
Finance
- Other: Lot approximately 0.09 acres (about 3,920 sq ft)
- HOA & community: No association
Exterior
- Parking: Open parking for 2 cars
- Utilities: Public water; Public sewer
- Home design: Site-built single-story home; One level
- Construction: Vinyl siding construction; Built as site built
- Exterior features: Shingle roof; Other foundation
Interior
- Bedrooms: 1 bedroom (main level)
- Flooring: Carpet; Vinyl
- Bathrooms: 1 full bathroom
- Heating & cooling: Baseboard heating (natural gas); Window unit cooling
- Interior features: Carpet and vinyl flooring
Neighborhood map
What this means for you Summary
Snapshot
- This is a 1-bed/1.0-bath single-family listed at $50k.
Deal economics
- At list price, monthly cash flow is $247 ($3k/yr) — positive.
- The deal already cash-flows at list — no discount required.
- Meets the 1% rule at list price ($731 rent vs $50k).
- Recommended offer: $48k (3.0% below list) — sets the bar for market timing.
- Cap rate 12.2% vs local median 4.1% in Henderson — top-decile yield for the area; either an underpriced asset or a hidden risk that comps aren't pricing in. Stress-test before assuming the spread holds.
Location & tenants
- Location reads 58/100 on livability (#583 in NC) — a working-class tenant base; expect higher turnover. Strengths: cost of living A+, health & safety A+, housing B; Watch: crime F, amenities F, commute F.
- Vance County Schools (rural): math 20% / reading 27% proficiency, ranked #166 of 178 in NC (top 93%) — low school quality limits family demand, transient renter base, plan for 1-2y turnover; 81% free/reduced lunch — lower-income household profile, screen leases tightly.
- Zoned schools: Vance County Middle School (math 13% / reading 17%, grade F, #459 of 475 statewide, top 97%, 797 students, 100% FRL); Vance County High School (math 12% / reading 27%, grade F, #499 of 535 statewide, top 94%, 958 students, 100% FRL) — zoned schools average 100% FRL vs 81% district-wide (19 pts higher); higher-poverty schools than district average — tighter screening recommended.
- Market conditions: 113 active listings in the ZIP; 13 comparable units currently listed for rent nearby; rentals at typical pace (median 15d on market — plan ~3-4 weeks tenant-placement turnaround); lower-income renter base — watch delinquency; 73 units permitted in Vance County in 2024 (0 in 5+ unit buildings).
Forward outlook
- Local home prices are declining (-3.0%/yr); year-one equity from $345 of loan paydown is wiped out by about $1k of value loss. Plan a longer hold.
- Vance County population projected at -23% by 2050 — secular population decline; favor cash flow + early exit over multi-decade hold.
- At projected returns (-3.0% appreciation + 3.0% rent growth), your $14k cash investment doubles in ~6 years — after that, you're playing with house money.
Negotiation context
- It's been on market 35 days — a 3% lower offer ($48k) is reasonable based on typical stale-listing flexibility.
- 2 sale attempts with the ask held roughly flat each time — persistent listings suggest the price (not the market) is what's stuck; bring a comps-based counter.
Risks & watch-outs
- Watch-outs: built in 1955 — expect roof / HVAC / electrical / plumbing capex.
- Climate carrying-cost: major wind risk, 42% chance of damaging wind over 30y; extreme-heat days projected 7→17/yr by 2055 (HVAC capex compounding) — expect insurance premiums to compound above CPI over the hold.
Questions for the listing agent
- It's been on market 35 days. Have you received any prior offers? Is the seller open to a 3% concession, seller financing, or rate buy-down credit?
- Built in 1955 — when were the roof, HVAC, electrical panel, plumbing, and water heater last replaced?
- Is there a deadline driving the sale (1031 exchange, divorce, estate, relocation)? That informs how much negotiation room exists.
- Schools are F-rated, which usually means shorter tenancies and higher turnover. Who's the typical renter profile here, and what's been the actual vacancy rate?
- Crime grade is F in this area — have there been break-ins, vandalism, or insurance claims at this property in the last 3 years? What carrier currently insures it and at what premium?
- What's the average days-on-market for RENTAL listings here right now (not sales)? A rising rental-DOM trend means longer vacancies and softer asking-rent achievability than the comps imply.
- What's the recent tenant-quality profile in this submarket — average credit score on applications, eviction rate, late-payment / NSF rate, and stable-employment percentage? A property-management company in the area should have these aggregated.
- How much new for-sale + rental construction is in the pipeline within 1–3 miles? Heavy new supply typically softens prices + rents 12–24 months out; constrained supply supports both.
Investment metrics
- 1% rule
- 1.47% ✓
- Cap rate
- 12.23%
- Cash-on-cash
- 21.20%
- DSCR
- 1.94
- GRM
- 5.7
CMA / ARV
No comps found within radius.
Projected returns pro-forma
-3.0% appreciation · 3.0% rent growth · sell at horizon
- IRR
- 13.7%
- Equity multiple
- 1.55×
- Total profit
- $7,636
- Equity at exit
- $7,440
- IRR
- 22.5%
- Equity multiple
- 2.93×
- Total profit
- $26,900
- Equity at exit
- $4,314
Cash invested: $13,972 (down + closing). Projections, not guarantees.
Landlord ↔ Tenant lean methodology
- Overall (STATE)
- 85 Strongly Landlord-Friendly
- State North Carolina
- 85 Strongly Landlord-Friendly · R+3
- County
- — inherits STATE
- City
- — inherits STATE
ZIP-level market 27536
- Active inventory
- 113
- Price-to-rent
- 5.7×
Monthly cashflow live
- Estimated rent
- $731 high interval (Pro) →
- Mortgage (P&I)
- −$262
- Tax from tax record
- −$48 /mo · $580/yr
- Insurance
- −$21
- HOA
- −$0
- Vacancy / Maint / Mgmt
- −$154
- Net cashflow
- $247
Break-even live
UW: 25.0% down · 7.5% · 30yr · 1.5% tax · 5.0% vac · 8.0% maint · 8.0% mgmt
Financing live
Cash to close
- Down payment
- $12,475
- Closing costs
- $1,497
- Reserves months
- —
- Total cash needed
- —
Loan-product check · same deal, 3 products live
Conventional
25% down · 7.5% · 30yr
- Down + closing
- —
- Monthly P&I
- —
- Monthly cashflow
- —
- DSCR
- —
- Eligible?
- —
Personal DTI + credit; lowest rate.
DSCR
20% down · 8.5% · 30yr
- Down + closing
- —
- Monthly P&I
- —
- Monthly cashflow
- —
- DSCR
- —
- Eligible?
- —
No personal income docs; deal must DSCR.
Hard money
10% down · 12.0% · 12mo
- Down + closing
- —
- Monthly P&I
- —
- Monthly cashflow
- —
- DSCR
- —
- Eligible?
- —
Short-term bridge; refi at stabilization.
Rent comps 13 comps
| Address | Beds | Baths | Sqft | Rent | $/sqft | DOM | Units | Dist |
|---|---|---|---|---|---|---|---|---|
| 102 Carter St Unit 104 Henderson, NC | 2.0 | 1.0 | 672 | $695 | $1.03 | 14d | 1 | 0.12mi |
| 923 Arch St Unit 925 Henderson, NC | 2.0 | 1.0 | 684 | $705 | $1.03 | 14d | 1 | 0.17mi |
| 125 Wyche St Henderson, NC | 1.0 | 1.0 | 548 | $776 | $1.42 | 1d | 4 | 0.52mi |
| 527 Water St Henderson, NC | 2.0 | 1.0 | 600 | $695 | $1.16 | 23d | 1 | 0.71mi |
| 623 Farrar Ave Henderson, NC | 2.0 | 1.0 | 728 | $695 | $0.95 | 23d | 1 | 0.83mi |
| 543 Horner St Henderson, NC | 2.0 | 1.0 | 700 | $695 | $0.99 | 20d | 1 | 0.93mi |
| 240 Crozier St Unit 242 Henderson, NC | 2.0 | 1.0 | 672 | $695 | $1.03 | 14d | 1 | 1.04mi |
| 904 Burr St Henderson, NC | 2.0 | 1.0 | 720 | $725 | $1.01 | 14d | 1 | 1.07mi |
| 992 Hughes St Henderson, NC | 2.0 | 1.0 | 672 | $705 | $1.05 | 14d | 1 | 1.08mi |
| 976 Burr St Henderson, NC | 2.0 | 1.0 | 750 | $745 | $0.99 | 14d | 1 | 1.14mi |
| 980 Burr St Henderson, NC | 2.0 | 1.0 | 750 | $745 | $0.99 | 14d | 1 | 1.15mi |
| 1108 Johnson St Henderson, NC | 1.0 | 1.0 | 450 | $625 | $1.39 | 4d | 1 | 1.32mi |
| 2008 Julia Ave Henderson, NC | 2.0 | 1.0 | 650 | $795 | $1.22 | 23d | 1 | 1.37mi |
Listing history 15 events
-
2026-06-18days on market $49,900 Active 35 DOM
-
2026-06-17days on market $49,900 Active 34 DOM
-
2026-06-16days on market $49,900 Active 33 DOM
-
2026-06-15days on market $49,900 Active 32 DOM
-
2026-06-13days on market $49,900 Active 30 DOM
-
2026-06-09days on market $49,900 Active 26 DOM
-
2026-06-08days on market $49,900 Active 25 DOM
-
2026-06-07days on market $49,900 Active 24 DOM
-
2026-06-03days on market $49,900 Active 20 DOM
-
2026-06-02days on market $49,900 Active 19 DOM
-
2026-06-01days on market $49,900 Active 18 DOM
-
2026-05-31days on market $49,900 Active 17 DOM
-
2026-05-14$49,900 Active
-
2026-05-12historical
-
2026-04-14$49,900 Active
ⓘ Source: listings_history table (triggers on properties + properties_extension) + one-shot
backfill from property_details.listing_events for pre-trigger history.
Tax reassessment forecast NC · Resets to sale price
- Current annual tax
- $580 · $48/mo
- Projected year-2 tax
- $580 · $48/mo
- Expected delta
- $0/yr ($0/mo · 0.0%)
ⓘ Screening estimate from a state-policy table — verify with the county assessor before closing.
Climate risk First Street
- Flood 1/10 Low FEMA zone X (unshaded) · 0% chance over 30 yrs
- Wildfire 1/10 Low
- Heat 6/10 Major 7 d/yr ≥104°F today · 17 d/yr by 30 yrs out
- Wind 6/10 Major 42% chance of damaging wind over 30 yrs
- Air quality 1/10 Low 0 unhealthy d/yr today · 0 by 30 yrs out
Nearby sold comps map
Loading sold comps map…
Walkable amenities ~0.75 mi
Loading nearby amenities…
Taxation est. · year 1
- Rental income
- $8,774
- − Mortgage interest
- −$2,795
- − Property taxes
- −$580
- − Insurance
- −$250
- − Repairs & maintenance
- −$702
- − Management
- −$702
- − Depreciation
- −$1,452
- Taxable income
- $2,294
- Est. tax owed @ 24.0%
- −$551
- After-tax cash flow
- $2,411/yr
For passive investors: Depreciation is non-cash, so a rental often shows a tax loss while cash-flowing — sheltering income. Rental losses are passive: they offset passive income freely, and up to $25,000/yr can offset ordinary (W-2) income if you actively participate and your MAGI is under $100k (phasing out to $0 by $150k); unused losses carry forward. On sale, claimed depreciation is recaptured at up to 25%, and gains may owe capital-gains tax (a 1031 exchange can defer both). Figures are a year-1 estimate at your 24.0% rate — not tax advice; consult a CPA.
Schools (NCES district)
- District
- Vance County Schools
- NCES district ID
- 3704650
- Math proficiency
- 20% ▼ -7.00%
- Reading proficiency
- 27% ▼ -5.00%
- Median HH income
- $34,323
- Composite
- 19.29/100
- National rank
- #8801
- State rank
- #166 of 178 in NC
Livability — Henderson
- Score
- 58/100
- State rank
- #583
- US rank
- #21468
Category grades
Schools grade is shown separately in the Schools card above.
Census & demographics
- Census place
- Henderson, NC
- County
- Vance County · 15,298 people
- City population
- 15,298
- Metro
- Henderson, NC
- Population (ZIP)
- 15,298
- Household income
- $39,985
- Rent vs Own
- Severe rent burden
- 1110.0
Population outlook (Vance County) Hauer SSP2
- Today (2025)
- 41,985 people
- By 2030
- 40,286 · -4.0%
- By 2040
- 36,372 · -13.4%
- By 2050
- 32,466 · -22.7%
- By 2075
- 24,229 · -42.3%
- By 2100
- 17,784 · -57.6%
Race, ethnicity, and origin ACS 2023
- Neighborhood character
- Diverse neighborhood (Simpson 0.56)
- Race & ethnicity
- Black 60% White 26% Hispanic / Latino 12% Two or more races 5%
- Hispanic origin (detail)
- Mexican 9%
- Common ancestry
- Serbian 1% Italian 1% Iranian 1%
- Foreign-born
- 6% · Canada
- Languages at home
- 91% English-only · Spanish 6% Arabic 1% French/Haitian/Cajun 1%
Political lean MEDSL · Vance
- 2024 margin
- D (+13.3) · D 56.3% · R 42.9%
- 2008→2024 swing
- -13.3pp toward R · 2008: 26.6pp · 2024: 13.3pp
- All cycles
- 2024: D+13.3 2020: D+19.2 2016: D+24.6 2012: D+28.3 2008: D+26.6
Not yet ingested
- Civics
- —
Market trends
- HPI YoY
- ▼ -122.23%
- Current HPI
- 198.8762
- Rent YoY
- —
- Metro
- Henderson, NC
- State GDP YoY
- ▲ 3.28%
- F500 in state
- 26
Industry mix (Fortune 500 HQ in NC)
| Industry | F500 HQs | Revenue |
|---|---|---|
| Financial Services | 2 | $213B |
|
||
| Retail | 2 | $95B |
|
||
| Industrial Conglomerate | 1 | $38B |
|
||
| Metals / Steel | 1 | $35B |
|
||
| Utilities | 1 | $30B |
|
||
| Industrial Machinery | 1 | $19B |
|
||
Price history
+0.0% since first listed3 events — show timeline
- 2026-05-14 Listed $49,900 TMLS
- 2026-05-12 Listing Removed — TMLS
- 2026-04-14 Listed $49,900 TMLS
Property tax history
+11.1%/yrLatest (2025): $580 · -20.8% YoY. Source: county tax records.
Cash-flow waterfall
monthlySold comps — $/sqft
last 12 mo · ≤1 miLoading sold comps…