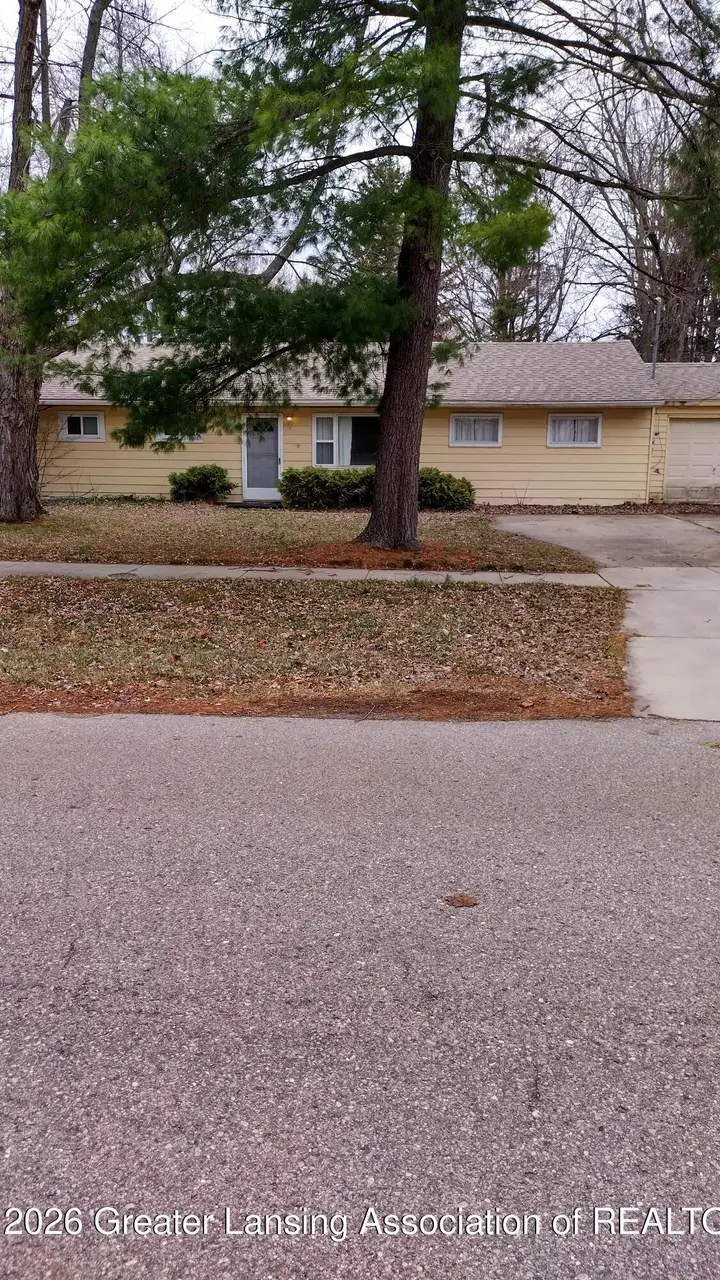
2021 Adelpha Ave · Delhi, MI
Flood risk 1/10 · Minimal
- FEMA flood zone
- X (unshaded)
- Chance of flooding over 30 yrs
- 0.0%
- Est. flood insurance / yr
- $507 – $1,088
Fire risk 1/10 · Minimal
- Est. fire insurance / yr
- $784 – $1,456
Heat risk 2/10 · Minimal
- Hot days now (above 96°F)
- 7 days/yr
- Hot days in 30 yrs
- 16 days/yr
Wind risk 2/10 · Minimal
- Chance of severe wind over 30 yrs
- —
Air-quality risk 2/10 · Minimal
- Unhealthy air days now
- 1 days/yr
- Unhealthy air days in 30 yrs
- 2 days/yr
Risk factors via First Street. Map © Google.
Why this score? — see what drove the C+ grade
The composite is a weighted blend of 9 inputs, each scored 0–100. Each bar is that input's sub-score; the figure is the points it added to the 100-point composite (weight × sub-score).
- Cash flow +22.7/30.0
- ARV discount +15.0/15.0
- DSCR +7.3/10.0
- 1% rule +6.4/10.0
- Rent growth +4.5/5.0
- Schools +3.3/10.0
- Livability +2.5/5.0
- Condition / age +2.5/5.0
- Appreciation +0.0/10.0
$149,900
🖨 Deal sheet (PDF) 📄 Offer letter ✓ Due diligence
Listing remarks MLS
Welcome to 2021 Adelpha Avenue. This adorable ranch style home is located in a cute subdivision, walking distance to stores, restaurants and schools. This home features a large, partially, fenced back yard with a storage shed. The extra large living room is perfect for family gatherings and room for activities. With a little TLC this could be an ideal home for you. New FHA financing available.
Key facts
- 0.3 acre lot
- Garage
- Built 1954
Neighborhood map
What this means for you Summary
Snapshot
- This is a 3-bed/1.0-bath single-family listed at $150k.
Deal economics
- At list price, monthly cash flow is $257 ($3k/yr) — positive.
- The deal already cash-flows at list — no discount required.
- Meets the 1% rule at list price ($2k rent vs $150k).
- Recommended offer: $141k (6.0% below list) — sets the bar for market timing.
Location & tenants
- Location reads: area grade C — affects rentability + tenant quality, not the cash-flow math above.
- Holt Public Schools (suburban): math 28% / reading 46% proficiency, ranked #236 of 540 in MI (top 44%) — families likely to look elsewhere, expect single-tenant / working-renter base with shorter leases.
- Market conditions: Rents rising fast (+8.0%/yr); 75 active listings in the ZIP; 7 comparable units currently listed for rent nearby; rentals at typical pace (median 15d on market — plan ~3-4 weeks tenant-placement turnaround); solid renter incomes; 350 units permitted in Ingham County in 2024 (186 in 5+ unit buildings).
Forward outlook
- Local home prices are declining (-3.0%/yr); year-one equity from $1k of loan paydown is wiped out by about $4k of value loss. Plan a longer hold.
- Ingham County population projected at +11% by 2050 — modest demand growth; plan on rents tracking national, not racing it.
- At projected returns (-3.0% appreciation + 8.0% rent growth), your $42k cash investment doubles in ~8 years — after that, you're playing with house money.
Negotiation context
- It's been on market 86 days — a 6% lower offer ($141k) is reasonable based on typical stale-listing flexibility.
- 2 sale attempts; this cycle's ask has dropped $20k (12%) from the opening price — seller is motivated, your offer sets the floor, not the list.
Risks & watch-outs
- Watch-outs: built in 1954 — expect roof / HVAC / electrical / plumbing capex.
Questions for the listing agent
- It's been on market 86 days. Have you received any prior offers? Is the seller open to a 6% concession, seller financing, or rate buy-down credit?
- Built in 1954 — when were the roof, HVAC, electrical panel, plumbing, and water heater last replaced?
- Why hasn't it sold? Are there any deal-killer items the seller is aware of (foundation, flood, title, zoning, code violations)?
- Is there a deadline driving the sale (1031 exchange, divorce, estate, relocation)? That informs how much negotiation room exists.
- What's the average days-on-market for RENTAL listings here right now (not sales)? A rising rental-DOM trend means longer vacancies and softer asking-rent achievability than the comps imply.
- What's the recent tenant-quality profile in this submarket — average credit score on applications, eviction rate, late-payment / NSF rate, and stable-employment percentage? A property-management company in the area should have these aggregated.
- How much new for-sale + rental construction is in the pipeline within 1–3 miles? Heavy new supply typically softens prices + rents 12–24 months out; constrained supply supports both.
Investment metrics
- 1% rule
- 1.14% ✓
- Cap rate
- 8.35%
- Cash-on-cash
- 7.35%
- DSCR
- 1.33
- GRM
- 7.3
CMA / ARV
- ARV (median comp)
- $180,071
- List price
- $149,900
- Delta
- -16.76%
- Verdict
- UNDERPRICED
- Comps
- 20 within 1.0 mi
Show comp detail 12 sales within ~0.75 mi
| Address | Dist | Beds/Ba | Sqft | Sold | Price | $/sf | Match |
|---|---|---|---|---|---|---|---|
| 1880 Phillips Ave | 0.26mi | 3/1.0 | 1,183 (-4%) | 6mo | $145,000 | $123 | 75 |
| 4604 Kathy Ct | 0.16mi | 3/1.5 | 1,155 (-7%) | 7mo | $170,000 | $147 | 74 |
| 4621 Sycamore St | 0.33mi | 3/1.0 | 1,292 (+4%) | 8mo | $170,000 | $132 | 71 |
| 1942 Walnut St | 0.50mi | 3/1.0 | 1,213 (-2%) | 4mo | $188,250 | $155 | 70 |
| 4568 Grove St | 0.16mi | 2/2.0 (-1) | 1,328 (+7%) | 8mo | $205,000 | $154 | 65 |
| 4461 Holt Rd | 0.26mi | 4/2.0 (+1) | 1,367 (+10%) | 1mo | $210,000 | $154 | 61 |
| 1951 Cromwell St | 0.28mi | 2/1.0 (-1) | 1,080 (-13%) | 3mo | $160,000 | $148 | 58 |
| 1910 Phillips | 0.21mi | 4/1.0 (+1) | 1,392 (+12%) | 8mo | $170,000 | $122 | 58 |
| 4295 Bond Ave | 0.61mi | 3/1.5 | 1,192 (-4%) | 9mo | $189,900 | $159 | 56 |
| 4439 Keller Rd | 0.53mi | 4/1.0 (+1) | 1,344 (+9%) | 1mo | $235,000 | $175 | 55 |
| 2058 Park Ln | 0.68mi | 4/2.0 (+1) | 1,228 (-1%) | 5mo | $202,000 | $164 | 54 |
| 1858 Hall St | 0.67mi | 3/2.0 | 1,120 (-10%) | 6mo | $200,000 | $179 | 44 |
Match score weights: distance 35% · size 25% · config 20% · recency 20%. Top-matched comps best support the ARV.
Projected returns pro-forma
-3.0% appreciation · 8.0% rent growth · sell at horizon
- IRR
- 0.7%
- Equity multiple
- 1.03×
- Total profit
- $1,184
- Equity at exit
- $22,351
- IRR
- 15.0%
- Equity multiple
- 2.51×
- Total profit
- $63,516
- Equity at exit
- $12,961
Cash invested: $41,972 (down + closing). Projections, not guarantees.
Landlord ↔ Tenant lean methodology
- Overall (STATE)
- 62 Landlord-Friendly
- State Michigan
- 62 Landlord-Friendly · EVEN
- County
- — inherits STATE
- City
- — inherits STATE
ZIP-level market 48842
- Rents YoY
- 8.0%
- Active inventory
- 75
- Price-to-rent
- 7.3×
Monthly cashflow live
- Estimated rent
- $1,711 high interval (Pro) →
- Mortgage (P&I)
- −$786
- Tax from tax record
- −$246 /mo · $2,954/yr
- Insurance
- −$62
- HOA
- −$0
- Vacancy / Maint / Mgmt
- −$359
- Net cashflow
- $257
Break-even live
Sensitivity live
| Price | -10% $342 | -5% $299 | +0% $257 | +5% $215 | +10% $172 |
|---|---|---|---|---|---|
| Rent | -10% $122 | -5% $189 | +0% $257 | +5% $325 | +10% $392 |
| Rate | -1.0pp $333 | -0.5pp $295 | base $257 | +0.5pp $218 | +1.0pp $179 |
UW: 25.0% down · 7.5% · 30yr · 1.5% tax · 5.0% vac · 8.0% maint · 8.0% mgmt
Financing live
Cash to close
- Down payment
- $37,475
- Closing costs
- $4,497
- Reserves months
- —
- Total cash needed
- —
Loan-product check · same deal, 3 products live
Conventional
25% down · 7.5% · 30yr
- Down + closing
- —
- Monthly P&I
- —
- Monthly cashflow
- —
- DSCR
- —
- Eligible?
- —
Personal DTI + credit; lowest rate.
DSCR
20% down · 8.5% · 30yr
- Down + closing
- —
- Monthly P&I
- —
- Monthly cashflow
- —
- DSCR
- —
- Eligible?
- —
No personal income docs; deal must DSCR.
Hard money
10% down · 12.0% · 12mo
- Down + closing
- —
- Monthly P&I
- —
- Monthly cashflow
- —
- DSCR
- —
- Eligible?
- —
Short-term bridge; refi at stabilization.
Rent comps 7 comps
| Address | Beds | Baths | Sqft | Rent | $/sqft | DOM | Units | Dist |
|---|---|---|---|---|---|---|---|---|
| 4612 Tolland Ave Unit 4612 Holt, MI | 2.0 | 1.0 | 927 | $1,325 | $1.43 | 15d | 1 | 0.51mi |
| 2030 N Cedar St Holt, MI | 1.0–2.0 | 1.0–2.0 | 930 | $1,679 | $1.81 | 15d | 6 | 0.56mi |
| 2294 Main St Holt, MI | 2.0 | 1.0 | 869 | $999 | $1.15 | 15d | 1 | 0.62mi |
| 4330 Keller Rd Holt, MI | 1.0–2.0 | 1.0 | 462 | $1,150 | $2.49 | 15d | 1 | 0.81mi |
| 4075 Holt Rd Holt, MI | 1.0–3.0 | 1.0–2.0 | 1000 | $1,239 | $1.24 | 15d | 1 | 1.09mi |
| 5031 W Willoughby Rd Unit 5031 Holt, MI | 2.0 | 1.0 | 1200 | $1,550 | $1.29 | 15d | 1 | 1.27mi |
| 900 Long Blvd Lansing, MI | 1.0–3.0 | 1.0–1.5 | 1013 | $1,495 | $1.48 | 15d | 21 | 1.41mi |
Listing history 24 events
-
2026-06-18price $149,900 Active 86 DOM
-
2026-06-18days on market $152,900 Active 86 DOM
-
2026-06-17days on market $152,900 Active 85 DOM
-
2026-06-16days on market $152,900 Active 84 DOM
-
2026-06-15days on market $152,900 Active 83 DOM
-
2026-06-14days on market $152,900 Active 81 DOM
-
2026-06-10days on market $152,900 Active 78 DOM
-
2026-06-09days on market $152,900 Active 77 DOM
-
2026-06-08days on market $152,900 Active 76 DOM
-
2026-06-07days on market $152,900 Active 75 DOM
-
2026-06-05days on market $152,900 Active 72 DOM
-
2026-06-03days on market $152,900 Active 71 DOM
-
2026-06-02days on market $152,900 Active 70 DOM
-
2026-06-01days on market $152,900 Active 69 DOM
-
2026-05-31days on market $152,900 Active 68 DOM
-
2026-05-30days on market $152,900 Active 67 DOM
-
2026-05-07price $159,900 396-char remark
Show marketing remark (398 chars)
Welcome to 2021 Adelpha Avenue. This adorable ranch style home is located in a cute subdivision, walking distance to stores, restaurants and schools. This home features a large, partially, fenced back yard with a storage shed. The extra large living room is perfect for family gatherings and room for activities. With a little TLC this could be an ideal home for you. New FHA financing available.
-
2026-05-07price $159,900 398-char remark
Show marketing remark (398 chars)
Welcome to 2021 Adelpha Avenue. This adorable ranch style home is located in a cute subdivision, walking distance to stores, restaurants and schools. This home features a large, partially, fenced back yard with a storage shed. The extra large living room is perfect for family gatherings and room for activities. With a little TLC this could be an ideal home for you. New FHA financing available.
-
2026-04-23price $160,000 396-char remark
Show marketing remark (398 chars)
Welcome to 2021 Adelpha Avenue. This adorable ranch style home is located in a cute subdivision, walking distance to stores, restaurants and schools. This home features a large, partially, fenced back yard with a storage shed. The extra large living room is perfect for family gatherings and room for activities. With a little TLC this could be an ideal home for you. New FHA financing available.
-
2026-04-23price $160,000 398-char remark
Show marketing remark (398 chars)
Welcome to 2021 Adelpha Avenue. This adorable ranch style home is located in a cute subdivision, walking distance to stores, restaurants and schools. This home features a large, partially, fenced back yard with a storage shed. The extra large living room is perfect for family gatherings and room for activities. With a little TLC this could be an ideal home for you. New FHA financing available.
-
2026-04-03price $165,000 396-char remark
Show marketing remark (398 chars)
Welcome to 2021 Adelpha Avenue. This adorable ranch style home is located in a cute subdivision, walking distance to stores, restaurants and schools. This home features a large, partially, fenced back yard with a storage shed. The extra large living room is perfect for family gatherings and room for activities. With a little TLC this could be an ideal home for you. New FHA financing available.
-
2026-04-03price $165,000 398-char remark
Show marketing remark (398 chars)
Welcome to 2021 Adelpha Avenue. This adorable ranch style home is located in a cute subdivision, walking distance to stores, restaurants and schools. This home features a large, partially, fenced back yard with a storage shed. The extra large living room is perfect for family gatherings and room for activities. With a little TLC this could be an ideal home for you. New FHA financing available.
-
2026-03-25$170,000 Active 396-char remark
Show marketing remark (398 chars)
Welcome to 2021 Adelpha Avenue. This adorable ranch style home is located in a cute subdivision, walking distance to stores, restaurants and schools. This home features a large, partially, fenced back yard with a storage shed. The extra large living room is perfect for family gatherings and room for activities. With a little TLC this could be an ideal home for you. New FHA financing available.
-
2026-03-25$170,000 Active 398-char remark
Show marketing remark (398 chars)
Welcome to 2021 Adelpha Avenue. This adorable ranch style home is located in a cute subdivision, walking distance to stores, restaurants and schools. This home features a large, partially, fenced back yard with a storage shed. The extra large living room is perfect for family gatherings and room for activities. With a little TLC this could be an ideal home for you. New FHA financing available.
ⓘ Source: listings_history table (triggers on properties + properties_extension) + one-shot
backfill from property_details.listing_events for pre-trigger history.
Tax reassessment forecast MI · Partial reset (capped growth)
- Current annual tax
- $2,954 · $246/mo
- Projected year-2 tax
- $2,954 · $246/mo
- Expected delta
- $0/yr ($0/mo · 0.0%)
ⓘ Screening estimate from a state-policy table — verify with the county assessor before closing.
Climate risk First Street
- Flood 1/10 Low FEMA zone X (unshaded) · 0% chance over 30 yrs
- Wildfire 1/10 Low
- Heat 2/10 Low 7 d/yr ≥96°F today · 16 d/yr by 30 yrs out
- Wind 2/10 Low
- Air quality 2/10 Low 1 unhealthy d/yr today · 2 by 30 yrs out
Nearby sold comps map
Loading sold comps map…
Walkable amenities ~0.75 mi
Loading nearby amenities…
Taxation est. · year 1
- Rental income
- $20,532
- − Mortgage interest
- −$8,397
- − Property taxes
- −$2,954
- − Insurance
- −$750
- − Repairs & maintenance
- −$1,643
- − Management
- −$1,643
- − Depreciation
- −$4,361
- Taxable income
- $786
- Est. tax owed @ 24.0%
- −$189
- After-tax cash flow
- $2,895/yr
For passive investors: Depreciation is non-cash, so a rental often shows a tax loss while cash-flowing — sheltering income. Rental losses are passive: they offset passive income freely, and up to $25,000/yr can offset ordinary (W-2) income if you actively participate and your MAGI is under $100k (phasing out to $0 by $150k); unused losses carry forward. On sale, claimed depreciation is recaptured at up to 25%, and gains may owe capital-gains tax (a 1031 exchange can defer both). Figures are a year-1 estimate at your 24.0% rate — not tax advice; consult a CPA.
Schools (NCES district)
- District
- Holt Public Schools
- NCES district ID
- 2618480
- Math proficiency
- 28% ▼ -10.00%
- Reading proficiency
- 46% ▼ -5.00%
- Median HH income
- $57,705
- Composite
- 32.68/100
- National rank
- #5653
- State rank
- #236 of 540 in MI
Livability — Delhi
No livability data for this city. (Only ~50 U.S. cities are tracked.)
Census & demographics
- Census place
- Holt, MI
- County
- Ingham County · 237,052 people
- Metro
- Lansing-East Lansing, MI
- Population (ZIP)
- 21,945
- Household income
- $88,340
- Rent vs Own
- Severe rent burden
- 545.0
Population outlook (Ingham County) Hauer SSP2
- Today (2025)
- 300,362 people
- By 2030
- 307,808 · +2.5%
- By 2040
- 320,492 · +6.7%
- By 2050
- 333,223 · +10.9%
- By 2075
- 373,693 · +24.4%
- By 2100
- 392,021 · +30.5%
Race, ethnicity, and origin ACS 2023
- Neighborhood character
- Predominantly White (76%)
- Race & ethnicity
- White 76% Two or more races 9% Hispanic / Latino 7% Black 6% Asian 5%
- Hispanic origin (detail)
- Mexican 6% Cuban 1%
- Common ancestry
- Romanian 7% Lithuanian 3% Iranian 2%
- Foreign-born
- 6% · Vietnam, Canada, China
- Languages at home
- 94% English-only · Other Indo-European 2% Vietnamese 1% Spanish 1%
Political lean MEDSL · Ingham
- 2024 margin
- Strong D (+29.7) · D 63.9% · R 34.2% · Other 2.0%
- 2008→2024 swing
- -3.6pp toward R · 2008: 33.3pp · 2024: 29.7pp
- All cycles
- 2024: D+29.7 2020: D+32.2 2016: D+27.6 2012: D+27.9 2008: D+33.3
Not yet ingested
- Civics
- —
Market trends
- HPI YoY
- ▼ -184.41%
- Current HPI
- 208.5101
- Rent YoY
- ▲ 8.03%
- Metro
- Lansing-East Lansing, MI
- State GDP YoY
- ▲ 1.37%
- F500 in state
- 28
Industry mix (Fortune 500 HQ in MI)
| Industry | F500 HQs | Revenue |
|---|---|---|
| Automotive Parts | 3 | $48B |
|
||
| Automotive | 2 | $372B |
|
||
| Chemicals | 1 | $45B |
|
||
| Automotive Retail | 1 | $29B |
|
||
| Healthcare / Medical Devices | 1 | $23B |
|
||
| Automotive Technology | 1 | $20B |
|
||
Price history
-5.9% since first listed8 events — show timeline
- 2026-05-07 Price Changed $159,900 REALCOMP
- 2026-05-07 Price Changed $159,900 Greater Lansing AoR
- 2026-04-23 Price Changed $160,000 REALCOMP
- 2026-04-23 Price Changed $160,000 Greater Lansing AoR
- 2026-04-03 Price Changed $165,000 REALCOMP
- 2026-04-03 Price Changed $165,000 Greater Lansing AoR
- 2026-03-25 Listed $170,000 Greater Lansing AoR
- 2026-03-25 Listed $170,000 REALCOMP
Property tax history
+2.5%/yrLatest (2025): $2,954 · +2.9% YoY. Source: county tax records.
Cash-flow waterfall
monthlySold comps — $/sqft
last 12 mo · ≤1 miLoading sold comps…