 14-Plex
6820 7th Ave · Rio Linda, CA
Flood risk 1/10 · Minimal
- FEMA flood zone
- X (unshaded)
- Chance of flooding over 30 yrs
- 0.0%
- Est. flood insurance / yr
- $507 – $1,088
Fire risk 7/10 · Major
- Est. fire insurance / yr
- $659 – $1,223
Heat risk 7/10 · Major
- Hot days now (above 102°F)
- 7 days/yr
- Hot days in 30 yrs
- 15 days/yr
Wind risk 1/10 · Minimal
- Chance of severe wind over 30 yrs
- —
Air-quality risk 10/10 · Severe
- Unhealthy air days now
- 34 days/yr
- Unhealthy air days in 30 yrs
- 38 days/yr
Risk factors via First Street. Map © Google.
Why this score? — see what drove the C grade
The composite is a weighted blend of 9 inputs, each scored 0–100. Each bar is that input's sub-score; the figure is the points it added to the 100-point composite (weight × sub-score).
- Cash flow +25.8/30.0
- DSCR +8.6/10.0
- ARV discount +7.5/15.0
- 1% rule +6.4/10.0
- Schools +3.1/10.0
- Livability +2.8/5.0
- Rent growth +2.5/5.0
- Condition / age +2.5/5.0
- Appreciation +0.0/10.0
$2,000,000
🖨 Deal sheet 📄 Offer letter ✓ Due diligence
Multi-family units
County records classify this as Multi-Family (5+ Unit). Listing-text estimate: 14 units. confirmed
5+ unit building — per-unit beds/baths from public records are typically unavailable; the breakdown below (if shown) is an estimate from the listing text.
Listing remarks
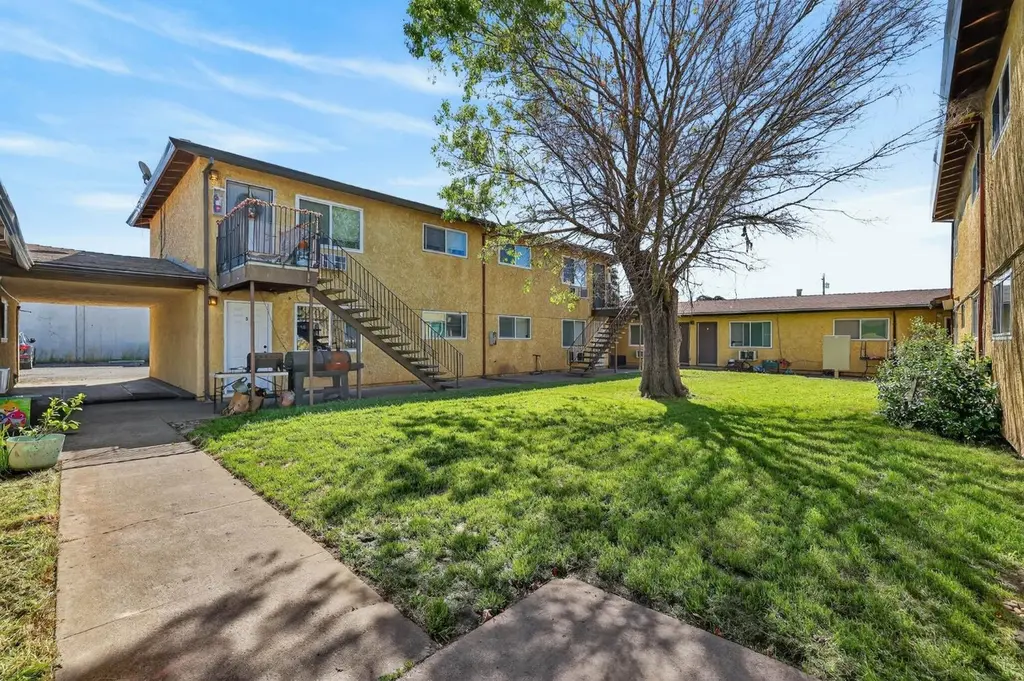
Colliers is pleased to present 6820 7th Ave a 14-Unit Apartment Complex in Rio Linda, CA. A stable submarket just North of Sacramento with limited multifamily inventory available. The subject property is a well-maintained 14-Unit community in one of Sacramento County's most practical and tenant-friendly suburban pockets. 6820 7th Ave (Rio Linda Apartments) is a classic 1959-built, 2-story complex on nearly half an acre. The property is constructed with a stucco exterior, dual pane windows throughout and a pitched roof. Tenants have ample parking spaces at the back of the property and directly across the street. Conveniently situated within a short walk of family parks, community bike and hi
Key facts
- Shared courtyard
- Stucco exterior
- Dual pane windows
Tags
Neighborhood map
What this means for you Summary
Snapshot
- This is a 14 × 2-bed/1-bath units multifamily listed at $2.00M.
Deal economics
- At list price, monthly cash flow is $5k ($58k/yr) — positive. Per door: $346/mo.
- The deal already cash-flows at list — no discount required.
- Meets the 1% rule at list price ($23k rent vs $2.00M).
- Recommended offer: $1.97M (1.5% below list) — sets the bar for market timing.
- Cap rate 9.2% vs local median 3.4% in Rio Linda — top-decile yield for the area; either an underpriced asset or a hidden risk that comps aren't pricing in. Stress-test before assuming the spread holds.
Location & tenants
- Location reads 55/100 on livability (#856 in CA) — a working-class tenant base; expect higher turnover. Strengths: housing A+, employment A-; Watch: schools C-, crime F, amenities F.
- Twin Rivers Unified (suburban): math 29% / reading 37% proficiency, ranked #970 of 1,400 in CA (top 69%) — families likely to look elsewhere, expect single-tenant / working-renter base with shorter leases; 76% free/reduced lunch — lower-income household profile, screen leases tightly.
- Market conditions: 52 active listings in the ZIP; 6,825 units permitted in Sacramento County in 2024 (1,752 in 5+ unit buildings).
Forward outlook
- Local home prices are declining (-3.0%/yr); year-one equity from $14k of loan paydown is wiped out by about $60k of value loss. Plan a longer hold.
- Sacramento County population projected at +17% by 2050 — long-run rental-demand tailwind backs the buy-and-hold thesis.
Negotiation context
- It's been on market 25 days — a 2% lower offer ($1.97M) is reasonable based on typical stale-listing flexibility.
- 4 sale attempts since 3y ago; this cycle's ask is 135493% above the opening price — seller raised mid-cycle; expect resistance to lowballs.
- Current owner paid $1.73M; 16% above their basis — modest negotiation headroom, anchor on the comps not their cost.
Risks & watch-outs
- Watch-outs: built in 1959 — expect roof / HVAC / electrical / plumbing capex.
- Climate carrying-cost: major wildfire risk; extreme-heat days projected 7→15/yr by 2055 (HVAC capex compounding) — expect insurance premiums to compound above CPI over the hold.
Questions for the listing agent
- Can we see the unit-by-unit rent roll, current vacancy, and any below-market leases? What's the average tenancy length?
- What capital expenditures (roof, boiler, parking lot, exteriors) have been made in the last 5 years, and what's planned in the next 2?
- Built in 1959 — when were the roof, HVAC, electrical panel, plumbing, and water heater last replaced?
- Is there a deadline driving the sale (1031 exchange, divorce, estate, relocation)? That informs how much negotiation room exists.
- Crime grade is F in this area — have there been break-ins, vandalism, or insurance claims at this property in the last 3 years? What carrier currently insures it and at what premium?
- What's the average days-on-market for RENTAL listings here right now (not sales)? A rising rental-DOM trend means longer vacancies and softer asking-rent achievability than the comps imply.
- What's the recent tenant-quality profile in this submarket — average credit score on applications, eviction rate, late-payment / NSF rate, and stable-employment percentage? A property-management company in the area should have these aggregated.
- How much new apartment / multifamily construction is in the pipeline within 1–3 miles? Heavy new supply (>2% of stock underway) typically softens rents 12–24 months out; light construction supports rent growth.
Investment metrics
- 1% rule
- 1.14% ✓
- Cap rate
- 9.20%
- Cash-on-cash
- 10.39%
- DSCR
- 1.46
- GRM
- 7.3
CMA / ARV
No comps found within radius.
Projected returns pro-forma
-3.0% appreciation · 3.0% rent growth · sell at horizon
- IRR
- -0.7%
- Equity multiple
- 0.97×
- Total profit
- $-15,417
- Equity at exit
- $298,207
- IRR
- 8.9%
- Equity multiple
- 1.69×
- Total profit
- $383,800
- Equity at exit
- $172,923
Cash invested: $560,000 (down + closing). Projections, not guarantees.
Landlord ↔ Tenant lean methodology
- Overall (STATE)
- 18 Strongly Tenant-Friendly
- State California
- 18 Strongly Tenant-Friendly · D+13
- County
- — inherits STATE
- City
- — inherits STATE
ZIP-level market 95673
- Active inventory
- 52
- Price-to-rent
- 102.6×
Monthly cashflow live
- Estimated rent
- $22,750 medium interval (Pro) →
- Mortgage (P&I)
- −$10,488
- Tax from tax record
- −$1,803 /mo · $21,639/yr
- Insurance
- −$833
- HOA
- −$0
- Vacancy / Maint / Mgmt
- −$4,778
- Net cashflow
- $4,848
Break-even live
14-unit breakdown (identical units grouped — click to expand)
| Units | Beds | Baths | Est. rent |
|---|---|---|---|
| 14× units | 2 | 1 | $22,750 |
| #1 | 2 | 1 | $1,625 |
| #2 | 2 | 1 | $1,625 |
| #3 | 2 | 1 | $1,625 |
| #4 | 2 | 1 | $1,625 |
| #5 | 2 | 1 | $1,625 |
| #6 | 2 | 1 | $1,625 |
| #7 | 2 | 1 | $1,625 |
| #8 | 2 | 1 | $1,625 |
| #9 | 2 | 1 | $1,625 |
| #10 | 2 | 1 | $1,625 |
| #11 | 2 | 1 | $1,625 |
| #12 | 2 | 1 | $1,625 |
| #13 | 2 | 1 | $1,625 |
| #14 | 2 | 1 | $1,625 |
| Total (14 units) | $22,750 | ||
UW: 25.0% down · 7.5% · 30yr · 1.5% tax · 5.0% vac · 8.0% maint · 8.0% mgmt
Financing live
Cash to close
- Down payment
- $500,000
- Closing costs
- $60,000
- Reserves months
- —
- Total cash needed
- —
Loan-product check · same deal, 3 products live
Conventional
25% down · 7.5% · 30yr
- Down + closing
- —
- Monthly P&I
- —
- Monthly cashflow
- —
- DSCR
- —
- Eligible?
- —
Personal DTI + credit; lowest rate.
DSCR
20% down · 8.5% · 30yr
- Down + closing
- —
- Monthly P&I
- —
- Monthly cashflow
- —
- DSCR
- —
- Eligible?
- —
No personal income docs; deal must DSCR.
Hard money
10% down · 12.0% · 12mo
- Down + closing
- —
- Monthly P&I
- —
- Monthly cashflow
- —
- DSCR
- —
- Eligible?
- —
Short-term bridge; refi at stabilization.
Listing history 17 events
-
2026-06-02status $2,000,000 Pending 25 DOM
-
2026-06-01days on market $2,000,000 Active 25 DOM
-
2026-05-31days on market $2,000,000 Active 24 DOM
-
2024-11-06historical $1,475
-
2024-10-18$1,475
-
2024-09-10historical $1,475
-
2024-09-05$1,475
-
2024-06-27historical $1,345
-
2024-06-11$1,345
-
2023-12-01historical $1,500
-
2023-11-28$1,500
-
2022-04-29soldstatus $1,725,000
-
1998-11-25soldstatus $77,000
-
1990-07-27soldstatus $336,000
-
1985-12-20soldstatus $345,000
-
1980-03-18soldstatus $170,000
-
1978-03-21soldstatus $100,000
ⓘ Source: listings_history table (triggers on properties + properties_extension) + one-shot
backfill from property_details.listing_events for pre-trigger history.
Tax reassessment forecast CA · Resets to sale price
- Current annual tax
- $21,639 · $1,803/mo
- Projected year-2 tax
- $21,639 · $1,803/mo
- Expected delta
- $0/yr ($0/mo · 0.0%)
ⓘ Screening estimate from a state-policy table — verify with the county assessor before closing.
Climate risk First Street
- Flood 1/10 Low FEMA zone X (unshaded) · 0% chance over 30 yrs
- Wildfire 7/10 Severe
- Heat 7/10 Severe 7 d/yr ≥102°F today · 15 d/yr by 30 yrs out
- Wind 1/10 Low
- Air quality 10/10 Extreme 34 unhealthy d/yr today · 38 by 30 yrs out
Nearby sold comps map
Loading sold comps map…
Walkable amenities ~0.75 mi
Loading nearby amenities…
Taxation est. · year 1
- Rental income
- $273,000
- − Mortgage interest
- −$112,031
- − Property taxes
- −$21,639
- − Insurance
- −$10,000
- − Repairs & maintenance
- −$21,840
- − Management
- −$21,840
- − Depreciation
- −$58,182
- Taxable income
- $27,468
- Est. tax owed @ 24.0%
- −$6,592
- After-tax cash flow
- $51,580/yr
For passive investors: Depreciation is non-cash, so a rental often shows a tax loss while cash-flowing — sheltering income. Rental losses are passive: they offset passive income freely, and up to $25,000/yr can offset ordinary (W-2) income if you actively participate and your MAGI is under $100k (phasing out to $0 by $150k); unused losses carry forward. On sale, claimed depreciation is recaptured at up to 25%, and gains may owe capital-gains tax (a 1031 exchange can defer both). Figures are a year-1 estimate at your 24.0% rate — not tax advice; consult a CPA.
Schools (NCES district)
- District
- Twin Rivers Unified
- NCES district ID
- 0601332
- Math proficiency
- 29% ▲ 2.00%
- Reading proficiency
- 37% ▲ 2.00%
- Median HH income
- $42,481
- Composite
- 30.67/100
- National rank
- #11437
- State rank
- #970 of 1400 in CA
Livability — Rio Linda
- Score
- 55/100
- State rank
- #856
- US rank
- #23451
Category grades
Schools grade is shown separately in the Schools card above.
Census & demographics
- Census place
- Rio Linda, CA
- City population
- 16,935
- Population (ZIP)
- 16,935
Population outlook (Sacramento County) Hauer SSP2
- Today (2025)
- 1,660,763 people
- By 2030
- 1,732,990 · +4.3%
- By 2040
- 1,855,755 · +11.7%
- By 2050
- 1,941,335 · +16.9%
- By 2075
- 2,046,162 · +23.2%
- By 2100
- 1,961,444 · +18.1%
Race, ethnicity, and origin ACS 2023
- Neighborhood character
- Diverse neighborhood (Simpson 0.56)
- Race & ethnicity
- White 60% Hispanic / Latino 26% Asian 8% Two or more races 8% Black 3%
- Hispanic origin (detail)
- Mexican 22% Puerto Rican 2%
- Common ancestry
- Scotch-Irish 4% Subsaharan African 2% Italian 2%
- Foreign-born
- 17% · Canada, South Korea, Vietnam
- Languages at home
- 71% English-only · Spanish 14% Russian/Polish/Slavic 7% Other Asian/Pacific 5%
Political lean MEDSL · Sacramento
- 2024 margin
- D (+19.7) · D 58.1% · R 38.4% · Other 3.5%
- 2008→2024 swing
- +0.7pp no change · 2008: 19.0pp · 2024: 19.7pp
- All cycles
- 2024: D+19.7 2020: D+25.3 2016: D+23.7 2012: D+16.3 2008: D+19.0
Not yet ingested
- Civics
- —
Market trends
- HPI YoY
- ▼ -339.49%
- Current HPI
- 356.5128
- Rent YoY
- —
- Metro
- —
- State GDP YoY
- ▲ 3.21%
- F500 in state
- 116
Industry mix (Fortune 500 HQ in CA)
| Industry | F500 HQs | Revenue |
|---|---|---|
| Technology | 27 | $1,492B |
|
||
| Financial Services | 3 | $174B |
|
||
| Retail | 3 | $44B |
|
||
| Insurance | 3 | $26B |
|
||
| Media / Entertainment | 2 | $115B |
|
||
| Pharmaceuticals / Biotech | 2 | $62B |
|
||
Price history
-98.5% since first listed14 events — show timeline
- 2024-11-06 Rental Removed $1,475 RENTALBEAST
- 2024-10-18 Listed for Rent $1,475 RENTALBEAST
- 2024-09-10 Rental Removed $1,475 RENTALBEAST
- 2024-09-05 Listed for Rent $1,475 RENTALBEAST
- 2024-06-27 Rental Removed $1,345 BUILDIUM
- 2024-06-11 Listed for Rent $1,345 BUILDIUM
- 2023-12-01 Rental Removed $1,500 RENTALBEAST
- 2023-11-28 Listed for Rent $1,500 RENTALBEAST
- 2022-04-29 Sold (Public Records) $1,725,000 Public Records
- 1998-11-25 Sold (Public Records) $77,000 Public Records
- 1990-07-27 Sold (Public Records) $336,000 Public Records
- 1985-12-20 Sold (Public Records) $345,000 Public Records
- 1980-03-18 Sold (Public Records) $170,000 Public Records
- 1978-03-21 Sold (Public Records) $100,000 Public Records
Property tax history
+9.7%/yrLatest (2025): $21,639 · +5.1% YoY. Source: county tax records.
Cash-flow waterfall
monthlySold comps — $/sqft
last 12 mo · ≤1 miLoading sold comps…