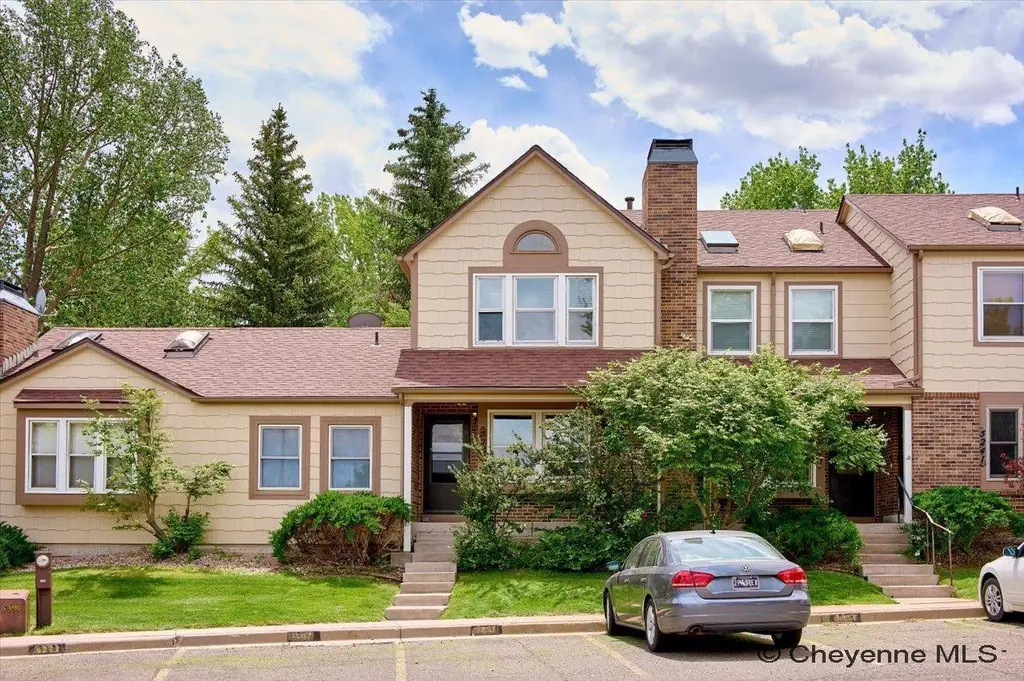
5245 Fishing Brg · Cheyenne, WY
Flood risk 1/10 · Minimal
- FEMA flood zone
- X (unshaded)
- Chance of flooding over 30 yrs
- 0.0%
- Est. flood insurance / yr
- $473 – $860
Fire risk 7/10 · Major
- Est. fire insurance / yr
- $564 – $1,046
Heat risk 2/10 · Minimal
- Hot days now (above 88°F)
- 7 days/yr
- Hot days in 30 yrs
- 16 days/yr
Wind risk 2/10 · Minimal
- Chance of severe wind over 30 yrs
- —
Air-quality risk 3/10 · Minor
- Unhealthy air days now
- 2 days/yr
- Unhealthy air days in 30 yrs
- 2 days/yr
Risk factors via First Street. Map © Google.
Why this score? — see what drove the D grade
The composite is a weighted blend of 9 inputs, each scored 0–100. Each bar is that input's sub-score; the figure is the points it added to the 100-point composite (weight × sub-score).
- Cash flow +12.3/30.0
- ARV discount +7.5/15.0
- Rent growth +4.2/5.0
- Livability +4.2/5.0
- Schools +3.9/10.0
- DSCR +3.7/10.0
- Condition / age +2.5/5.0
- 1% rule +2.4/10.0
- Appreciation +0.0/10.0
$265,000
🖨 Deal sheet 📄 Offer letter ✓ Due diligence
Listing remarks MLS
WONDERFUL WELL MAINTAINED AND REMODELED CONDO. HARDWOOD ON MAIN LEVEL, RELAX IN FRONT OF THE FIRE PLACE, KITCHEN HAS SOME NEWER APPLIANCES AND A BREAKFAST BAR. SEPARATE DINNING ROOM, UPSTAIRS ARE 2 SPACIOUS MASTER SUITES WITH THEIR OWN BATHS. DOWNSTAIRS HAS ANOTHER BEDROOM AND A FAMILY ROOM. ALSO A GUN ROOM
Key facts
- Stainless appliances
- Updated kitchen
- Fenced back patio
Tags
Property features AI
Finance
- Financial info: Annual tax amount reported
Exterior
- Home design: Residential condominium
- Exterior features: Lot within a 2.19-acre parcel
Interior
- Bathrooms: 1 full bathroom; 1 three-quarter bathroom; 1 half bathroom
- Interior features: Pantry; Fireplace (1)
Neighborhood map
What this means for you Summary
Snapshot
- This is a 3-bed/24.0-bath condo listed at $265k.
Deal economics
- At list price, monthly cash flow is $-46 ($-556/yr) — negative.
- To cash-flow at today's rent, offer at most $257k (3.1% below list).
- To meet the 1% rule (rent ≥ 1% of price), the offer needs to be $195k (26.4% below list).
- Recommended offer: $195k (26.4% below list) — sets the bar for 1% rule.
- Cap rate 6.1% vs local median 3.2% in Cheyenne — top-decile yield for the area; either an underpriced asset or a hidden risk that comps aren't pricing in. Stress-test before assuming the spread holds.
Location & tenants
- Location reads 83/100 on livability (#2 in WY, #947 nationally) — a professional / high-income tenant draw. Strengths: commute A+, cost of living A+, housing A+; Watch: crime D.
- Laramie County School District #1 (urban): math 41% / reading 48% proficiency, ranked #33 of 41 in WY (top 80%) — families likely to look elsewhere, expect single-tenant / working-renter base with shorter leases.
- Market conditions: Rents rising fast (+6.7%/yr); 538 active listings in the ZIP; solid renter incomes; 485 units permitted in Laramie County in 2024 (104 in 5+ unit buildings).
Forward outlook
- Local home prices are declining (-3.0%/yr); year-one equity from $2k of loan paydown is wiped out by about $8k of value loss. Plan a longer hold.
- Laramie County population projected at +26% by 2050 — long-run rental-demand tailwind backs the buy-and-hold thesis.
Negotiation context
- Only 14 days on market — expect competitive offers; lowballing is unlikely to land.
- 2 sale attempts since 8y ago with the ask held roughly flat each time — persistent listings suggest the price (not the market) is what's stuck; bring a comps-based counter.
Risks & watch-outs
- Climate carrying-cost: major wildfire risk — expect insurance premiums to compound above CPI over the hold.
Questions for the listing agent
- What do current leases actually rent for vs. the listed asking? Can we see a recent rent roll and the last 12 months of T-12 income?
- Any open or pending special assessments — roof, HVAC, plumbing, elevator, façade? What's the per-unit balance and payoff schedule, and is the seller paying it off at close or rolling it to the buyer?
- Is there a deadline driving the sale (1031 exchange, divorce, estate, relocation)? That informs how much negotiation room exists.
- Schools are B-rated — typically a magnet for longer-tenancy family renters. What's the average tenant stay here, and is there a school-zone premium baked into asking?
- Crime grade is D in this area — have there been break-ins, vandalism, or insurance claims at this property in the last 3 years? What carrier currently insures it and at what premium?
- The area grade is low — what's the realistic commute time and amenity access for the typical tenant pool here? Any planned neighborhood developments (good or bad) we should know about?
- What's the average days-on-market for RENTAL listings here right now (not sales)? A rising rental-DOM trend means longer vacancies and softer asking-rent achievability than the comps imply.
- What's the recent tenant-quality profile in this submarket — average credit score on applications, eviction rate, late-payment / NSF rate, and stable-employment percentage? A property-management company in the area should have these aggregated.
- How much new apartment / multifamily construction is in the pipeline within 1–3 miles? Heavy new supply (>2% of stock underway) typically softens rents 12–24 months out; light construction supports rent growth.
Investment metrics
- 1% rule
- 0.74% ✗
- Cap rate
- 6.08%
- Cash-on-cash
- -0.75%
- DSCR
- 0.97
- GRM
- 11.3
CMA / ARV
No comps found within radius.
Projected returns pro-forma
-3.0% appreciation · 6.73% rent growth · sell at horizon
- IRR
- -14.0%
- Equity multiple
- 0.48×
- Total profit
- $-38,414
- Equity at exit
- $39,512
- IRR
- -0.7%
- Equity multiple
- 0.95×
- Total profit
- $-4,068
- Equity at exit
- $22,912
Cash invested: $74,200 (down + closing). Projections, not guarantees.
Landlord ↔ Tenant lean methodology
- Overall (STATE)
- 90 Strongly Landlord-Friendly
- State Wyoming
- 90 Strongly Landlord-Friendly · R+25
- County
- — inherits STATE
- City
- — inherits STATE
ZIP-level market 82009
- Rents YoY
- 6.7%
- Active inventory
- 538
- Price-to-rent
- 11.3×
Monthly cashflow live
- Estimated rent
- $1,951 medium interval (Pro) →
- Mortgage (P&I)
- −$1,390
- Tax from tax record
- −$88 /mo · $1,054/yr
- Insurance
- −$110
- HOA
- −$0
- Vacancy / Maint / Mgmt
- −$410
- Net cashflow
- $-46
Break-even live
UW: 25.0% down · 7.5% · 30yr · 1.5% tax · 5.0% vac · 8.0% maint · 8.0% mgmt
Financing live
Cash to close
- Down payment
- $66,250
- Closing costs
- $7,950
- Reserves months
- —
- Total cash needed
- —
Loan-product check · same deal, 3 products live
Conventional
25% down · 7.5% · 30yr
- Down + closing
- —
- Monthly P&I
- —
- Monthly cashflow
- —
- DSCR
- —
- Eligible?
- —
Personal DTI + credit; lowest rate.
DSCR
20% down · 8.5% · 30yr
- Down + closing
- —
- Monthly P&I
- —
- Monthly cashflow
- —
- DSCR
- —
- Eligible?
- —
No personal income docs; deal must DSCR.
Hard money
10% down · 12.0% · 12mo
- Down + closing
- —
- Monthly P&I
- —
- Monthly cashflow
- —
- DSCR
- —
- Eligible?
- —
Short-term bridge; refi at stabilization.
HOA detail condo
- Monthly dues
- $0 · $0/yr
- Assessments
- None detected in remarks — confirm with the listing agent.
Listing history 11 events
-
2026-06-19days on market $265,000 Active 14 DOM
-
2026-06-18days on market $265,000 Active 13 DOM
-
2026-06-17days on market $265,000 Active 12 DOM
-
2026-06-16days on market $265,000 Active 11 DOM
-
2026-06-15days on market $265,000 Active 10 DOM
-
2026-06-14days on market $265,000 Active 8 DOM
-
2026-06-13days on market $265,000 Active 7 DOM
-
2026-06-10days on market $265,000 Active 5 DOM
-
2026-06-09days on market $265,000 Active 4 DOM
-
2026-06-08days on market $265,000 Active 3 DOM
-
2026-06-07$265,000 Active 2 DOM
ⓘ Source: listings_history table (triggers on properties + properties_extension) + one-shot
backfill from property_details.listing_events for pre-trigger history.
Tax reassessment forecast WY · Resets to sale price
- Current annual tax
- $1,054 · $88/mo
- Projected year-2 tax
- $1,616 · $135/mo
- Expected delta
- +$563/yr (+$47/mo · 53.4%)
ⓘ Screening estimate from a state-policy table — verify with the county assessor before closing.
Climate risk First Street
- Flood 1/10 Low FEMA zone X (unshaded) · 0% chance over 30 yrs
- Wildfire 7/10 Severe
- Heat 2/10 Low 7 d/yr ≥88°F today · 16 d/yr by 30 yrs out
- Wind 2/10 Low
- Air quality 3/10 Moderate 2 unhealthy d/yr today · 2 by 30 yrs out
Nearby sold comps map
Loading sold comps map…
Walkable amenities ~0.75 mi
Loading nearby amenities…
Taxation est. · year 1
- Rental income
- $23,417
- − Mortgage interest
- −$14,844
- − Property taxes
- −$1,054
- − Insurance
- −$1,325
- − Repairs & maintenance
- −$1,873
- − Management
- −$1,873
- − Depreciation
- −$7,709
- Taxable loss
- −$5,262
- Est. tax savings @ 24.0%
- +$1,263
- After-tax cash flow
- $707/yr
For passive investors: Depreciation is non-cash, so a rental often shows a tax loss while cash-flowing — sheltering income. Rental losses are passive: they offset passive income freely, and up to $25,000/yr can offset ordinary (W-2) income if you actively participate and your MAGI is under $100k (phasing out to $0 by $150k); unused losses carry forward. On sale, claimed depreciation is recaptured at up to 25%, and gains may owe capital-gains tax (a 1031 exchange can defer both). Figures are a year-1 estimate at your 24.0% rate — not tax advice; consult a CPA.
Schools (NCES district)
- District
- Laramie County School District #1
- NCES district ID
- 5601980
- Math proficiency
- 41% ▼ -2.00%
- Reading proficiency
- 48% ▼ -2.00%
- Median HH income
- $56,842
- Composite
- 38.86/100
- National rank
- #4103
- State rank
- #33 of 41 in WY
Livability — Cheyenne
- Score
- 83/100
- State rank
- #2
- US rank
- #947
Category grades
Schools grade is shown separately in the Schools card above.
Census & demographics
- Census place
- Cheyenne, WY
- County
- Laramie County · 94,953 people
- City population
- 94,953
- Metro
- Cheyenne, WY
- Population (ZIP)
- 35,081
- Household income
- $103,835
- Rent vs Own
- Severe rent burden
- 608.0
Population outlook (Laramie County) Hauer SSP2
- Today (2025)
- 109,698 people
- By 2030
- 115,710 · +5.5%
- By 2040
- 127,191 · +15.9%
- By 2050
- 138,476 · +26.2%
- By 2075
- 168,653 · +53.7%
- By 2100
- 188,739 · +72.1%
Race, ethnicity, and origin ACS 2023
- Neighborhood character
- Predominantly White (83%)
- Race & ethnicity
- White 83% Hispanic / Latino 9% Two or more races 6% Asian 1% Black 1%
- Hispanic origin (detail)
- Mexican 6%
- Common ancestry
- Portuguese 3% Slovak 3% Italian 3%
- Foreign-born
- 3% · Canada
- Languages at home
- 96% English-only · Spanish 2% Other Indo-European 1%
Political lean MEDSL · Laramie
- 2024 margin
- Solid R (+32.4) · D 33.0% · R 65.4% · Other 1.6%
- 2008→2024 swing
- -12.1pp toward R · 2008: -20.4pp · 2024: -32.4pp
- All cycles
- 2024: R+32.4 2020: R+28.2 2016: R+33.2 2012: R+24.8 2008: R+20.4
Not yet ingested
- Civics
- —
Market trends
- HPI YoY
- ▼ -339.39%
- Current HPI
- 266.7583
- Rent YoY
- ▲ 6.73%
- Metro
- Cheyenne, WY
- State GDP YoY
- —
- F500 in state
- 0
Price history
+76.7% since first listed6 events — show timeline
- 2026-05-28 Listed $265,000 CBR
- 2018-07-20 Sold (Public Records) — Public Records
- 2018-07-20 Sold (MLS) — CBR
- 2018-05-30 Listed $150,000 CBR
- 2007-04-04 Sold (Public Records) — Public Records
- 2005-04-15 Sold (Public Records) — Public Records
Property tax history
+2.2%/yrLatest (2025): $1,054 · -22.2% YoY. Source: county tax records.
Cash-flow waterfall
monthlySold comps — $/sqft
last 12 mo · ≤1 miLoading sold comps…