 🏗️ New Construction
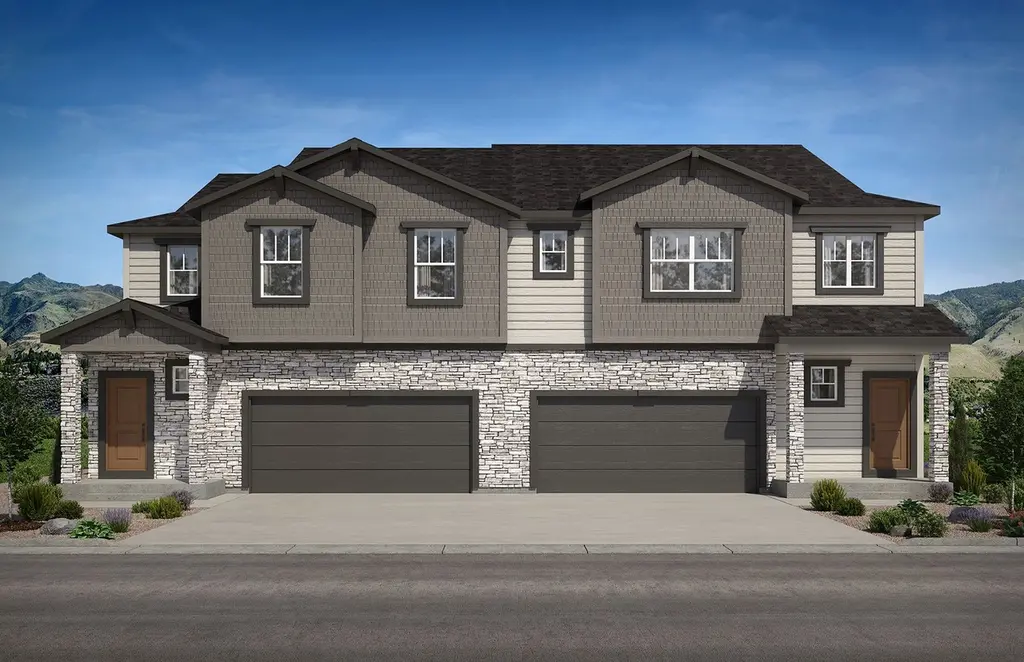
Hillside Mesa Duo 5 Plan · Colorado Springs, CO
Flood risk No data
- FEMA flood zone
- —
- Chance of flooding over 30 yrs
- —
- Est. flood insurance / yr
- —
Fire risk No data
- Est. fire insurance / yr
- —
Heat risk No data
- Hot days now (above threshold)
- —
- Hot days in 30 yrs
- —
Wind risk No data
- Chance of severe wind over 30 yrs
- —
Air-quality risk No data
- Unhealthy air days now
- —
- Unhealthy air days in 30 yrs
- —
Risk factors via First Street. Map © Google.
Why this score? — see what drove the C grade
The composite is a weighted blend of 9 inputs, each scored 0–100. Each bar is that input's sub-score; the figure is the points it added to the 100-point composite (weight × sub-score).
- Cash flow +17.5/30.0
- ARV discount +7.5/15.0
- DSCR +5.5/10.0
- Schools +5.1/10.0
- Condition / age +5.0/5.0
- 1% rule +4.7/10.0
- Appreciation +4.1/10.0
- Livability +3.9/5.0
- Rent growth +2.3/5.0
$484,800
🖨 Deal sheet (PDF) 📄 Offer letter ✓ Due diligence
Multi-family units
County records classify this as Multi-Family (2-4 Unit). Listing-text estimate: 2 units. confirmed
Listing remarks MLS
The Hillside Mesa Duo 5 is a "to be built" duplex, 2-story home and includes 3 beds, loft, 2.5 baths, owner's entry, dining space, covered porch, storage, 2-car garage, patio, and exterior landscaping & fencing. Smart Home Connection Package is Now Included in ALL Classic Homes! Options include owner's entry office or mud bench, 4th bedroom/no loft layout, expanded master shower or master bath soaker tub/shower combo.
Key facts
- 2 parking spots
- Listed 331 days
Neighborhood map
What this means for you Summary
Snapshot
- This is a 2 × 3.0-bed/2.5-bath units multifamily listed at $485k. Condition is rated excellent.
Deal economics
- At list price, monthly cash flow is $375 ($5k/yr) — positive. Per door: $188/mo.
- The deal already cash-flows at list — no discount required.
- To meet the 1% rule (rent ≥ 1% of price), the offer needs to be $472k (2.7% below list).
- Recommended offer: $427k (12.0% below list) — sets the bar for market timing.
- Cap rate 7.2% vs local median 3.3% in Colorado Springs — top-decile yield for the area; either an underpriced asset or a hidden risk that comps aren't pricing in. Stress-test before assuming the spread holds.
Location & tenants
- Location reads 78/100 on livability (#23 in CO, #2,639 nationally) — a middle-class / working-renter tenant base. Strengths: amenities A+, housing A+, health & safety A+; Watch: cost of living C-, crime F.
- Academy School District No. 20 In The County Of El Paso An (urban): math 45% / reading 65% proficiency, ranked #8 of 86 in CO (top 9%) — acceptable for families but not a draw, mixed tenant base, ~2y average lease; only 10% free/reduced lunch — higher-income household profile.
- Market conditions: Rents soft (-0.8%/yr); 408 active listings in the ZIP; high-income renter base; 3,906 units permitted in El Paso County in 2024 (872 in 5+ unit buildings).
- This rent runs 41% of the median local income ($139k/yr) — at the standard rent-burdened threshold; future hikes will face affordability resistance.
Forward outlook
- Local home prices are declining (-1.8%/yr); year-one equity from $3k of loan paydown is wiped out by about $9k of value loss. Plan a longer hold.
- El Paso County population projected at +28% by 2050 — long-run rental-demand tailwind backs the buy-and-hold thesis.
Negotiation context
- It's been on market 332 days — a 12% lower offer ($427k) is reasonable based on typical stale-listing flexibility.
Questions for the listing agent
- It's been on market 332 days. Have you received any prior offers? Is the seller open to a 12% concession, seller financing, or rate buy-down credit?
- Can we see the unit-by-unit rent roll, current vacancy, and any below-market leases? What's the average tenancy length?
- What capital expenditures (roof, boiler, parking lot, exteriors) have been made in the last 5 years, and what's planned in the next 2?
- Why hasn't it sold? Are there any deal-killer items the seller is aware of (foundation, flood, title, zoning, code violations)?
- Is there a deadline driving the sale (1031 exchange, divorce, estate, relocation)? That informs how much negotiation room exists.
- Schools are B-rated — typically a magnet for longer-tenancy family renters. What's the average tenant stay here, and is there a school-zone premium baked into asking?
- Crime grade is F in this area — have there been break-ins, vandalism, or insurance claims at this property in the last 3 years? What carrier currently insures it and at what premium?
- What's the average days-on-market for RENTAL listings here right now (not sales)? A rising rental-DOM trend means longer vacancies and softer asking-rent achievability than the comps imply.
- What's the recent tenant-quality profile in this submarket — average credit score on applications, eviction rate, late-payment / NSF rate, and stable-employment percentage? A property-management company in the area should have these aggregated.
- How much new apartment / multifamily construction is in the pipeline within 1–3 miles? Heavy new supply (>2% of stock underway) typically softens rents 12–24 months out; light construction supports rent growth.
Investment metrics
- 1% rule
- 0.97% ✗
- Cap rate
- 7.22%
- Cash-on-cash
- 3.32%
- DSCR
- 1.15
- GRM
- 8.6
CMA / ARV
No comps found within radius.
Projected returns pro-forma
-1.81% appreciation · 0.0% rent growth · sell at horizon
- IRR
- -8.1%
- Equity multiple
- 0.68×
- Total profit
- $-43,783
- Equity at exit
- $98,479
- IRR
- -3.9%
- Equity multiple
- 0.72×
- Total profit
- $-38,292
- Equity at exit
- $88,319
Cash invested: $135,744 (down + closing). Projections, not guarantees.
Landlord ↔ Tenant lean methodology
- Overall (STATE)
- 38 Tenant-Leaning
- State Colorado
- 38 Tenant-Leaning · D+4
- County
- — inherits STATE
- City
- — inherits STATE
ZIP-level market 80924
- Home prices YoY
- -1.0%
- Rents YoY
- -0.8%
- Active inventory
- 408
- Price-to-rent
- 17.1×
Monthly cashflow live
- Estimated rent
- $4,716 medium interval (Pro) →
- Mortgage (P&I)
- −$2,542
- Tax est. 1.5%
- −$606 /mo · $7,272/yr
- Insurance
- −$202
- HOA
- −$0
- Vacancy / Maint / Mgmt
- −$990
- Net cashflow
- $375
Break-even live
Sensitivity live
| Price | -10% $710 | -5% $543 | +0% $375 | +5% $208 | +10% $40 |
|---|---|---|---|---|---|
| Rent | -10% $3 | -5% $189 | +0% $375 | +5% $562 | +10% $748 |
| Rate | -1.0pp $619 | -0.5pp $499 | base $375 | +0.5pp $250 | +1.0pp $122 |
2-unit breakdown (identical units grouped — click to expand)
| Units | Beds | Baths | Est. rent |
|---|---|---|---|
| 2× units | 3.0 | 2.5 | $4,716 |
| #1 | 3.0 | 2.5 | $2,358 |
| #2 | 3.0 | 2.5 | $2,358 |
| Total (2 units) | $4,716 | ||
UW: 25.0% down · 7.5% · 30yr · 1.5% tax · 5.0% vac · 8.0% maint · 8.0% mgmt
Financing live
Cash to close
- Down payment
- $121,200
- Closing costs
- $14,544
- Reserves months
- —
- Total cash needed
- —
Loan-product check · same deal, 3 products live
Conventional
25% down · 7.5% · 30yr
- Down + closing
- —
- Monthly P&I
- —
- Monthly cashflow
- —
- DSCR
- —
- Eligible?
- —
Personal DTI + credit; lowest rate.
DSCR
20% down · 8.5% · 30yr
- Down + closing
- —
- Monthly P&I
- —
- Monthly cashflow
- —
- DSCR
- —
- Eligible?
- —
No personal income docs; deal must DSCR.
Hard money
10% down · 12.0% · 12mo
- Down + closing
- —
- Monthly P&I
- —
- Monthly cashflow
- —
- DSCR
- —
- Eligible?
- —
Short-term bridge; refi at stabilization.
Listing history 17 events
-
2026-06-21days on market $484,800 Active 332 DOM
-
2026-06-18days on market $484,800 Active 329 DOM
-
2026-06-17days on market $484,800 Active 328 DOM
-
2026-06-16days on market $484,800 Active 327 DOM
-
2026-06-15days on market $484,800 Active 326 DOM
-
2026-06-14days on market $484,800 Active 324 DOM
-
2026-06-13days on market $484,800 Active 323 DOM
-
2026-06-10days on market $484,800 Active 321 DOM
-
2026-06-09days on market $484,800 Active 320 DOM
-
2026-06-08days on market $484,800 Active 319 DOM
-
2026-06-07days on market $484,800 Active 318 DOM
-
2026-06-05days on market $484,800 Active 315 DOM
-
2026-06-03days on market $484,800 Active 314 DOM
-
2026-06-03days on market $484,800 Active 313 DOM
-
2026-06-01days on market $484,800 Active 312 DOM
-
2026-05-31days on market $484,800 Active 311 DOM
-
2025-07-25$484,800 Active 437-char remark
Show marketing remark (437 chars)
The Hillside Mesa Duo 5 is a "to be built" duplex, 2-story home and includes 3 beds, loft, 2.5 baths, owner's entry, dining space, covered porch, storage, 2-car garage, patio, and exterior landscaping & fencing. Smart Home Connection Package is Now Included in ALL Classic Homes! Options include owner's entry office or mud bench, 4th bedroom/no loft layout, expanded master shower or master bath soaker tub/shower combo.
ⓘ Source: listings_history table (triggers on properties + properties_extension) + one-shot
backfill from property_details.listing_events for pre-trigger history.
Nearby sold comps map
Loading sold comps map…
Walkable amenities ~0.75 mi
Loading nearby amenities…
Taxation est. · year 1
- Rental income
- $56,592
- − Mortgage interest
- −$27,156
- − Property taxes
- −$7,272
- − Insurance
- −$2,424
- − Repairs & maintenance
- −$4,527
- − Management
- −$4,527
- − Depreciation
- −$14,103
- Taxable loss
- −$3,418
- Est. tax savings @ 24.0%
- +$820
- After-tax cash flow
- $5,324/yr
For passive investors: Depreciation is non-cash, so a rental often shows a tax loss while cash-flowing — sheltering income. Rental losses are passive: they offset passive income freely, and up to $25,000/yr can offset ordinary (W-2) income if you actively participate and your MAGI is under $100k (phasing out to $0 by $150k); unused losses carry forward. On sale, claimed depreciation is recaptured at up to 25%, and gains may owe capital-gains tax (a 1031 exchange can defer both). Figures are a year-1 estimate at your 24.0% rate — not tax advice; consult a CPA.
Condition & rehab AI · 5 photos
This is a 'to be built' Hillside Mesa Duo 5 plan, featuring 6 beds and 5 baths, with a 2-car garage and patio. The property is in excellent condition with no visible repairs or maintenance needed.
Schools (NCES district)
- District
- Academy School District No. 20 In The County Of El Paso An
- NCES district ID
- 0801920
- Math proficiency
- 45% ▼ -5.00%
- Reading proficiency
- 65% ▲ 1.00%
- Median HH income
- $89,325
- Composite
- 50.62/100
- National rank
- #1840
- State rank
- #8 of 86 in CO
Livability — Colorado Springs
- Score
- 78/100
- State rank
- #23
- US rank
- #2639
Category grades
Schools grade is shown separately in the Schools card above.
Census & demographics
- Census place
- Colorado Springs, CO
- County
- El Paso County · 689,348 people
- City population
- 555,783
- Metro
- Colorado Springs, CO
- Population (ZIP)
- 19,619
- Household income
- $139,447
- Rent vs Own
- Severe rent burden
- 464.0
Population outlook (El Paso County) Hauer SSP2
- Today (2025)
- 768,926 people
- By 2030
- 815,739 · +6.1%
- By 2040
- 903,489 · +17.5%
- By 2050
- 981,204 · +27.6%
- By 2075
- 1,155,542 · +50.3%
- By 2100
- 1,202,070 · +56.3%
Race, ethnicity, and origin ACS 2023
- Neighborhood character
- Predominantly White (74%)
- Race & ethnicity
- White 74% Two or more races 10% Hispanic / Latino 9% Asian 5% Black 4%
- Hispanic origin (detail)
- Mexican 6%
- Common ancestry
- Italian 5% Slovak 3% Romanian 2%
- Foreign-born
- 8% · Canada, South Korea, China
- Languages at home
- 89% English-only · Other Indo-European 3% Spanish 3% German/W. Germanic 2%
Political lean MEDSL · El Paso
- 2024 margin
- Lean R (+9.8) · D 43.8% · R 53.5% · Other 2.7%
- 2008→2024 swing
- +9.0pp toward D · 2008: -18.8pp · 2024: -9.8pp
- All cycles
- 2024: R+9.8 2020: R+10.8 2016: R+22.6 2012: R+21.4 2008: R+18.8
Not yet ingested
- Civics
- —
Market trends
- HPI YoY
- ▼ -1.81%
- Current HPI
- 180.049
- Rent YoY
- ▼ -0.85%
- Metro
- Colorado Springs, CO
- State GDP YoY
- ▲ 1.95%
- F500 in state
- 14
Industry mix (Fortune 500 HQ in CO)
| Industry | F500 HQs | Revenue |
|---|---|---|
| Technology Distribution | 1 | $31B |
|
||
| Food / Agriculture | 1 | $18B |
|
||
| Packaging | 1 | $14B |
|
||
| Healthcare | 1 | $13B |
|
||
| Energy | 1 | $10B |
|
||
| Technology | 1 | $4B |
|
||
Price history
1 event — show timeline
- 2025-07-25 Listed $484,800 Zillow
Cash-flow waterfall
monthlySold comps — $/sqft
last 12 mo · ≤1 miLoading sold comps…