317 E Lake Ave · Fort Sumner, NM
Flood risk No data
- FEMA flood zone
- —
- Chance of flooding over 30 yrs
- —
- Est. flood insurance / yr
- —
Fire risk No data
- Est. fire insurance / yr
- —
Heat risk No data
- Hot days now (above threshold)
- —
- Hot days in 30 yrs
- —
Wind risk No data
- Chance of severe wind over 30 yrs
- —
Air-quality risk No data
- Unhealthy air days now
- —
- Unhealthy air days in 30 yrs
- —
Risk factors via First Street. Map © Google.
Why this score? — see what drove the B grade
The composite is a weighted blend of 9 inputs, each scored 0–100. Each bar is that input's sub-score; the figure is the points it added to the 100-point composite (weight × sub-score).
- Cash flow +28.9/30.0
- DSCR +10.0/10.0
- ARV discount +7.5/15.0
- 1% rule +6.9/10.0
- Appreciation +6.2/10.0
- Schools +3.3/10.0
- Livability +3.1/5.0
- Rent growth +2.5/5.0
- Condition / age +2.5/5.0
$90,000
🖨 Deal sheet (PDF) 📄 Offer letter ✓ Due diligence
Listing remarks
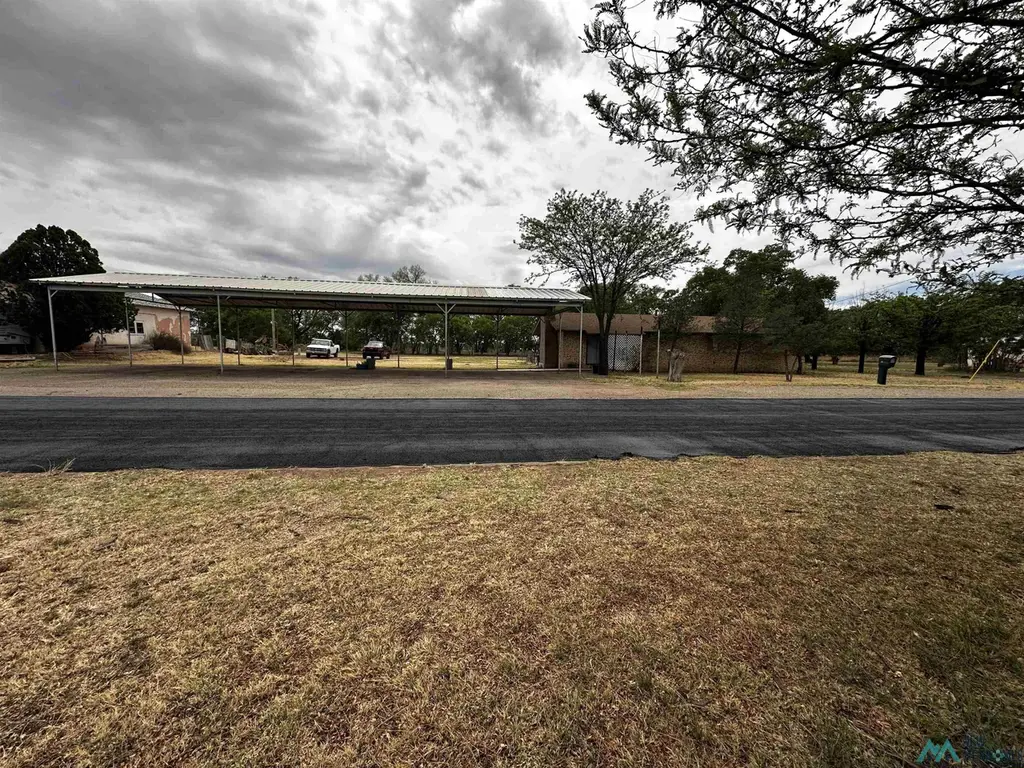
Cozy 3-bedroom, 2-bath home situated on an expansive 7-lot property in Fort Sumner. This residence features a cozy wood-burning insert stove, a dedicated laundry room, and a fully fenced yard—perfect for privacy, pets, or outdoor entertaining. Car enthusiasts or those needing ample covered parking will appreciate the impressive 7-car carport. With plenty of space both inside and out, this property offers comfort, functionality, and room to grow.
Key facts
- Fully fenced yard
- 7-car carport
- 7 garage spots
Tags
Neighborhood map
What this means for you Summary
Snapshot
- This is a 3-bed/2.0-bath single-family listed at $90k.
Deal economics
- At list price, monthly cash flow is $304 ($4k/yr) — positive.
- The deal already cash-flows at list — no discount required.
- Meets the 1% rule at list price ($1k rent vs $90k).
Location & tenants
- Location reads 62/100 on livability (#86 in NM) — a middle-class / working-renter tenant base. Strengths: cost of living A+, housing A+; Watch: health & safety C-, schools F, amenities F.
- Fort Sumner Municipal Schools (rural): math 25% / reading 50% proficiency, ranked #18 of 95 in NM (top 19%) — families likely to look elsewhere, expect single-tenant / working-renter base with shorter leases.
- Market conditions: 30 active listings in the ZIP.
Forward outlook
- In year one you build about $3k of equity ($622 loan paydown + $2k appreciation (2.4% local appreciation)).
- De Baca County population projected at -29% by 2050 — secular population decline; favor cash flow + early exit over multi-decade hold.
- At projected returns (2.4% appreciation + 3.0% rent growth), your $25k cash investment doubles in ~4 years — after that, you're playing with house money.
Negotiation context
- Only 6 days on market — expect competitive offers; lowballing is unlikely to land.
- 2 sale attempts with the ask held roughly flat each time — persistent listings suggest the price (not the market) is what's stuck; bring a comps-based counter.
Risks & watch-outs
- Watch-outs: built in 1945 — expect roof / HVAC / electrical / plumbing capex.
Questions for the listing agent
- Built in 1945 — when were the roof, HVAC, electrical panel, plumbing, and water heater last replaced?
- Is there a deadline driving the sale (1031 exchange, divorce, estate, relocation)? That informs how much negotiation room exists.
- Schools are F-rated, which usually means shorter tenancies and higher turnover. Who's the typical renter profile here, and what's been the actual vacancy rate?
- What's the average days-on-market for RENTAL listings here right now (not sales)? A rising rental-DOM trend means longer vacancies and softer asking-rent achievability than the comps imply.
- What's the recent tenant-quality profile in this submarket — average credit score on applications, eviction rate, late-payment / NSF rate, and stable-employment percentage? A property-management company in the area should have these aggregated.
- How much new for-sale + rental construction is in the pipeline within 1–3 miles? Heavy new supply typically softens prices + rents 12–24 months out; constrained supply supports both.
Investment metrics
- 1% rule
- 1.19% ✓
- Cap rate
- 10.35%
- Cash-on-cash
- 14.48%
- DSCR
- 1.64
- GRM
- 7.0
CMA / ARV
No comps found within radius.
Projected returns pro-forma
2.37% appreciation · 3.0% rent growth · sell at horizon
- IRR
- 19.6%
- Equity multiple
- 2.08×
- Total profit
- $27,211
- Equity at exit
- $37,320
- IRR
- 21.4%
- Equity multiple
- 3.92×
- Total profit
- $73,481
- Equity at exit
- $55,178
Cash invested: $25,200 (down + closing). Projections, not guarantees.
Landlord ↔ Tenant lean methodology
- Overall (STATE)
- 55 Moderately Landlord-Leaning
- State New Mexico
- 55 Moderately Landlord-Leaning · D+3
- County
- — inherits STATE
- City
- — inherits STATE
ZIP-level market 88119
- Home prices YoY
- 3.2%
- Active inventory
- 30
- Price-to-rent
- 7.0×
Monthly cashflow live
- Estimated rent
- $1,071 medium interval (Pro) →
- Mortgage (P&I)
- −$472
- Tax from tax record
- −$32 /mo · $388/yr
- Insurance
- −$38
- HOA
- −$0
- Vacancy / Maint / Mgmt
- −$225
- Net cashflow
- $304
Break-even live
Sensitivity live
| Price | -10% $355 | -5% $329 | +0% $304 | +5% $279 | +10% $253 |
|---|---|---|---|---|---|
| Rent | -10% $219 | -5% $262 | +0% $304 | +5% $346 | +10% $389 |
| Rate | -1.0pp $349 | -0.5pp $327 | base $304 | +0.5pp $281 | +1.0pp $257 |
UW: 25.0% down · 7.5% · 30yr · 1.5% tax · 5.0% vac · 8.0% maint · 8.0% mgmt
Financing live
Cash to close
- Down payment
- $22,500
- Closing costs
- $2,700
- Reserves months
- —
- Total cash needed
- —
Loan-product check · same deal, 3 products live
Conventional
25% down · 7.5% · 30yr
- Down + closing
- —
- Monthly P&I
- —
- Monthly cashflow
- —
- DSCR
- —
- Eligible?
- —
Personal DTI + credit; lowest rate.
DSCR
20% down · 8.5% · 30yr
- Down + closing
- —
- Monthly P&I
- —
- Monthly cashflow
- —
- DSCR
- —
- Eligible?
- —
No personal income docs; deal must DSCR.
Hard money
10% down · 12.0% · 12mo
- Down + closing
- —
- Monthly P&I
- —
- Monthly cashflow
- —
- DSCR
- —
- Eligible?
- —
Short-term bridge; refi at stabilization.
Listing history 4 events
-
2026-04-23status Pending
-
2026-04-20status Active
-
2026-04-17status Pending
-
2026-04-14$90,000 Active
ⓘ Source: listings_history table (triggers on properties + properties_extension) + one-shot
backfill from property_details.listing_events for pre-trigger history.
Tax reassessment forecast NM · Resets to sale price
- Current annual tax
- $388 · $32/mo
- Projected year-2 tax
- $720 · $60/mo
- Expected delta
- +$332/yr (+$28/mo · 85.8%)
ⓘ Screening estimate from a state-policy table — verify with the county assessor before closing.
Nearby sold comps map
Loading sold comps map…
Walkable amenities ~0.75 mi
Loading nearby amenities…
Taxation est. · year 1
- Rental income
- $12,847
- − Mortgage interest
- −$5,041
- − Property taxes
- −$388
- − Insurance
- −$450
- − Repairs & maintenance
- −$1,028
- − Management
- −$1,028
- − Depreciation
- −$2,618
- Taxable income
- $2,294
- Est. tax owed @ 24.0%
- −$551
- After-tax cash flow
- $3,097/yr
For passive investors: Depreciation is non-cash, so a rental often shows a tax loss while cash-flowing — sheltering income. Rental losses are passive: they offset passive income freely, and up to $25,000/yr can offset ordinary (W-2) income if you actively participate and your MAGI is under $100k (phasing out to $0 by $150k); unused losses carry forward. On sale, claimed depreciation is recaptured at up to 25%, and gains may owe capital-gains tax (a 1031 exchange can defer both). Figures are a year-1 estimate at your 24.0% rate — not tax advice; consult a CPA.
Schools (NCES district)
- District
- Fort Sumner Municipal Schools
- NCES district ID
- 3501050
- Math proficiency
- 25% —
- Reading proficiency
- 50% —
- Median HH income
- $33,537
- Composite
- 33.33/100
- National rank
- #10572
- State rank
- #18 of 95 in NM
Livability — Fort Sumner
- Score
- 62/100
- State rank
- #86
- US rank
- #16779
Category grades
Schools grade is shown separately in the Schools card above.
Census & demographics
- Census place
- Fort Sumner, NM
- Population (ZIP)
- 1,467
Population outlook (De Baca County) Hauer SSP2
- Today (2025)
- 1,568 people
- By 2030
- 1,458 · -7.0%
- By 2040
- 1,272 · -18.9%
- By 2050
- 1,120 · -28.6%
- By 2075
- 815 · -48.0%
- By 2100
- 511 · -67.4%
Race, ethnicity, and origin ACS 2023
- Neighborhood character
- Predominantly Hispanic (67%)
- Race & ethnicity
- Hispanic / Latino 67% White 31% Two or more races 15%
- Hispanic origin (detail)
- Mexican 22%
- Common ancestry
- Serbian 1%
- Foreign-born
- 0% · Canada
- Languages at home
- 62% English-only · Spanish 37% French/Haitian/Cajun 1% German/W. Germanic 1%
Political lean MEDSL · De Baca
- 2024 margin
- Solid R (+50.7) · D 23.6% · R 74.3% · Other 2.2%
- 2008→2024 swing
- -20.3pp toward R · 2008: -30.4pp · 2024: -50.7pp
- All cycles
- 2024: R+50.7 2020: R+47.2 2016: R+47.1 2012: R+33.2 2008: R+30.4
Not yet ingested
- Civics
- —
Market trends
- HPI YoY
- ▲ 2.37%
- Current HPI
- 75.3427
- Rent YoY
- —
- Metro
- —
- State GDP YoY
- —
- F500 in state
- 0
Price history
4 events — show timeline
- 2026-04-23 Pending — NMMLS
- 2026-04-20 Relisted — NMMLS
- 2026-04-17 Pending — NMMLS
- 2026-04-14 Listed $90,000 NMMLS
Property tax history
+1.1%/yrLatest (2025): $388 · -25.4% YoY. Source: county tax records.
Cash-flow waterfall
monthlySold comps — $/sqft
last 12 mo · ≤1 miLoading sold comps…