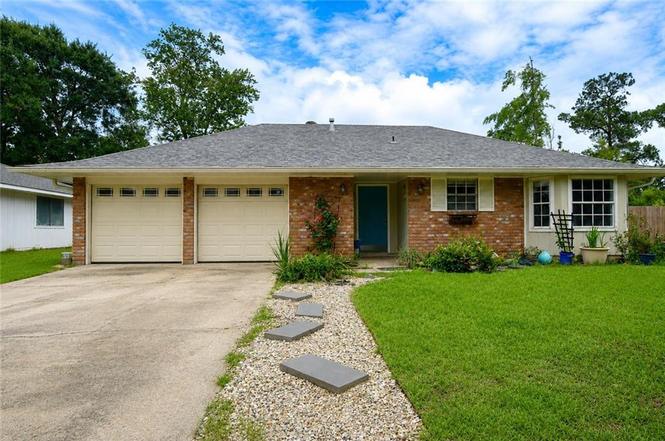
1130 Rue Bordeaux Dr · Slidell, LA
Flood risk No data
- FEMA flood zone
- —
- Chance of flooding over 30 yrs
- —
- Est. flood insurance / yr
- —
Fire risk No data
- Est. fire insurance / yr
- —
Heat risk No data
- Hot days now (above threshold)
- —
- Hot days in 30 yrs
- —
Wind risk No data
- Chance of severe wind over 30 yrs
- —
Air-quality risk No data
- Unhealthy air days now
- —
- Unhealthy air days in 30 yrs
- —
Risk factors via First Street. Map © Google.
Why this score? — see what drove the B+ grade
The composite is a weighted blend of 9 inputs, each scored 0–100. Each bar is that input's sub-score; the figure is the points it added to the 100-point composite (weight × sub-score).
- Cash flow +30.0/30.0
- ARV discount +15.0/15.0
- DSCR +10.0/10.0
- 1% rule +8.5/10.0
- Schools +4.3/10.0
- Livability +3.5/5.0
- Rent growth +2.9/5.0
- Condition / age +2.5/5.0
- Appreciation +0.0/10.0
$150,000
🖨 Deal sheet 📄 Offer letter ✓ Due diligence
Listing remarks MLS
Looking for investment property? This home is for you. Location, Location, Location. Conveniently located in a desire neighborhood in Slidell. 4-bedroom 2 bath with 2 car garage. All measurements, including living area and total square footage, are approximate and not guaranteed. Buyers are encouraged to independently verify all home measurements, property measurements and information to their satisfaction.
Key facts
- Garage
- Pool
- Built 1973
Property features AI
Finance
- HOA & community: Annual association fee of $100
Exterior
- Parking: Garage with two spaces
- Utilities: Public water; Public sewer
- Home design: Single-story; Brick and vinyl siding exterior
- Construction: Shingle roof; Slab foundation
- Exterior features: In-ground pool; City lot; Rectangular lot (approx. 70 x 138)
Interior
- Kitchen: Dishwasher; Oven; Range
- Bathrooms: 2 full bathrooms
- Heating & cooling: Central air conditioning; Heating present
- Interior features: 7 total rooms; Poor condition
Neighborhood map
What this means for you Summary
Snapshot
- This is a 4-bed/2.0-bath single-family listed at $150k.
Deal economics
- At list price, monthly cash flow is $601 ($7k/yr) — positive.
- The deal already cash-flows at list — no discount required.
- Meets the 1% rule at list price ($2k rent vs $150k).
- Cap rate 11.1% vs local median 5.9% in Slidell — top-decile yield for the area; either an underpriced asset or a hidden risk that comps aren't pricing in. Stress-test before assuming the spread holds.
Location & tenants
- Location reads 70/100 on livability (#57 in LA) — a middle-class / working-renter tenant base. Strengths: cost of living A+, housing A+, health & safety A+; Watch: amenities F, commute F.
- St. Tammany Parish (suburban): math 43% / reading 55% proficiency, ranked #11 of 98 in LA (top 11%) — families likely to look elsewhere, expect single-tenant / working-renter base with shorter leases.
- Market conditions: Rents rising (+1.5%/yr); 489 active listings in the ZIP; 23 comparable units currently listed for rent nearby; rentals at typical pace (median 24d on market — plan ~3-4 weeks tenant-placement turnaround); 1,064 units permitted in St. Tammany Parish in 2024 (0 in 5+ unit buildings).
- This rent runs 33% of the median local income ($73k/yr) — at the standard rent-burdened threshold; future hikes will face affordability resistance.
Forward outlook
- Local home prices are declining (-3.0%/yr); year-one equity from $1k of loan paydown is wiped out by about $4k of value loss. Plan a longer hold.
- St. Tammany County population projected at +27% by 2050 — long-run rental-demand tailwind backs the buy-and-hold thesis.
- At projected returns (-3.0% appreciation + 1.5% rent growth), your $42k cash investment doubles in ~8 years — after that, you're playing with house money.
Negotiation context
- Only 2 days on market — expect competitive offers; lowballing is unlikely to land.
- 2 sale attempts with the ask held roughly flat each time — persistent listings suggest the price (not the market) is what's stuck; bring a comps-based counter.
Questions for the listing agent
- Built in 1973 — when were the roof, HVAC, electrical panel, plumbing, and water heater last replaced?
- What does the HOA fee cover, when was the last increase, and are there any pending special assessments or reserve-fund shortfalls?
- Is there a deadline driving the sale (1031 exchange, divorce, estate, relocation)? That informs how much negotiation room exists.
- Schools are B-rated — typically a magnet for longer-tenancy family renters. What's the average tenant stay here, and is there a school-zone premium baked into asking?
- What's the average days-on-market for RENTAL listings here right now (not sales)? A rising rental-DOM trend means longer vacancies and softer asking-rent achievability than the comps imply.
- What's the recent tenant-quality profile in this submarket — average credit score on applications, eviction rate, late-payment / NSF rate, and stable-employment percentage? A property-management company in the area should have these aggregated.
- How much new for-sale + rental construction is in the pipeline within 1–3 miles? Heavy new supply typically softens prices + rents 12–24 months out; constrained supply supports both.
Investment metrics
- 1% rule
- 1.35% ✓
- Cap rate
- 11.10%
- Cash-on-cash
- 17.16%
- DSCR
- 1.76
- GRM
- 6.2
CMA / ARV
- ARV (on-the-fly)
- $255,600
- Comps found
- 12
Show comp detail 12 sales within ~0.75 mi
| Address | Dist | Beds/Ba | Sqft | Sold | Price | $/sf | Match |
|---|---|---|---|---|---|---|---|
| 1425 Constitution Dr | 0.36mi | 3/2.0 (-1) | 1,790 (-1%) | 2mo | $297,000 | $166 | 76 |
| 1408 Fernwood Dr | 0.27mi | 4/2.0 | 1,893 (+5%) | 4mo | $229,000 | $121 | 76 |
| 1414 Englewood Dr | 0.26mi | 4/2.0 | 1,865 (+4%) | 8mo | $260,000 | $139 | 75 |
| 1513 Rue Lemans Dr | 0.30mi | 4/2.0 | 1,888 (+5%) | 5mo | $245,000 | $130 | 74 |
| 1501 Rue Chartres St | 0.25mi | 4/2.0 | 2,037 (+13%) | 4mo | $290,000 | $142 | 63 |
| 1502 Fernwood Dr | 0.39mi | 4/2.0 | 1,958 (+9%) | 6mo | $229,500 | $117 | 62 |
| 1558 Maplewood Dr | 0.50mi | 3/2.0 (-1) | 1,700 (-6%) | 1mo | $267,000 | $157 | 62 |
| 1569 Maplewood Dr | 0.55mi | 4/2.0 | 1,948 (+8%) | 2mo | $304,000 | $156 | 59 |
| 110 Fountain Dr | 0.67mi | 4/2.5 | 1,898 (+5%) | 1mo | $185,000 | $97 | 57 |
| 800 Franklin Ct | 0.34mi | 4/2.0 | 2,035 (+13%) | 7mo | $315,000 | $155 | 57 |
| 1749 Beth Dr | 0.72mi | 4/2.0 | 1,604 (-11%) | 7mo | $75,000 | $47 | 43 |
| 422 Kensington Blvd | 0.58mi | 3/2.0 (-1) | 2,055 (+14%) | 8mo | $315,000 | $153 | 37 |
Match score weights: distance 35% · size 25% · config 20% · recency 20%. Top-matched comps best support the ARV.
Projected returns pro-forma
-3.0% appreciation · 1.47% rent growth · sell at horizon
- IRR
- 6.8%
- Equity multiple
- 1.26×
- Total profit
- $10,887
- Equity at exit
- $22,365
- IRR
- 14.7%
- Equity multiple
- 2.11×
- Total profit
- $46,562
- Equity at exit
- $12,969
Cash invested: $42,000 (down + closing). Projections, not guarantees.
Landlord ↔ Tenant lean methodology
- Overall (STATE)
- 90 Strongly Landlord-Friendly
- State Louisiana
- 90 Strongly Landlord-Friendly · R+12
- County
- — inherits STATE
- City
- — inherits STATE
ZIP-level market 70458
- Rents YoY
- 1.5%
- Active inventory
- 489
- Price-to-rent
- 6.2×
Monthly cashflow live
- Estimated rent
- $2,022 high interval (Pro) →
- Mortgage (P&I)
- −$787
- Tax from tax record
- −$140 /mo · $1,679/yr
- Insurance
- −$62
- HOA
- −$8
- Vacancy / Maint / Mgmt
- −$425
- Net cashflow
- $601
Break-even live
UW: 25.0% down · 7.5% · 30yr · 1.5% tax · 5.0% vac · 8.0% maint · 8.0% mgmt
Financing live
Cash to close
- Down payment
- $37,500
- Closing costs
- $4,500
- Reserves months
- —
- Total cash needed
- —
Loan-product check · same deal, 3 products live
Conventional
25% down · 7.5% · 30yr
- Down + closing
- —
- Monthly P&I
- —
- Monthly cashflow
- —
- DSCR
- —
- Eligible?
- —
Personal DTI + credit; lowest rate.
DSCR
20% down · 8.5% · 30yr
- Down + closing
- —
- Monthly P&I
- —
- Monthly cashflow
- —
- DSCR
- —
- Eligible?
- —
No personal income docs; deal must DSCR.
Hard money
10% down · 12.0% · 12mo
- Down + closing
- —
- Monthly P&I
- —
- Monthly cashflow
- —
- DSCR
- —
- Eligible?
- —
Short-term bridge; refi at stabilization.
Rent comps 23 comps
| Address | Beds | Baths | Sqft | Rent | $/sqft | DOM | Units | Dist |
|---|---|---|---|---|---|---|---|---|
| 1011 Rue Bordeaux Slidell, LA | 4.0 | 2.0 | 2268 | $2,000 | $0.88 | 3d | 1 | 0.16mi |
| 1011 Rue Bordeaux Slidell, LA | 4.0 | 2.0 | 2268 | $2,000 | $0.88 | 3d | 1 | 0.16mi |
| 1466 Florida Ave Slidell, LA | 3.0 | 2.0 | 1456 | $2,200 | $1.51 | 44d | 1 | 0.25mi |
| 1030 Rue Corton Slidell, LA | 4.0 | 2.0 | 1931 | $2,150 | $1.11 | 44d | 1 | 0.31mi |
| 1540 Wildwood Ln Slidell, LA | 3.0 | 2.0 | 1525 | $2,200 | $1.44 | 24d | 1 | 0.43mi |
| 221 Martin Ln Slidell, LA | 3.0 | 1.5 | 1353 | $1,800 | $1.33 | 24d | 1 | 0.45mi |
| 1540 Queens Dr Slidell, LA | 4.0 | 2.0 | 1900 | $2,300 | $1.21 | 17d | 1 | 0.62mi |
| 1733 Mary Dr Slidell, LA | 3.0 | 2.0 | 1349 | $1,650 | $1.22 | 44d | 1 | 0.69mi |
| 129 Fountain Dr Slidell, LA | 4.0 | 2.0 | 1879 | $1,850 | $0.98 | 14d | 1 | 0.80mi |
| 433 Grafton Dr Slidell, LA | 3.0 | 2.0 | 1625 | $1,900 | $1.17 | 44d | 1 | 0.83mi |
| 106 Kempsey Ct Slidell, LA | 3.0 | 2.0 | 1650 | $1,600 | $0.97 | 21d | 1 | 0.92mi |
| 347 Oriole Dr Slidell, LA | 4.0 | 1.5 | 1560 | $1,500 | $0.96 | 44d | 1 | 0.93mi |
| 347 Oriole Dr Slidell, LA | 4.0 | 1.5 | 1560 | $1,500 | $0.96 | 24d | 1 | 0.93mi |
| 513 Michigan Ave Slidell, LA | 3.0 | 2.0 | 1250 | $1,575 | $1.26 | 24d | 1 | 0.93mi |
| 2009 Beth Dr Slidell, LA | 3.0 | 2.0 | 1500 | $1,750 | $1.17 | 3d | 1 | 1.02mi |
| 39344 Rosalind Dr Slidell, LA | 3.0 | 2.0 | 1500 | $2,400 | $1.60 | 44d | 1 | 1.06mi |
| 120 Christian Ln Slidell, LA | 3.0 | 2.0 | 1375 | $1,875 | $1.36 | 3d | 1 | 1.12mi |
| 120 Christian Ln Slidell, LA | 3.0 | 2.0 | 1375 | $1,875 | $1.36 | 3d | 1 | 1.12mi |
| 3517 Meadow Lake Dr W Slidell, LA | 3.0 | 2.0 | 1931 | $2,200 | $1.14 | 44d | 1 | 1.21mi |
| 57479 Cedar Ave Slidell, LA | 4.0 | 2.0 | 1950 | $1,800 | $0.92 | 24d | 1 | 1.26mi |
| 542 Driftwood Cir Slidell, LA | 4.0 | 2.0 | 1960 | $2,100 | $1.07 | 3d | 1 | 1.43mi |
| 221 Lake Tahoe Dr Slidell, LA | 3.0 | 2.0 | 1671 | $1,850 | $1.11 | 44d | 1 | 1.47mi |
| 102 N Dabney Dr Slidell, LA | 3.0 | 2.0 | 2432 | $2,800 | $1.15 | 16d | 1 | 1.50mi |
HOA detail
- Monthly dues
- $8 · $96/yr
Listing history 3 events
-
2026-06-18days on market $150,000 Active 2 DOM
-
2026-06-17remarks 410-char remark
-
2026-06-17$150,000 Active 1 DOM
ⓘ Source: listings_history table (triggers on properties + properties_extension) + one-shot
backfill from property_details.listing_events for pre-trigger history.
Tax reassessment forecast LA · Resets to sale price
- Current annual tax
- $1,679 · $140/mo
- Projected year-2 tax
- $1,679 · $140/mo
- Expected delta
- $0/yr ($0/mo · 0.0%)
ⓘ Screening estimate from a state-policy table — verify with the county assessor before closing.
Nearby sold comps map
Loading sold comps map…
Walkable amenities ~0.75 mi
Loading nearby amenities…
Taxation est. · year 1
- Rental income
- $24,269
- − Mortgage interest
- −$8,402
- − Property taxes
- −$1,679
- − Insurance
- −$750
- − Repairs & maintenance
- −$1,941
- − Management
- −$1,941
- − HOA
- −$96
- − Depreciation
- −$4,364
- Taxable income
- $5,094
- Est. tax owed @ 24.0%
- −$1,223
- After-tax cash flow
- $5,985/yr
For passive investors: Depreciation is non-cash, so a rental often shows a tax loss while cash-flowing — sheltering income. Rental losses are passive: they offset passive income freely, and up to $25,000/yr can offset ordinary (W-2) income if you actively participate and your MAGI is under $100k (phasing out to $0 by $150k); unused losses carry forward. On sale, claimed depreciation is recaptured at up to 25%, and gains may owe capital-gains tax (a 1031 exchange can defer both). Figures are a year-1 estimate at your 24.0% rate — not tax advice; consult a CPA.
Schools (NCES district)
- District
- St. Tammany Parish
- NCES district ID
- 2201650
- Math proficiency
- 43% ▼ -32.00%
- Reading proficiency
- 55% ▼ -26.00%
- Median HH income
- $61,752
- Composite
- 43.04/100
- National rank
- #3098
- State rank
- #11 of 98 in LA
Livability — Slidell
- Score
- 70/100
- State rank
- #57
- US rank
- #7673
Category grades
Schools grade is shown separately in the Schools card above.
Census & demographics
- Census place
- Slidell, LA
- County
- Saint Tammany Parish · 228,296 people
- City population
- 95,511
- Metro
- New Orleans-Metairie, LA
- Population (ZIP)
- 39,034
- Household income
- $72,843
- Rent vs Own
- Severe rent burden
- 1331.0
Population outlook (St. Tammany County) Hauer SSP2
- Today (2025)
- 286,725 people
- By 2030
- 304,175 · +6.1%
- By 2040
- 336,203 · +17.3%
- By 2050
- 364,590 · +27.2%
- By 2075
- 433,362 · +51.1%
- By 2100
- 470,333 · +64.0%
Race, ethnicity, and origin ACS 2023
- Neighborhood character
- Predominantly White (66%)
- Race & ethnicity
- White 66% Black 17% Two or more races 10% Hispanic / Latino 9% Native American 2% Asian 1%
- Hispanic origin (detail)
- Mexican 3% Puerto Rican 1%
- Common ancestry
- Lithuanian 15% Slovak 2% Romanian 1%
- Foreign-born
- 3% · Canada, Vietnam
- Languages at home
- 93% English-only · Spanish 5% Vietnamese 1%
Political lean MEDSL · St. Tammany
- 2024 margin
- Solid R (+43.8) · D 27.3% · R 71.1% · Other 1.6%
- 2008→2024 swing
- +9.6pp toward D · 2008: -53.4pp · 2024: -43.8pp
- All cycles
- 2024: R+43.8 2020: R+44.2 2016: R+50.8 2012: R+52.2 2008: R+53.4
Not yet ingested
- Civics
- —
Market trends
- HPI YoY
- ▼ -173.60%
- Current HPI
- 147.4749
- Rent YoY
- ▲ 1.47%
- Metro
- New Orleans-Metairie, LA
- State GDP YoY
- ▲ 3.29%
- F500 in state
- 10
Industry mix (Fortune 500 HQ in LA)
| Industry | F500 HQs | Revenue |
|---|---|---|
| Telecommunications | 2 | $23B |
|
||
| Utilities | 1 | $12B |
|
||
| Wholesale / Distribution | 1 | $5B |
|
||
| Advertising | 1 | $2B |
|
||
Price history
+0.0% since first listed2 events — show timeline
- 2026-06-16 Listed $150,000 AcadianaMLS
- 2026-06-16 Listed $150,000 GSREIN
Property tax history
-2.7%/yrLatest (2025): $1,679 · -7.4% YoY. Source: county tax records.
Cash-flow waterfall
monthlySold comps — $/sqft
last 12 mo · ≤1 miLoading sold comps…