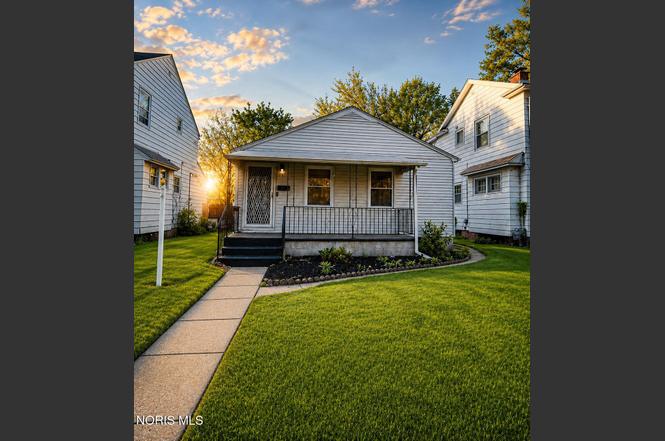
952 Francis Ave · Toledo, OH
Flood risk 1/10 · Minimal
- FEMA flood zone
- X (unshaded)
- Chance of flooding over 30 yrs
- 0.0%
- Est. flood insurance / yr
- $473 – $860
Fire risk 1/10 · Minimal
- Est. fire insurance / yr
- $713 – $1,323
Heat risk 3/10 · Minor
- Hot days now (above 101°F)
- 7 days/yr
- Hot days in 30 yrs
- 16 days/yr
Wind risk 2/10 · Minimal
- Chance of severe wind over 30 yrs
- —
Air-quality risk 2/10 · Minimal
- Unhealthy air days now
- 1 days/yr
- Unhealthy air days in 30 yrs
- 2 days/yr
Risk factors via First Street. Map © Google.
Why this score? — see what drove the C- grade
The composite is a weighted blend of 9 inputs, each scored 0–100. Each bar is that input's sub-score; the figure is the points it added to the 100-point composite (weight × sub-score).
- Cash flow +20.2/30.0
- DSCR +6.4/10.0
- Appreciation +5.4/10.0
- 1% rule +5.2/10.0
- Rent growth +4.5/5.0
- Livability +3.3/5.0
- ARV discount +2.9/15.0
- Condition / age +2.5/5.0
- Schools +1.6/10.0
$82,500
🖨 Deal sheet 📄 Offer letter ✓ Due diligence
Listing remarks
Welcome to 952 Francis Avenue—where charm, simplicity, and smart living come together in a beautifully maintained home that's truly move-in ready. From the moment you arrive, you'll appreciate the inviting front porch—perfect for morning coffee or unwinding at the end of the day. Inside, warm hardwood floors flow through the main living spaces, creating a cozy yet timeless feel filled with natural light. The layout offers a comfortable living area that seamlessly connects to a functional eat-in kitchen with new flooring, complete with ample cabinetry and space for everyday dining. Two well-sized bedrooms provide flexibility for a variety of lifestyles, while the full bath featur
Key facts
- Inviting front porch
- Ample cabinetry
- New flooring
Tags
Property features AI
Finance
- Other: Living area reported as 725 (public records); Below-grade finished area reported as 325
Exterior
- Parking: 2 parking spaces; Street parking
- Utilities: Cable available; Electricity connected; Natural gas connected; Public water; Public sewer
- Home design: Single-family house; One story; No attached units; No common walls; Located on a 0.08-acre lot
- Construction: Vinyl siding; Shingle roof; Block foundation; Built (year from public records)
- Exterior features: Partial fencing; Shed(s)
Interior
- Kitchen: Electric range; Refrigerator; Water heater
- Bedrooms: Bedroom 2 on the main level; Additional bedroom(s) on the main level
- Flooring: Tile; Vinyl; Wood
- Bathrooms: 1 full bathroom
- Heating & cooling: Forced air heating; Central air conditioning
- Interior features: Ceiling fan(s); 4 total rooms; Has basement (block foundation); Covered porch
- Laundry & utility: Laundry in basement
Neighborhood map
What this means for you Summary
Snapshot
- This is a 2-bed/1.0-bath single-family listed at $82k.
Deal economics
- At list price, monthly cash flow is $104 ($1k/yr) — positive.
- The deal already cash-flows at list — no discount required.
- Meets the 1% rule at list price ($838 rent vs $82k).
- Recommended offer: $80k (3.0% below list) — sets the bar for market timing.
Location & tenants
- Location reads 66/100 on livability (#645 in OH) — a middle-class / working-renter tenant base. Strengths: cost of living A+, housing A+, health & safety A+; Watch: amenities C-, crime F, commute F.
- Toledo City (urban): math 15% / reading 24% proficiency, ranked #634 of 656 in OH (top 97%) — low school quality limits family demand, transient renter base, plan for 1-2y turnover; 72% free/reduced lunch — lower-income household profile, screen leases tightly.
- Zoned schools: Arlington Elementary School (math 12% / reading 14%, grade F, #1,429 of 1,584 statewide, top 90%, 327 students, 0% FRL) — zoned schools average 0% FRL vs 72% district-wide (72 pts lower); this property's tenant base skews higher-income than the district average.
- Market conditions: Rents rising fast (+7.8%/yr); 99 active listings in the ZIP; 9 comparable units currently listed for rent nearby; rentals at typical pace (median 23d on market — plan ~3-4 weeks tenant-placement turnaround); lower-income renter base — watch delinquency; 415 units permitted in Lucas County in 2024 (122 in 5+ unit buildings).
Forward outlook
- In year one you build about $1k of equity ($570 loan paydown + $618 appreciation (0.8% local appreciation)).
- Lucas County population projected at -16% by 2050 — secular population decline; favor cash flow + early exit over multi-decade hold.
- At projected returns (0.8% appreciation + 7.8% rent growth), your $23k cash investment doubles in ~6 years — after that, you're playing with house money.
Negotiation context
- It's been on market 42 days — a 3% lower offer ($80k) is reasonable based on typical stale-listing flexibility.
- 2 sale attempts with the ask held roughly flat each time — persistent listings suggest the price (not the market) is what's stuck; bring a comps-based counter.
- Current owner paid $45k; list at $82k implies a 84% gain — meaningful room to come down on a strong offer.
Risks & watch-outs
- Watch-outs: built in 1951 — expect roof / HVAC / electrical / plumbing capex.
Questions for the listing agent
- It's been on market 42 days. Have you received any prior offers? Is the seller open to a 3% concession, seller financing, or rate buy-down credit?
- Built in 1951 — when were the roof, HVAC, electrical panel, plumbing, and water heater last replaced?
- Is there a deadline driving the sale (1031 exchange, divorce, estate, relocation)? That informs how much negotiation room exists.
- Schools are D-rated, which usually means shorter tenancies and higher turnover. Who's the typical renter profile here, and what's been the actual vacancy rate?
- Crime grade is F in this area — have there been break-ins, vandalism, or insurance claims at this property in the last 3 years? What carrier currently insures it and at what premium?
- What's the average days-on-market for RENTAL listings here right now (not sales)? A rising rental-DOM trend means longer vacancies and softer asking-rent achievability than the comps imply.
- What's the recent tenant-quality profile in this submarket — average credit score on applications, eviction rate, late-payment / NSF rate, and stable-employment percentage? A property-management company in the area should have these aggregated.
- How much new for-sale + rental construction is in the pipeline within 1–3 miles? Heavy new supply typically softens prices + rents 12–24 months out; constrained supply supports both.
Investment metrics
- 1% rule
- 1.02% ✓
- Cap rate
- 7.80%
- Cash-on-cash
- 5.40%
- DSCR
- 1.24
- GRM
- 8.2
CMA / ARV
- ARV (median comp)
- $74,862
- List price
- $82,500
- Delta
- 10.20%
- Verdict
- OVERPRICED
- Comps
- 20 within 1.0 mi
Show comp detail 12 sales within ~0.75 mi
| Address | Dist | Beds/Ba | Sqft | Sold | Price | $/sf | Match |
|---|---|---|---|---|---|---|---|
| 939 Francis Ave | 0.03mi | 2/1.0 | 725 (0%) | 6mo | $61,800 | $85 | 94 |
| 1011 Atlantic Ave | 0.14mi | 2/1.0 | 721 (-1%) | 9mo | $94,000 | $130 | 85 |
| 940 Francis Ave | 0.02mi | 2/1.0 | 659 (-9%) | 7mo | $76,000 | $115 | 78 |
| 1043 Atlantic Ave | 0.17mi | 2/1.0 | 812 (+12%) | 8mo | $103,500 | $127 | 65 |
| 1011 National Ave | 0.09mi | 2/1.0 | 833 (+15%) | 8mo | $81,000 | $97 | 65 |
| 2144 Aberdeen Ave | 0.47mi | 2/1.0 | 788 (+9%) | 2mo | $116,000 | $147 | 62 |
| 513 Federman St | 0.66mi | 2/1.0 | 726 (+0%) | 13mo | $84,900 | $117 | 58 |
| 634 Woodsdale Ave | 0.49mi | 2/1.0 | 682 (-6%) | 12mo | $53,000 | $78 | 58 |
| 837 Woodsdale Ave | 0.33mi | 2/1.0 | 638 (-12%) | 10mo | $55,000 | $86 | 56 |
| 769 Colima Dr | 0.69mi | 2/1.0 | 768 (+6%) | 2mo | $107,500 | $140 | 56 |
| 1333 Abbott Ave | 0.63mi | 1/1.0 (-1) | 694 (-4%) | 10mo | $91,245 | $131 | 50 |
| 732 Colima Dr | 0.74mi | 2/1.0 | 829 (+14%) | 2mo | $126,000 | $152 | 40 |
Match score weights: distance 35% · size 25% · config 20% · recency 20%. Top-matched comps best support the ARV.
Projected returns pro-forma
0.75% appreciation · 7.8% rent growth · sell at horizon
- IRR
- 9.5%
- Equity multiple
- 1.49×
- Total profit
- $11,406
- Equity at exit
- $27,093
- IRR
- 16.7%
- Equity multiple
- 3.25×
- Total profit
- $51,984
- Equity at exit
- $35,191
Cash invested: $23,100 (down + closing). Projections, not guarantees.
Landlord ↔ Tenant lean methodology
- Overall (STATE)
- 73 Landlord-Friendly
- State Ohio
- 73 Landlord-Friendly · R+6
- County
- — inherits STATE
- City
- — inherits STATE
ZIP-level market 43609
- Home prices YoY
- 0.3%
- Rents YoY
- 7.8%
- Active inventory
- 99
- Price-to-rent
- 8.2×
Monthly cashflow live
- Estimated rent
- $838 high interval (Pro) →
- Mortgage (P&I)
- −$433
- Tax from tax record
- −$91 /mo · $1,097/yr
- Insurance
- −$34
- HOA
- −$0
- Vacancy / Maint / Mgmt
- −$176
- Net cashflow
- $104
Break-even live
UW: 25.0% down · 7.5% · 30yr · 1.5% tax · 5.0% vac · 8.0% maint · 8.0% mgmt
Financing live
Cash to close
- Down payment
- $20,625
- Closing costs
- $2,475
- Reserves months
- —
- Total cash needed
- —
Loan-product check · same deal, 3 products live
Conventional
25% down · 7.5% · 30yr
- Down + closing
- —
- Monthly P&I
- —
- Monthly cashflow
- —
- DSCR
- —
- Eligible?
- —
Personal DTI + credit; lowest rate.
DSCR
20% down · 8.5% · 30yr
- Down + closing
- —
- Monthly P&I
- —
- Monthly cashflow
- —
- DSCR
- —
- Eligible?
- —
No personal income docs; deal must DSCR.
Hard money
10% down · 12.0% · 12mo
- Down + closing
- —
- Monthly P&I
- —
- Monthly cashflow
- —
- DSCR
- —
- Eligible?
- —
Short-term bridge; refi at stabilization.
Rent comps 9 comps
| Address | Beds | Baths | Sqft | Rent | $/sqft | DOM | Units | Dist |
|---|---|---|---|---|---|---|---|---|
| 1734 Arlington Ave Toledo, OH | 2.0 | 1.0 | 700 | $800 | $1.14 | 13d | 1 | 0.37mi |
| 707 Toronto Ave Toledo, OH | 1.0 | 1.0 | 750 | $775 | $1.03 | 23d | 1 | 0.48mi |
| 538 Nicholas St Unit B Toledo, OH | 1.0 | 1.0 | 600 | $600 | $1.00 | 43d | 1 | 0.83mi |
| 2820 Airport Hwy Toledo, OH | 1.0 | 1.0 | 580 | $679 | $1.17 | 13d | 1 | 1.04mi |
| 2820 Airport Hwy Toledo, OH | 1.0 | 1.0 | 580 | $704 | $1.21 | 23d | 1 | 1.04mi |
| 2820 Airport Hwy Toledo, OH | 1.0 | 1.0 | 580 | $679 | $1.17 | 43d | 1 | 1.04mi |
| 1532 Pennelwood Dr Unit 1521P-2 Toledo, OH | 1.0 | 1.0 | 484 | $720 | $1.49 | 43d | 1 | 1.21mi |
| 1223 Oak Hill Ct Toledo, OH | 1.0–2.0 | 1.0 | 800 | $989 | $1.24 | 13d | 1 | 1.35mi |
| 1037 Orchard St Toledo, OH | 2.0 | 1.0 | 696 | $820 | $1.18 | 21d | 1 | 1.38mi |
Listing history 19 events
-
2026-06-18status $82,500 Pending 42 DOM
-
2026-06-17days on market $82,500 Contingent 42 DOM
-
2026-06-16days on market $82,500 Contingent 41 DOM
-
2026-06-15days on market $82,500 Contingent 40 DOM
-
2026-06-14days on market $82,500 Contingent 38 DOM
-
2026-06-10days on market $82,500 Contingent 35 DOM
-
2026-06-09days on market $82,500 Contingent 34 DOM
-
2026-06-08days on market $82,500 Contingent 33 DOM
-
2026-06-07days on market $82,500 Contingent 32 DOM
-
2026-06-05days on market $82,500 Contingent 29 DOM
-
2026-06-03days on market $82,500 Contingent 28 DOM
-
2026-06-02days on market $82,500 Contingent 27 DOM
-
2026-06-01days on market $82,500 Contingent 26 DOM
-
2026-05-31days on market $82,500 Contingent 25 DOM
-
2026-05-30days on market $82,500 Contingent 24 DOM
-
2026-05-18status Active 1225-char remark
-
2026-05-11historical Contingent 1225-char remark
-
2026-05-06$82,500 Active 1225-char remark
-
1998-10-06soldstatus $44,900
ⓘ Source: listings_history table (triggers on properties + properties_extension) + one-shot
backfill from property_details.listing_events for pre-trigger history.
Tax reassessment forecast OH · Partial reset (capped growth)
- Current annual tax
- $1,097 · $91/mo
- Projected year-2 tax
- $1,192 · $99/mo
- Expected delta
- +$95/yr (+$8/mo · 8.6%)
ⓘ Screening estimate from a state-policy table — verify with the county assessor before closing.
Climate risk First Street
- Flood 1/10 Low FEMA zone X (unshaded) · 0% chance over 30 yrs
- Wildfire 1/10 Low
- Heat 3/10 Moderate 7 d/yr ≥101°F today · 16 d/yr by 30 yrs out
- Wind 2/10 Low
- Air quality 2/10 Low 1 unhealthy d/yr today · 2 by 30 yrs out
Nearby sold comps map
Loading sold comps map…
Walkable amenities ~0.75 mi
Loading nearby amenities…
Taxation est. · year 1
- Rental income
- $10,062
- − Mortgage interest
- −$4,621
- − Property taxes
- −$1,097
- − Insurance
- −$412
- − Repairs & maintenance
- −$805
- − Management
- −$805
- − Depreciation
- −$2,400
- Taxable loss
- −$80
- Est. tax savings @ 24.0%
- +$19
- After-tax cash flow
- $1,266/yr
For passive investors: Depreciation is non-cash, so a rental often shows a tax loss while cash-flowing — sheltering income. Rental losses are passive: they offset passive income freely, and up to $25,000/yr can offset ordinary (W-2) income if you actively participate and your MAGI is under $100k (phasing out to $0 by $150k); unused losses carry forward. On sale, claimed depreciation is recaptured at up to 25%, and gains may owe capital-gains tax (a 1031 exchange can defer both). Figures are a year-1 estimate at your 24.0% rate — not tax advice; consult a CPA.
Schools (NCES district)
- District
- Toledo City
- NCES district ID
- 3904490
- Math proficiency
- 15% ▼ -16.00%
- Reading proficiency
- 24% ▼ -13.00%
- Median HH income
- $32,137
- Composite
- 15.76/100
- National rank
- #9276
- State rank
- #634 of 656 in OH
Livability — Toledo
- Score
- 66/100
- State rank
- #645
- US rank
- #11442
Category grades
Schools grade is shown separately in the Schools card above.
Census & demographics
- Census place
- Toledo, OH
- County
- Lucas County · 380,724 people
- City population
- 280,811
- Metro
- Toledo, OH
- Population (ZIP)
- 21,404
- Household income
- $42,313
- Rent vs Own
- Severe rent burden
- 1603.0
Population outlook (Lucas County) Hauer SSP2
- Today (2025)
- 420,751 people
- By 2030
- 410,187 · -2.5%
- By 2040
- 384,019 · -8.7%
- By 2050
- 355,125 · -15.6%
- By 2075
- 291,683 · -30.7%
- By 2100
- 233,670 · -44.5%
Race, ethnicity, and origin ACS 2023
- Neighborhood character
- Diverse neighborhood (Simpson 0.66)
- Race & ethnicity
- White 47% Black 29% Hispanic / Latino 17% Two or more races 9%
- Hispanic origin (detail)
- Mexican 15%
- Common ancestry
- Romanian 5% Lithuanian 2% Italian 1%
- Foreign-born
- 4% · Canada, China
- Languages at home
- 92% English-only · Spanish 5% Arabic 1% French/Haitian/Cajun 1%
Political lean MEDSL · Lucas
- 2024 margin
- D (+12.6) · D 55.8% · R 43.2%
- 2008→2024 swing
- -18.9pp toward R · 2008: 31.4pp · 2024: 12.6pp
- All cycles
- 2024: D+12.6 2020: D+16.8 2016: D+17.4 2012: D+30.4 2008: D+31.4
Not yet ingested
- Civics
- —
Market trends
- HPI YoY
- ▲ 0.75%
- Current HPI
- 235.2515
- Rent YoY
- ▲ 7.80%
- Metro
- Toledo, OH
- State GDP YoY
- ▲ 1.98%
- F500 in state
- 48
Industry mix (Fortune 500 HQ in OH)
| Industry | F500 HQs | Revenue |
|---|---|---|
| Insurance | 3 | $145B |
|
||
| Industrial Machinery | 3 | $49B |
|
||
| Financial Services | 3 | $24B |
|
||
| Consumer Goods | 2 | $93B |
|
||
| Aerospace / Defense | 2 | $47B |
|
||
| Utilities | 2 | $33B |
|
||
Price history
+83.7% since first listed6 events — show timeline
- 2026-06-18 Pending — NORIS
- 2026-05-22 Contingent — NORIS
- 2026-05-18 Relisted — NORIS
- 2026-05-11 Contingent — NORIS
- 2026-05-06 Listed $82,500 NORIS
- 1998-10-06 Sold (Public Records) $44,900 Public Records
Property tax history
+0.6%/yrLatest (2025): $1,097 · -7.0% YoY. Source: county tax records.
Cash-flow waterfall
monthlySold comps — $/sqft
last 12 mo · ≤1 miLoading sold comps…