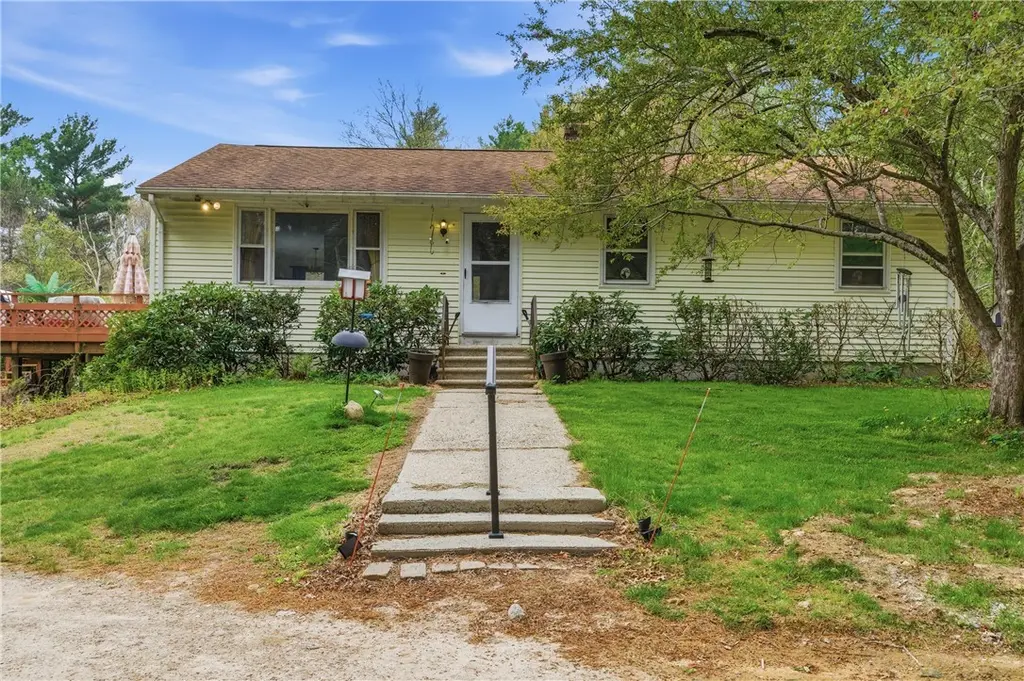
90 Pulaski Rd · Pascoag, RI
Flood risk 1/10 · Minimal
- FEMA flood zone
- X (unshaded)
- Chance of flooding over 30 yrs
- 0.0%
- Est. flood insurance / yr
- $473 – $860
Fire risk 4/10 · Minor
- Est. fire insurance / yr
- $835 – $1,551
Heat risk 3/10 · Minor
- Hot days now (above 93°F)
- 7 days/yr
- Hot days in 30 yrs
- 15 days/yr
Wind risk 6/10 · Moderate
- Chance of severe wind over 30 yrs
- 54.0%
Air-quality risk 2/10 · Minimal
- Unhealthy air days now
- 2 days/yr
- Unhealthy air days in 30 yrs
- 2 days/yr
Risk factors via First Street. Map © Google.
Why this score? — see what drove the F grade
The composite is a weighted blend of 9 inputs, each scored 0–100. Each bar is that input's sub-score; the figure is the points it added to the 100-point composite (weight × sub-score).
- Appreciation +10.0/10.0
- Cash flow +6.3/30.0
- Schools +5.1/10.0
- Livability +3.5/5.0
- Rent growth +2.5/5.0
- Condition / age +2.5/5.0
- 1% rule +0.9/10.0
- DSCR +0.6/10.0
- ARV discount +0.0/15.0
$449,999
🖨 Deal sheet 📄 Offer letter ✓ Due diligence
Listing remarks
* * * OPEN HOUSE CANCELLED * * * Welcome to this cozy three-bedroom home tucked away on a private, wooded lot that offers a peaceful, nature-filled setting. Located in a highly regarded school system, it's a great spot to put down roots while still enjoying a little extra privacy. Inside, the home has a comfortable, easy flow that makes everyday living feel simple and inviting. Step outside and enjoy the yard which features fruit and berry plantings and an above ground pool to relax in. One of the best parts? You're seconds from Pulaski Park, a state park with hiking trails, cross-country skiing, swimming, and fishing right nearby. It's the perfect setup for anyone who loves being outdo
Key facts
- Above ground pool
- Private wooded lot
- Cross-country skiing
Tags
Property features AI
Exterior
- Parking: No garage; Space for about 10 vehicles
- Utilities: Well water; Septic system
- Home design: Single-story home
- Construction: Vinyl siding; Concrete perimeter foundation; Below-grade finished area (basement) approximately 300; Above-grade finished area approximately 1,144
- Exterior features: Deck; 4-acre lot
Interior
- Kitchen: Oven; Range; Dishwasher; Refrigerator
- Bedrooms: Not specified
- Flooring: Carpet; Vinyl
- Bathrooms: 1 full bathroom
- Heating & cooling: Forced-air heating powered by oil; 200+ amp electrical service
- Interior features: Finished full basement with walk-out access; Total of 4 rooms
- Laundry & utility: Washer; Dryer; Oil water heater
Neighborhood map
What this means for you Summary
Snapshot
- This is a 3-bed/1.0-bath single-family listed at $450k.
Deal economics
- At list price, monthly cash flow is $-807 ($-10k/yr) — negative.
- To cash-flow at today's rent, offer at most $307k (31.7% below list).
- To meet the 1% rule (rent ≥ 1% of price), the offer needs to be $265k (41.2% below list).
- Recommended offer: $265k (41.2% below list) — sets the bar for 1% rule.
Location & tenants
- Location reads 70/100 on livability (#17 in RI) — a middle-class / working-renter tenant base. Strengths: crime A+, employment A+, housing A+; Watch: schools F, amenities F, commute F.
- Glocester (rural): math 46% / reading 66% proficiency, ranked #4 of 39 in RI (top 10%) — acceptable for families but not a draw, mixed tenant base, ~2y average lease; only 12% free/reduced lunch — higher-income household profile.
- Market conditions: 39 active listings in the ZIP; 776 units permitted in Providence County in 2024 (229 in 5+ unit buildings).
Forward outlook
- In year one you build about $48k of equity ($3k loan paydown + $45k appreciation (10.0% local appreciation)).
- Providence County population projected at +5% by 2050 — modest demand growth; plan on rents tracking national, not racing it.
- By year 2, paydown + projected appreciation supports a ~$77k cash-out refi (75% LTV) — recoverable capital for the next deal without selling this one.
Negotiation context
- It's been on market 37 days — a 3% lower offer ($436k) is reasonable based on typical stale-listing flexibility.
Risks & watch-outs
- Climate carrying-cost: major wind risk, 54% chance of damaging wind over 30y — expect insurance premiums to compound above CPI over the hold.
Questions for the listing agent
- What do current leases actually rent for vs. the listed asking? Can we see a recent rent roll and the last 12 months of T-12 income?
- It's been on market 37 days. Have you received any prior offers? Is the seller open to a 41% concession, seller financing, or rate buy-down credit?
- Is there a deadline driving the sale (1031 exchange, divorce, estate, relocation)? That informs how much negotiation room exists.
- Schools are F-rated, which usually means shorter tenancies and higher turnover. Who's the typical renter profile here, and what's been the actual vacancy rate?
- The area grade is low — what's the realistic commute time and amenity access for the typical tenant pool here? Any planned neighborhood developments (good or bad) we should know about?
- What's the average days-on-market for RENTAL listings here right now (not sales)? A rising rental-DOM trend means longer vacancies and softer asking-rent achievability than the comps imply.
- What's the recent tenant-quality profile in this submarket — average credit score on applications, eviction rate, late-payment / NSF rate, and stable-employment percentage? A property-management company in the area should have these aggregated.
- How much new for-sale + rental construction is in the pipeline within 1–3 miles? Heavy new supply typically softens prices + rents 12–24 months out; constrained supply supports both.
Investment metrics
- 1% rule
- 0.59% ✗
- Cap rate
- 4.14%
- Cash-on-cash
- -7.69%
- DSCR
- 0.66
- GRM
- 14.2
CMA / ARV
- ARV (on-the-fly)
- $311,168
- Comps found
- 1
Show comp detail 1 sale within ~0.75 mi
| Address | Dist | Beds/Ba | Sqft | Sold | Price | $/sf | Match |
|---|---|---|---|---|---|---|---|
| 10 Rhode Island Line Rd | 0.53mi | 3/1.0 | 1,176 (+3%) | 11mo | $320,000 | $272 | 61 |
Match score weights: distance 35% · size 25% · config 20% · recency 20%. Top-matched comps best support the ARV.
Projected returns pro-forma
10.0% appreciation · 3.0% rent growth · sell at horizon
- IRR
- 18.9%
- Equity multiple
- 2.54×
- Total profit
- $193,595
- Equity at exit
- $405,395
- IRR
- 17.5%
- Equity multiple
- 5.84×
- Total profit
- $610,343
- Equity at exit
- $874,249
Cash invested: $126,000 (down + closing). Projections, not guarantees.
Landlord ↔ Tenant lean methodology
- Overall (STATE)
- 31 Tenant-Leaning
- State Rhode Island
- 31 Tenant-Leaning · D+8
- County
- — inherits STATE
- City
- — inherits STATE
ZIP-level market 02814
- Home prices YoY
- 3.0%
- Active inventory
- 39
- Price-to-rent
- 14.2×
Monthly cashflow live
- Estimated rent
- $2,647 medium interval (Pro) →
- Mortgage (P&I)
- −$2,360
- Tax from tax record
- −$351 /mo · $4,212/yr
- Insurance
- −$187
- HOA
- −$0
- Vacancy / Maint / Mgmt
- −$556
- Net cashflow
- $-807
Break-even live
UW: 25.0% down · 7.5% · 30yr · 1.5% tax · 5.0% vac · 8.0% maint · 8.0% mgmt
Financing live
Cash to close
- Down payment
- $112,500
- Closing costs
- $13,500
- Reserves months
- —
- Total cash needed
- —
Loan-product check · same deal, 3 products live
Conventional
25% down · 7.5% · 30yr
- Down + closing
- —
- Monthly P&I
- —
- Monthly cashflow
- —
- DSCR
- —
- Eligible?
- —
Personal DTI + credit; lowest rate.
DSCR
20% down · 8.5% · 30yr
- Down + closing
- —
- Monthly P&I
- —
- Monthly cashflow
- —
- DSCR
- —
- Eligible?
- —
No personal income docs; deal must DSCR.
Hard money
10% down · 12.0% · 12mo
- Down + closing
- —
- Monthly P&I
- —
- Monthly cashflow
- —
- DSCR
- —
- Eligible?
- —
Short-term bridge; refi at stabilization.
Listing history 11 events
-
2026-06-13statusdays on market $449,999 Pending 37 DOM
-
2026-06-09days on market $449,999 Active Under Contract 34 DOM
-
2026-06-08days on market $449,999 Active Under Contract 33 DOM
-
2026-06-07days on market $449,999 Active Under Contract 32 DOM
-
2026-06-05days on market $449,999 Active Under Contract 29 DOM
-
2026-06-03days on market $449,999 Active Under Contract 28 DOM
-
2026-06-02days on market $449,999 Active Under Contract 27 DOM
-
2026-06-01days on market $449,999 Active Under Contract 26 DOM
-
2026-05-31days on market $449,999 Active Under Contract 25 DOM
-
2026-05-08historical Active Under Contract
-
2026-05-06$449,999 Active
ⓘ Source: listings_history table (triggers on properties + properties_extension) + one-shot
backfill from property_details.listing_events for pre-trigger history.
Tax reassessment forecast RI · Partial reset (capped growth)
- Current annual tax
- $4,212 · $351/mo
- Projected year-2 tax
- $5,773 · $481/mo
- Expected delta
- +$1,561/yr (+$130/mo · 37.1%)
ⓘ Screening estimate from a state-policy table — verify with the county assessor before closing.
Climate risk First Street
- Flood 1/10 Low FEMA zone X (unshaded) · 0% chance over 30 yrs
- Wildfire 4/10 Moderate
- Heat 3/10 Moderate 7 d/yr ≥93°F today · 15 d/yr by 30 yrs out
- Wind 6/10 Major 54% chance of damaging wind over 30 yrs
- Air quality 2/10 Low 2 unhealthy d/yr today · 2 by 30 yrs out
Nearby sold comps map
Loading sold comps map…
Walkable amenities ~0.75 mi
Loading nearby amenities…
Taxation est. · year 1
- Rental income
- $31,768
- − Mortgage interest
- −$25,207
- − Property taxes
- −$4,212
- − Insurance
- −$2,250
- − Repairs & maintenance
- −$2,541
- − Management
- −$2,541
- − Depreciation
- −$13,091
- Taxable loss
- −$18,075
- Est. tax savings @ 24.0%
- +$4,338
- After-tax cash flow
- $-5,346/yr
For passive investors: Depreciation is non-cash, so a rental often shows a tax loss while cash-flowing — sheltering income. Rental losses are passive: they offset passive income freely, and up to $25,000/yr can offset ordinary (W-2) income if you actively participate and your MAGI is under $100k (phasing out to $0 by $150k); unused losses carry forward. On sale, claimed depreciation is recaptured at up to 25%, and gains may owe capital-gains tax (a 1031 exchange can defer both). Figures are a year-1 estimate at your 24.0% rate — not tax advice; consult a CPA.
Schools (NCES district)
- District
- Glocester
- NCES district ID
- 4400450
- Math proficiency
- 46% ▼ -9.00%
- Reading proficiency
- 66% ▲ 2.00%
- Median HH income
- $81,483
- Composite
- 50.69/100
- National rank
- #1822
- State rank
- #4 of 39 in RI
Livability — Pascoag
- Score
- 70/100
- State rank
- #17
- US rank
- #7646
Category grades
Schools grade is shown separately in the Schools card above.
Census & demographics
- Population (ZIP)
- 7,421
Population outlook (Providence County) Hauer SSP2
- Today (2025)
- 653,469 people
- By 2030
- 660,819 · +1.1%
- By 2040
- 672,747 · +3.0%
- By 2050
- 683,741 · +4.6%
- By 2075
- 720,435 · +10.2%
- By 2100
- 741,582 · +13.5%
Race, ethnicity, and origin ACS 2023
- Neighborhood character
- Predominantly White (95%)
- Race & ethnicity
- White 95% Two or more races 3% Hispanic / Latino 1%
- Common ancestry
- Lithuanian 13% Romanian 5% Russian 5%
- Foreign-born
- 2% · Canada
- Languages at home
- 97% English-only · Spanish 1% Other Indo-European 1%
Political lean MEDSL · Providence
- 2024 margin
- D (+14.4) · D 56.1% · R 41.7% · Other 2.2%
- 2008→2024 swing
- -20.0pp toward R · 2008: 34.4pp · 2024: 14.4pp
- All cycles
- 2024: D+14.4 2020: D+22.9 2016: D+21.2 2012: D+34.9 2008: D+34.4
Not yet ingested
- Civics
- —
Market trends
- HPI YoY
- ▲ 11.23%
- Current HPI
- 383.6236
- Rent YoY
- —
- Metro
- —
- State GDP YoY
- ▲ 2.25%
- F500 in state
- 10
Industry mix (Fortune 500 HQ in RI)
| Industry | F500 HQs | Revenue |
|---|---|---|
| Healthcare | 1 | $373B |
|
||
| Food Distribution | 1 | $31B |
|
||
| Aerospace / Defense | 1 | $14B |
|
||
| Financial Services | 1 | $8B |
|
||
| Consumer Goods | 1 | $4B |
|
||
Price history
2 events — show timeline
- 2026-05-08 Contingent — RIS
- 2026-05-06 Listed $449,999 RIS
Property tax history
+0.8%/yrLatest (2025): $4,212 · +2.9% YoY. Source: county tax records.
Cash-flow waterfall
monthlySold comps — $/sqft
last 12 mo · ≤1 miLoading sold comps…