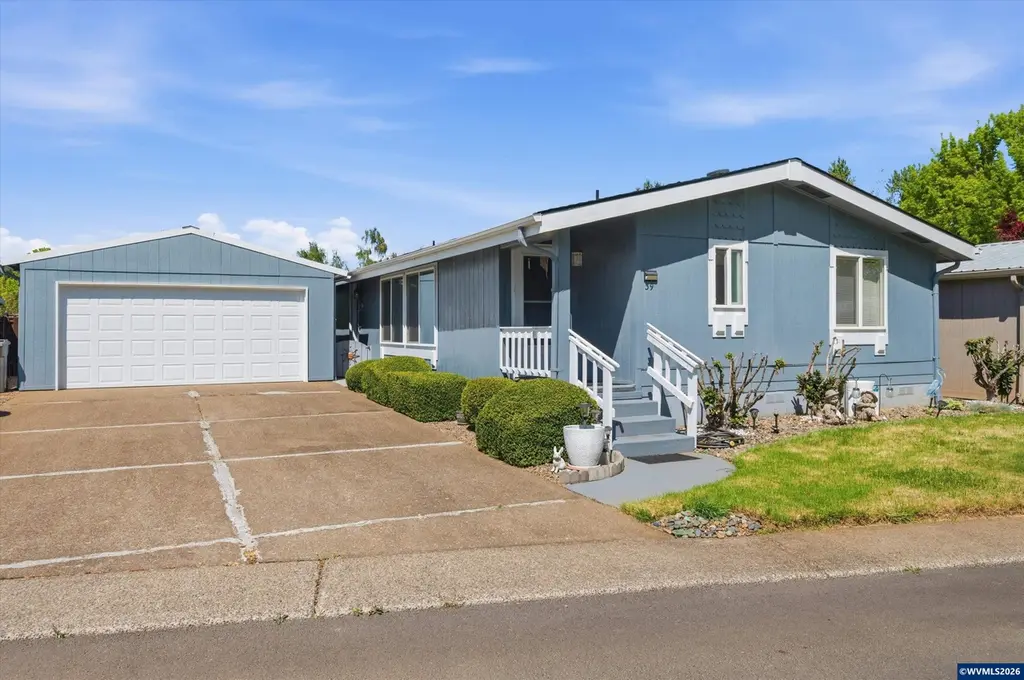
1401 W Ellendale Ave #39 · Dallas, OR
Flood risk 1/10 · Minimal
- FEMA flood zone
- X (unshaded)
- Chance of flooding over 30 yrs
- 0.0%
- Est. flood insurance / yr
- $507 – $1,088
Fire risk 6/10 · Moderate
- Est. fire insurance / yr
- $498 – $926
Heat risk 3/10 · Minor
- Hot days now (above 92°F)
- 7 days/yr
- Hot days in 30 yrs
- 15 days/yr
Wind risk 1/10 · Minimal
- Chance of severe wind over 30 yrs
- —
Air-quality risk 8/10 · Major
- Unhealthy air days now
- 10 days/yr
- Unhealthy air days in 30 yrs
- 10 days/yr
Risk factors via First Street. Map © Google.
Why this score? — see what drove the D grade
The composite is a weighted blend of 9 inputs, each scored 0–100. Each bar is that input's sub-score; the figure is the points it added to the 100-point composite (weight × sub-score).
- Cash flow +14.4/30.0
- ARV discount +5.3/15.0
- DSCR +4.4/10.0
- 1% rule +4.0/10.0
- Livability +4.0/5.0
- Schools +3.7/10.0
- Condition / age +2.8/5.0
- Rent growth +2.5/5.0
- Appreciation +0.0/10.0
$230,000
🖨 Deal sheet 📄 Offer letter ✓ Due diligence
Listing remarks
Accepted Offer with Contingencies. Beautiful home in desirable Meadow Creek 55+ park! Well-cared for with vinyl windows & kitchen skylights providing lots of natural light! Ceiling fans in all bedrooms and living room. Primary bedroom features en suite bath and w/ i closet. Stainless steel appliances in the kitchen. Utility/mud room with hanging storage space and room for an extra fridge. Spacious, fenced yard with covered back patio allows for relaxing outdoors or provides the perfect area for grilling. Full 2-car garage!
Key facts
- Vinyl windows
- W/i closet
- Ceiling fans
Tags
Property features AI
Finance
- Other: Home warranty not included; No assessments or liens reported
- HOA & community: Park rent includes cable, sewer, and water; Adult/55+ park
Exterior
- Parking: Detached 2-car garage
- Utilities: City water (connected); City sewer; Electric water heater
- Home design: Double-wide mobile home; 1995 construction; Blue exterior; T111 siding style; Composite and fiber cement siding; Composition roof; Pier foundation; Located in a 55+ park (Meadow Creek)
- Construction: Built in 1995; Composite and fiber cement siding; Composition roof; Pier foundation
- Exterior features: Fenced yard; Covered back patio; Front porch; Landscaped
Interior
- Kitchen: Stainless steel appliances; Electric range; Dishwasher; Refrigerator included
- Bedrooms: Primary bedroom on the main level with en suite bath and walk-in closet; All bedrooms located on the main level
- Flooring: Carpet; Vinyl
- Bathrooms: Two bathrooms on the main level
- Heating & cooling: Electric heating; Central air conditioning
- Interior features: Ceiling fans in all bedrooms and living room; Kitchen skylights; High-speed communication available; Dining area (combination)
- Laundry & utility: Utility/mud room with hanging storage and space for an extra refrigerator; Washer and dryer included
Neighborhood map
What this means for you Summary
Snapshot
- This is a 3-bed/2.0-bath manufactured listed at $230k. Condition is rated average.
Deal economics
- At list price, monthly cash flow is $45 ($540/yr) — positive.
- The deal already cash-flows at list — no discount required.
- To meet the 1% rule (rent ≥ 1% of price), the offer needs to be $207k (10.0% below list).
- Recommended offer: $207k (10.0% below list) — sets the bar for 1% rule.
- Cap rate 6.5% vs local median 2.4% in Dallas — top-decile yield for the area; either an underpriced asset or a hidden risk that comps aren't pricing in. Stress-test before assuming the spread holds.
Location & tenants
- Location reads 79/100 on livability (#61 in OR, #2,132 nationally) — a middle-class / working-renter tenant base. Strengths: housing A+, health & safety A+, commute A; Watch: amenities F.
- Dallas SD 2 (town): math 32% / reading 48% proficiency, ranked #102 of 183 in OR (top 56%) — families likely to look elsewhere, expect single-tenant / working-renter base with shorter leases.
- Zoned schools: Lyle Elementary School (326 students, 72% FRL); Dallas High School (836 students, 27% FRL).
- Market conditions: 215 active listings in the ZIP; solid renter incomes; 177 units permitted in Polk County in 2024 (14 in 5+ unit buildings).
- This rent runs 31% of the median local income ($79k/yr) — at the standard rent-burdened threshold; future hikes will face affordability resistance.
Forward outlook
- Local home prices are declining (-3.0%/yr); year-one equity from $2k of loan paydown is wiped out by about $7k of value loss. Plan a longer hold.
- Polk County population projected at +25% by 2050 — long-run rental-demand tailwind backs the buy-and-hold thesis.
Negotiation context
- It's been on market 48 days — a 3% lower offer ($223k) is reasonable based on typical stale-listing flexibility.
- 2 sale attempts with the ask held roughly flat each time — persistent listings suggest the price (not the market) is what's stuck; bring a comps-based counter.
Risks & watch-outs
- Climate carrying-cost: major wildfire risk — expect insurance premiums to compound above CPI over the hold.
Questions for the listing agent
- It's been on market 48 days. Have you received any prior offers? Is the seller open to a 10% concession, seller financing, or rate buy-down credit?
- Is there a deadline driving the sale (1031 exchange, divorce, estate, relocation)? That informs how much negotiation room exists.
- Schools are D-rated, which usually means shorter tenancies and higher turnover. Who's the typical renter profile here, and what's been the actual vacancy rate?
- The area grade is low — what's the realistic commute time and amenity access for the typical tenant pool here? Any planned neighborhood developments (good or bad) we should know about?
- What's the average days-on-market for RENTAL listings here right now (not sales)? A rising rental-DOM trend means longer vacancies and softer asking-rent achievability than the comps imply.
- What's the recent tenant-quality profile in this submarket — average credit score on applications, eviction rate, late-payment / NSF rate, and stable-employment percentage? A property-management company in the area should have these aggregated.
- How much new for-sale + rental construction is in the pipeline within 1–3 miles? Heavy new supply typically softens prices + rents 12–24 months out; constrained supply supports both.
Investment metrics
- 1% rule
- 0.90% ✗
- Cap rate
- 6.53%
- Cash-on-cash
- 0.84%
- DSCR
- 1.04
- GRM
- 9.3
CMA / ARV
- ARV (median comp)
- $219,399
- List price
- $230,000
- Delta
- 4.83%
- Verdict
- FAIR
- Comps
- 8 within 1.0 mi
Show comp detail 8 sales within ~0.75 mi
| Address | Dist | Beds/Ba | Sqft | Sold | Price | $/sf | Match |
|---|---|---|---|---|---|---|---|
| 1401 W Ellendale Ave #66 | 0.11mi | 3/2.0 | 1,531 (-4%) | 2mo | $215,000 | $140 | 86 |
| 1401 W Ellendale Ave #50 | 0.08mi | 3/2.0 | 1,512 (-6%) | 1mo | $237,500 | $157 | 86 |
| 1401 Ellendale #9 | 0.10mi | 3/2.0 | 1,539 (-4%) | 5mo | $150,000 | $97 | 84 |
| 1401 W Ellendale Ave #49 | 0.07mi | 3/2.0 | 1,525 (-5%) | 8mo | $228,100 | $150 | 82 |
| 1401 W Ellendale Ave #54 | 0.13mi | 3/2.0 | 1,512 (-6%) | 4mo | $216,341 | $143 | 81 |
| 1401 W Ellendale Ave #74 | 0.10mi | 4/2.0 (+1) | 1,620 (+1%) | 21mo | $250,000 | $154 | 71 |
| 1401 W Ellendale St #99 | 0.10mi | 3/2.0 | 1,526 (-5%) | 24mo | $220,000 | $144 | 68 |
| 1401 W Ellendale Ave #75 | 0.10mi | 3/2.0 | 1,782 (+11%) | 18mo | $195,000 | $109 | 61 |
Match score weights: distance 35% · size 25% · config 20% · recency 20%. Top-matched comps best support the ARV.
Projected returns pro-forma
-3.0% appreciation · 3.0% rent growth · sell at horizon
- IRR
- -14.9%
- Equity multiple
- 0.47×
- Total profit
- $-34,373
- Equity at exit
- $34,294
- IRR
- -6.3%
- Equity multiple
- 0.59×
- Total profit
- $-26,115
- Equity at exit
- $19,886
Cash invested: $64,400 (down + closing). Projections, not guarantees.
Landlord ↔ Tenant lean methodology
- Overall (STATE)
- 28 Tenant-Leaning
- State Oregon
- 28 Tenant-Leaning · D+6
- County
- — inherits STATE
- City
- — inherits STATE
ZIP-level market 97338
- Active inventory
- 215
- Price-to-rent
- 9.3×
Monthly cashflow live
- Estimated rent
- $2,069 medium interval (Pro) →
- Mortgage (P&I)
- −$1,206
- Tax est. 1.5%
- −$288 /mo · $3,450/yr
- Insurance
- −$96
- HOA
- −$0
- Vacancy / Maint / Mgmt
- −$434
- Net cashflow
- $45
Break-even live
UW: 25.0% down · 7.5% · 30yr · 1.5% tax · 5.0% vac · 8.0% maint · 8.0% mgmt
Financing live
Cash to close
- Down payment
- $57,500
- Closing costs
- $6,900
- Reserves months
- —
- Total cash needed
- —
Loan-product check · same deal, 3 products live
Conventional
25% down · 7.5% · 30yr
- Down + closing
- —
- Monthly P&I
- —
- Monthly cashflow
- —
- DSCR
- —
- Eligible?
- —
Personal DTI + credit; lowest rate.
DSCR
20% down · 8.5% · 30yr
- Down + closing
- —
- Monthly P&I
- —
- Monthly cashflow
- —
- DSCR
- —
- Eligible?
- —
No personal income docs; deal must DSCR.
Hard money
10% down · 12.0% · 12mo
- Down + closing
- —
- Monthly P&I
- —
- Monthly cashflow
- —
- DSCR
- —
- Eligible?
- —
Short-term bridge; refi at stabilization.
Listing history 17 events
-
2026-06-18days on market $230,000 Active 48 DOM
-
2026-06-17days on market $230,000 Active 47 DOM
-
2026-06-16statusdays on market $230,000 Active 46 DOM
-
2026-06-15remarks 530-char remark
-
2026-06-15status $230,000 Active under Contract 45 DOM
-
2026-06-15days on market $230,000 Active 45 DOM
-
2026-06-14days on market $230,000 Active 43 DOM
-
2026-06-10days on market $230,000 Active 40 DOM
-
2026-06-09days on market $230,000 Active 39 DOM
-
2026-06-08days on market $230,000 Active 38 DOM
-
2026-06-07days on market $230,000 Active 37 DOM
-
2026-06-03days on market $230,000 Active 33 DOM
-
2026-06-02days on market $230,000 Active 32 DOM
-
2026-06-01days on market $230,000 Active 31 DOM
-
2026-05-31days on market $230,000 Active 30 DOM
-
2026-05-30days on market $230,000 Active 29 DOM
-
2026-05-01$230,000 Active 496-char remark
ⓘ Source: listings_history table (triggers on properties + properties_extension) + one-shot
backfill from property_details.listing_events for pre-trigger history.
Climate risk First Street
- Flood 1/10 Low FEMA zone X (unshaded) · 0% chance over 30 yrs
- Wildfire 6/10 Major
- Heat 3/10 Moderate 7 d/yr ≥92°F today · 15 d/yr by 30 yrs out
- Wind 1/10 Low
- Air quality 8/10 Severe 10 unhealthy d/yr today · 10 by 30 yrs out
Nearby sold comps map
Loading sold comps map…
Walkable amenities ~0.75 mi
Loading nearby amenities…
Taxation est. · year 1
- Rental income
- $24,827
- − Mortgage interest
- −$12,884
- − Property taxes
- −$3,450
- − Insurance
- −$1,150
- − Repairs & maintenance
- −$1,986
- − Management
- −$1,986
- − Depreciation
- −$6,691
- Taxable loss
- −$3,319
- Est. tax savings @ 24.0%
- +$797
- After-tax cash flow
- $1,337/yr
For passive investors: Depreciation is non-cash, so a rental often shows a tax loss while cash-flowing — sheltering income. Rental losses are passive: they offset passive income freely, and up to $25,000/yr can offset ordinary (W-2) income if you actively participate and your MAGI is under $100k (phasing out to $0 by $150k); unused losses carry forward. On sale, claimed depreciation is recaptured at up to 25%, and gains may owe capital-gains tax (a 1031 exchange can defer both). Figures are a year-1 estimate at your 24.0% rate — not tax advice; consult a CPA.
Condition & rehab AI · 12 photos
This home is in average condition with some cosmetic updates needed to enhance its resale and rental value. The kitchen and bathrooms could benefit from updates, and the exterior siding and landscaping could be improved for a more appealing appearance.
Repairs flagged
- Minor Kitchen cabinets — Light wear and tear.
- Minor Kitchen countertops — Light wear and tear.
- Minor Bathroom fixtures — Possibly outdated design.
- Minor Exterior siding — Weathered appearance.
- Minor Interior walls/paint — Faded paint in some areas.
- Minor Landscaping — Could be improved for curb appeal.
Value-add opportunities
- Resale Paint interior walls — Fresh paint can make a significant difference in the home's appearance.
- Resale Replace kitchen countertops — Modern countertops can enhance the kitchen's functionality and aesthetics.
- Resale Update bathroom fixtures — Upgrading fixtures can improve the bathroom's functionality and appearance.
- Resale Paint exterior siding — Fresh paint can improve the home's curb appeal.
- Both Landscaping — Improved landscaping can enhance both the home's curb appeal and its rental value.
Renovation cost estimate screening
| Repair item | Severity | Est. cost |
|---|---|---|
| Kitchen cabinets · Light wear and tear. | Minor | $500–3,000 |
| Kitchen countertops · Light wear and tear. | Minor | $500–3,000 |
| Bathroom fixtures · Possibly outdated design. | Minor | $500–3,000 |
| Exterior siding · Weathered appearance. | Minor | $500–3,000 |
| Interior walls/paint · Faded paint in some areas. | Minor | $500–3,000 |
| Landscaping · Could be improved for curb appeal. | Minor | $500–3,000 |
| Total estimated repair cost · 6 items | $3,000–18,000 |
Value-add ROI direction
- Resale Paint interior walls — Fresh paint can make a significant difference in the home's appearance. ↑
- Resale Replace kitchen countertops — Modern countertops can enhance the kitchen's functionality and aesthetics. ↑
- Resale Update bathroom fixtures — Upgrading fixtures can improve the bathroom's functionality and appearance. ↑
- Resale Paint exterior siding — Fresh paint can improve the home's curb appeal. ↑
- Both Landscaping — Improved landscaping can enhance both the home's curb appeal and its rental value. ↑
ⓘ Cost ranges are severity-bucket heuristics (US national rule-of-thumb). Get contractor quotes + a written scope before underwriting a rehab budget.
Schools (NCES district)
- District
- Dallas SD 2
- NCES district ID
- 4103860
- Math proficiency
- 32% ▼ -7.00%
- Reading proficiency
- 48% ▼ -4.00%
- Median HH income
- $53,684
- Composite
- 37.24/100
- National rank
- #8983
- State rank
- #102 of 183 in OR
Livability — Dallas
- Score
- 79/100
- State rank
- #61
- US rank
- #2132
Category grades
Schools grade is shown separately in the Schools card above.
Census & demographics
- Census place
- Dallas, OR
- County
- Polk County · 84,240 people
- City population
- 23,419
- Metro
- Salem, OR
- Population (ZIP)
- 23,419
- Household income
- $78,858
- Rent vs Own
- Severe rent burden
- 782.0
Population outlook (Polk County) Hauer SSP2
- Today (2025)
- 88,594 people
- By 2030
- 93,209 · +5.2%
- By 2040
- 101,942 · +15.1%
- By 2050
- 110,395 · +24.6%
- By 2075
- 131,091 · +48.0%
- By 2100
- 141,746 · +60.0%
Race, ethnicity, and origin ACS 2023
- Neighborhood character
- Predominantly White (81%)
- Race & ethnicity
- White 81% Hispanic / Latino 10% Two or more races 9% Native American 2%
- Hispanic origin (detail)
- Mexican 8%
- Common ancestry
- Slovak 4% Portuguese 3% Lithuanian 3%
- Foreign-born
- 3% · Canada
- Languages at home
- 95% English-only · Spanish 4%
Political lean MEDSL · Polk
- 2024 margin
- Toss-up / Even · D 46.6% · R 50.4% · Other 3.0%
- 2008→2024 swing
- -3.3pp toward R · 2008: -0.5pp · 2024: -3.8pp
- All cycles
- 2024: R+3.8 2020: R+1.7 2016: R+7.0 2012: R+4.8 2008: R+0.5
Not yet ingested
- Civics
- —
Market trends
- HPI YoY
- ▼ -332.14%
- Current HPI
- 311.4157
- Rent YoY
- —
- Metro
- Salem, OR
- State GDP YoY
- ▲ 2.05%
- F500 in state
- 2
Industry mix (Fortune 500 HQ in OR)
| Industry | F500 HQs | Revenue |
|---|---|---|
| Consumer Goods | 1 | $51B |
|
||
Price history
3 events — show timeline
- 2026-06-16 Relisted — WVMLS
- 2026-06-15 Contingent — WVMLS
- 2026-05-01 Listed $230,000 WVMLS
Cash-flow waterfall
monthlySold comps — $/sqft
last 12 mo · ≤1 miLoading sold comps…