 🏷️ Likely Rental
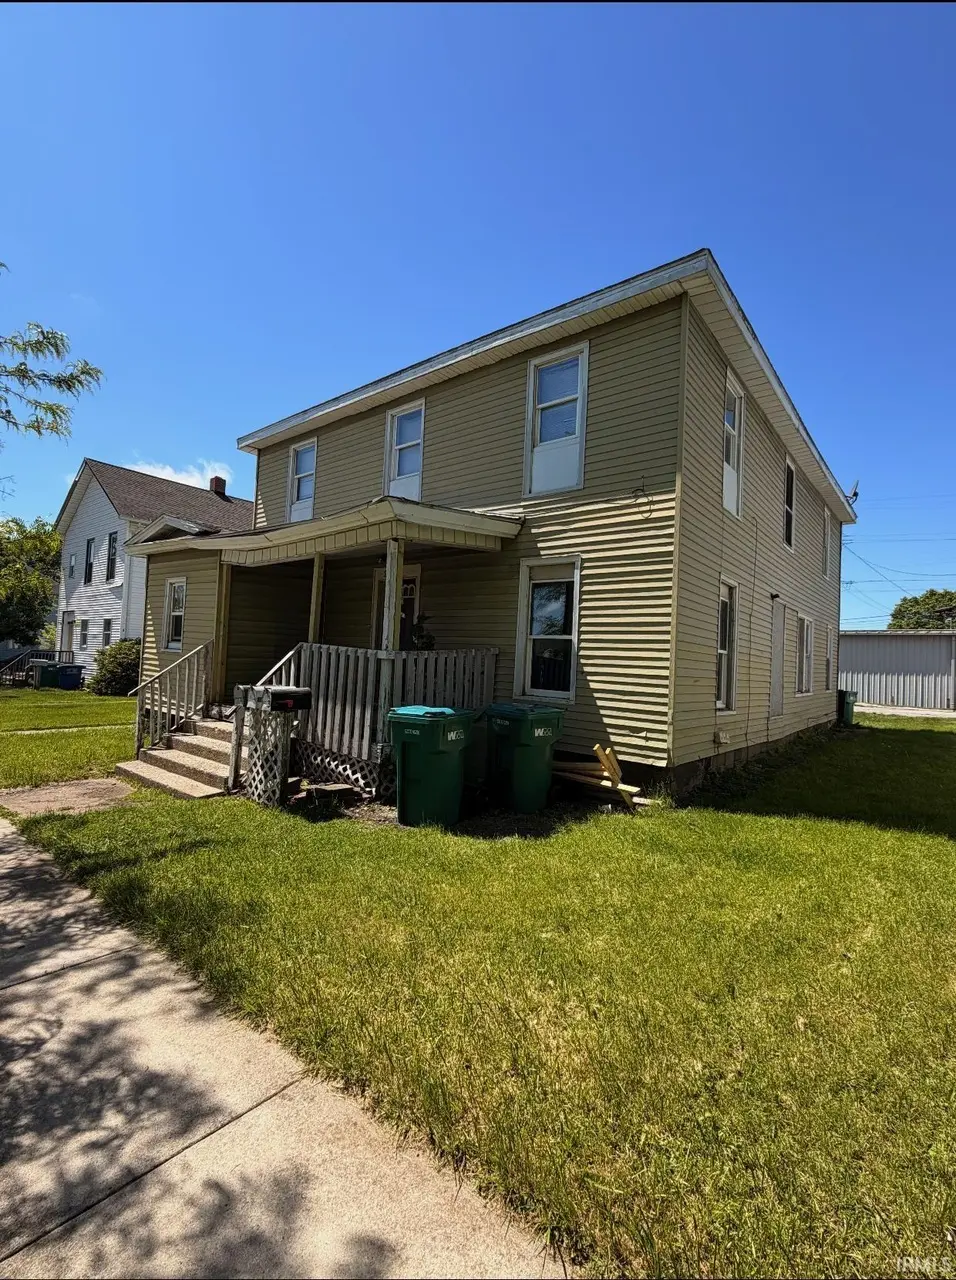
307 State St · La Porte, IN
Flood risk 1/10 · Minimal
- FEMA flood zone
- X (unshaded)
- Chance of flooding over 30 yrs
- 0.0%
- Est. flood insurance / yr
- $473 – $860
Fire risk 1/10 · Minimal
- Est. fire insurance / yr
- $717 – $1,331
Heat risk 2/10 · Minimal
- Hot days now (above 99°F)
- 7 days/yr
- Hot days in 30 yrs
- 15 days/yr
Wind risk 2/10 · Minimal
- Chance of severe wind over 30 yrs
- —
Air-quality risk 2/10 · Minimal
- Unhealthy air days now
- 2 days/yr
- Unhealthy air days in 30 yrs
- 2 days/yr
Risk factors via First Street. Map © Google.
Why this score? — see what drove the B+ grade
The composite is a weighted blend of 9 inputs, each scored 0–100. Each bar is that input's sub-score; the figure is the points it added to the 100-point composite (weight × sub-score).
- Cash flow +30.0/30.0
- ARV discount +15.0/15.0
- 1% rule +10.0/10.0
- DSCR +10.0/10.0
- Livability +3.7/5.0
- Schools +3.5/10.0
- Rent growth +2.5/5.0
- Condition / age +2.5/5.0
- Appreciation +0.0/10.0
$179,000
🖨 Deal sheet 📄 Offer letter ✓ Due diligence
Multi-family units
County records classify this as Multi-Family (2-4 Unit). Listing-text estimate: 3 units. confirmed
Listing remarks
Excellent value-add investment opportunity in LaPorte! This triplex features all separately metered units, offering simplified management and utility responsibility. One unit has recently been turned and is rent-ready, creating an immediate opportunity for maximum market rent. Another unit is currently rented with a long term tenant at $555/month with room for rental growth. The spacious upper unit offers great layout potential and will be vacant as of 5/30, providing flexibility for renovations, owner occupancy, or increased rental income. Several new windows have recently been added to the property, providing additional value and improvements. Located in a strong rental area with consiste
Key facts
- Strong rental demand
- Near downtown
- Three units
Tags
Property features AI
Finance
- Other: Pets allowed
Exterior
- Utilities: Public water; Public sewer
- Home design: Residential income property (Triplex); 2 stories
- Construction: Vinyl siding
- Exterior features: Level lot
Interior
- Kitchen: Range; Refrigerator
- Flooring: Carpet
- Bathrooms: 3 full bathrooms; 6 main-level bathrooms
- Heating & cooling: Forced air heating
- Interior features: Range; Refrigerator; Carpet flooring; Unfinished basement
- Laundry & utility: Washer hookup; Basement (unfinished)
Neighborhood map
What this means for you Summary
Snapshot
- This is a 3 × 2-bed/1.0-bath units multifamily listed at $179k.
Deal economics
- At list price, monthly cash flow is $1k ($18k/yr) — positive. Per door: $498/mo.
- The deal already cash-flows at list — no discount required.
- Meets the 1% rule at list price ($3k rent vs $179k).
- Recommended offer: $174k (3.0% below list) — sets the bar for market timing.
- Cap rate 16.3% vs local median 3.7% in La Porte — top-decile yield for the area; either an underpriced asset or a hidden risk that comps aren't pricing in. Stress-test before assuming the spread holds.
Location & tenants
- Location reads 74/100 on livability (#81 in IN, #4,852 nationally) — a middle-class / working-renter tenant base. Strengths: amenities A+, cost of living A+, housing A+; Watch: commute F, employment F.
- Laporte Community School Corporation (urban): math 37% / reading 44% proficiency, ranked #139 of 301 in IN (top 46%) — families likely to look elsewhere, expect single-tenant / working-renter base with shorter leases.
- Zoned schools: Riley Elementary School (math 42% / reading 52%, grade D-, #325 of 994 statewide, top 36%, 296 students, 77% FRL) — zoned schools average 77% FRL vs 44% district-wide (33 pts higher); higher-poverty schools than district average — tighter screening recommended.
- Market conditions: 260 active listings in the ZIP; 216 units permitted in LaPorte County in 2024 (75 in 5+ unit buildings).
- At $3,406/mo this rent would consume 55% of the median local household income ($74k/yr) (locally 835% of renters already pay >50% of income on rent) — very limited rent-growth headroom before tenants either downsize or default.
Forward outlook
- Local home prices are declining (-3.0%/yr); year-one equity from $1k of loan paydown is wiped out by about $5k of value loss. Plan a longer hold.
- LaPorte County population projected to shrink 7% by 2050 — rents likely to lag national; underwrite the cash flow, not the appreciation.
- At projected returns (-3.0% appreciation + 3.0% rent growth), your $50k cash investment doubles in ~4 years — after that, you're playing with house money.
Negotiation context
- It's been on market 35 days — a 3% lower offer ($174k) is reasonable based on typical stale-listing flexibility.
- 8 sale attempts since 20y ago with the ask held roughly flat each time — persistent listings suggest the price (not the market) is what's stuck; bring a comps-based counter.
- Current owner paid $90k; list at $179k implies a 99% gain — meaningful room to come down on a strong offer.
Risks & watch-outs
- Watch-outs: built in 1920 — expect roof / HVAC / electrical / plumbing capex.
Questions for the listing agent
- It's been on market 35 days. Have you received any prior offers? Is the seller open to a 3% concession, seller financing, or rate buy-down credit?
- Can we see the unit-by-unit rent roll, current vacancy, and any below-market leases? What's the average tenancy length?
- What capital expenditures (roof, boiler, parking lot, exteriors) have been made in the last 5 years, and what's planned in the next 2?
- Built in 1920 — when were the roof, HVAC, electrical panel, plumbing, and water heater last replaced?
- Is there a deadline driving the sale (1031 exchange, divorce, estate, relocation)? That informs how much negotiation room exists.
- What's the average days-on-market for RENTAL listings here right now (not sales)? A rising rental-DOM trend means longer vacancies and softer asking-rent achievability than the comps imply.
- What's the recent tenant-quality profile in this submarket — average credit score on applications, eviction rate, late-payment / NSF rate, and stable-employment percentage? A property-management company in the area should have these aggregated.
- How much new apartment / multifamily construction is in the pipeline within 1–3 miles? Heavy new supply (>2% of stock underway) typically softens rents 12–24 months out; light construction supports rent growth.
Investment metrics
- 1% rule
- 1.90% ✓
- Cap rate
- 16.32%
- Cash-on-cash
- 35.80%
- DSCR
- 2.59
- GRM
- 4.4
CMA / ARV
- ARV (on-the-fly)
- $264,495
- Comps found
- 1
Show comp detail 1 sale within ~0.75 mi
| Address | Dist | Beds/Ba | Sqft | Sold | Price | $/sf | Match |
|---|---|---|---|---|---|---|---|
| 605 Linwood Ave Unit 1-4 | 0.06mi | 7/4.0 (+1) | 2,568 (+2%) | 22mo | $270,000 | $105 | 66 |
Match score weights: distance 35% · size 25% · config 20% · recency 20%. Top-matched comps best support the ARV.
Projected returns pro-forma
-3.0% appreciation · 3.0% rent growth · sell at horizon
- IRR
- 31.5%
- Equity multiple
- 2.32×
- Total profit
- $66,256
- Equity at exit
- $26,689
- IRR
- 38.6%
- Equity multiple
- 4.60×
- Total profit
- $180,431
- Equity at exit
- $15,477
Cash invested: $50,120 (down + closing). Projections, not guarantees.
Landlord ↔ Tenant lean methodology
- Overall (STATE)
- 90 Strongly Landlord-Friendly
- State Indiana
- 90 Strongly Landlord-Friendly · R+11
- County
- — inherits STATE
- City
- — inherits STATE
ZIP-level market 46350
- Active inventory
- 260
- Price-to-rent
- 13.1×
Monthly cashflow live
- Estimated rent
- $3,406 medium interval (Pro) →
- Mortgage (P&I)
- −$939
- Tax from tax record
- −$182 /mo · $2,186/yr
- Insurance
- −$75
- HOA
- −$0
- Vacancy / Maint / Mgmt
- −$715
- Net cashflow
- $1,495
Break-even live
3-unit breakdown (identical units grouped — click to expand)
| Units | Beds | Baths | Est. rent |
|---|---|---|---|
| 3× units | 2 | 1 | $3,405 |
| #1 | 2 | 1 | $1,135 |
| #2 | 2 | 1 | $1,135 |
| #3 | 2 | 1 | $1,135 |
| Total (3 units) | $3,406 | ||
UW: 25.0% down · 7.5% · 30yr · 1.5% tax · 5.0% vac · 8.0% maint · 8.0% mgmt
Financing live
Cash to close
- Down payment
- $44,750
- Closing costs
- $5,370
- Reserves months
- —
- Total cash needed
- —
Loan-product check · same deal, 3 products live
Conventional
25% down · 7.5% · 30yr
- Down + closing
- —
- Monthly P&I
- —
- Monthly cashflow
- —
- DSCR
- —
- Eligible?
- —
Personal DTI + credit; lowest rate.
DSCR
20% down · 8.5% · 30yr
- Down + closing
- —
- Monthly P&I
- —
- Monthly cashflow
- —
- DSCR
- —
- Eligible?
- —
No personal income docs; deal must DSCR.
Hard money
10% down · 12.0% · 12mo
- Down + closing
- —
- Monthly P&I
- —
- Monthly cashflow
- —
- DSCR
- —
- Eligible?
- —
Short-term bridge; refi at stabilization.
Listing history 31 events
-
2026-06-19days on market $179,000 Active 35 DOM
-
2026-06-18days on market $179,000 Active 34 DOM
-
2026-06-17days on market $179,000 Active 33 DOM
-
2026-06-16days on market $179,000 Active 32 DOM
-
2026-06-15days on market $179,000 Active 31 DOM
-
2026-06-14days on market $179,000 Active 29 DOM
-
2026-06-13days on market $179,000 Active 28 DOM
-
2026-06-10days on market $179,000 Active 26 DOM
-
2026-06-09days on market $179,000 Active 25 DOM
-
2026-06-08days on market $179,000 Active 24 DOM
-
2026-06-07days on market $179,000 Active 23 DOM
-
2026-06-05days on market $179,000 Active 20 DOM
-
2026-06-02days on market $179,000 Active 18 DOM
-
2026-06-01days on market $179,000 Active 17 DOM
-
2026-05-31days on market $179,000 Active 16 DOM
-
2026-05-30days on market $179,000 Active 15 DOM
-
2026-05-15$179,000 Active
-
2026-02-23$175,000 Active
-
2022-06-01historical
-
2022-05-09status Deal Fell Through
-
2022-04-17historical Active Under Contract
-
2022-04-17$139,000 Active
-
2021-06-18soldstatus $90,000
-
2021-03-25$119,000
-
2011-05-26soldstatus $16,000
-
2011-03-12historical
-
2010-12-15$22,000
-
2010-11-18soldstatus $85,895
-
2010-09-13$89,900
-
2006-10-24$79,000
-
2000-07-11soldstatus $75,000
ⓘ Source: listings_history table (triggers on properties + properties_extension) + one-shot
backfill from property_details.listing_events for pre-trigger history.
Tax reassessment forecast IN · Partial reset (capped growth)
- Current annual tax
- $2,186 · $182/mo
- Projected year-2 tax
- $2,186 · $182/mo
- Expected delta
- $0/yr ($0/mo · 0.0%)
ⓘ Screening estimate from a state-policy table — verify with the county assessor before closing.
Climate risk First Street
- Flood 1/10 Low FEMA zone X (unshaded) · 0% chance over 30 yrs
- Wildfire 1/10 Low
- Heat 2/10 Low 7 d/yr ≥99°F today · 15 d/yr by 30 yrs out
- Wind 2/10 Low
- Air quality 2/10 Low 2 unhealthy d/yr today · 2 by 30 yrs out
Nearby sold comps map
Loading sold comps map…
Walkable amenities ~0.75 mi
Loading nearby amenities…
Taxation est. · year 1
- Rental income
- $40,872
- − Mortgage interest
- −$10,027
- − Property taxes
- −$2,186
- − Insurance
- −$895
- − Repairs & maintenance
- −$3,270
- − Management
- −$3,270
- − Depreciation
- −$5,207
- Taxable income
- $16,017
- Est. tax owed @ 24.0%
- −$3,844
- After-tax cash flow
- $14,099/yr
For passive investors: Depreciation is non-cash, so a rental often shows a tax loss while cash-flowing — sheltering income. Rental losses are passive: they offset passive income freely, and up to $25,000/yr can offset ordinary (W-2) income if you actively participate and your MAGI is under $100k (phasing out to $0 by $150k); unused losses carry forward. On sale, claimed depreciation is recaptured at up to 25%, and gains may owe capital-gains tax (a 1031 exchange can defer both). Figures are a year-1 estimate at your 24.0% rate — not tax advice; consult a CPA.
Schools (NCES district)
- District
- Laporte Community School Corporation
- NCES district ID
- 1805580
- Math proficiency
- 37% ▼ -13.00%
- Reading proficiency
- 44% ▼ -11.00%
- Median HH income
- $46,761
- Composite
- 34.58/100
- National rank
- #5162
- State rank
- #139 of 301 in IN
Livability — La Porte
- Score
- 74/100
- State rank
- #81
- US rank
- #4852
Category grades
Schools grade is shown separately in the Schools card above.
Census & demographics
- Census place
- La Porte, IN
- County
- La Porte County · 88,580 people
- City population
- 44,763
- Metro
- Michigan City-La Porte, IN
- Population (ZIP)
- 44,763
- Household income
- $74,307
- Rent vs Own
- Severe rent burden
- 835.0
Population outlook (LaPorte County) Hauer SSP2
- Today (2025)
- 109,757 people
- By 2030
- 108,288 · -1.3%
- By 2040
- 105,070 · -4.3%
- By 2050
- 102,330 · -6.8%
- By 2075
- 97,009 · -11.6%
- By 2100
- 86,459 · -21.2%
Race, ethnicity, and origin ACS 2023
- Neighborhood character
- Predominantly White (82%)
- Race & ethnicity
- White 82% Two or more races 8% Hispanic / Latino 8% Black 3%
- Hispanic origin (detail)
- Mexican 6%
- Common ancestry
- Romanian 11% Iranian 3% Italian 2%
- Foreign-born
- 4% · Canada
- Languages at home
- 93% English-only · Spanish 4% Russian/Polish/Slavic 1% German/W. Germanic 1%
Political lean MEDSL · LaPorte
- 2024 margin
- R (+14.1) · D 42.1% · R 56.2% · Other 1.7%
- 2008→2024 swing
- -19.1pp toward R · 2008: 5.0pp · 2024: -14.1pp
- All cycles
- 2024: R+14.1 2020: R+7.2 2016: R+6.4 2012: D+12.6 2008: D+5.0
Not yet ingested
- Civics
- —
Market trends
- HPI YoY
- ▼ -142.94%
- Current HPI
- 209.2564
- Rent YoY
- —
- Metro
- Michigan City-La Porte, IN
- State GDP YoY
- ▲ 2.90%
- F500 in state
- 18
Industry mix (Fortune 500 HQ in IN)
| Industry | F500 HQs | Revenue |
|---|---|---|
| Industrial Machinery | 2 | $37B |
|
||
| Healthcare | 1 | $177B |
|
||
| Pharmaceuticals | 1 | $45B |
|
||
| Metals / Steel | 1 | $18B |
|
||
| Agriculture | 1 | $17B |
|
||
| Packaging | 1 | $12B |
|
||
Price history
+138.7% since first listed15 events — show timeline
- 2026-05-15 Listed $179,000 IRMLS
- 2026-02-23 Listed $175,000 IRMLS
- 2022-06-01 Listing Removed — NIRA MLS as Distributed by MLS Grid
- 2022-05-09 Relisted — NIRA MLS as Distributed by MLS Grid
- 2022-04-17 Contingent — NIRA MLS as Distributed by MLS Grid
- 2022-04-17 Listed $139,000 NIRA MLS as Distributed by MLS Grid
- 2021-06-18 Sold (MLS) $90,000 NIRA MLS as Distributed by MLS Grid
- 2021-03-25 Listed $119,000 NIRA MLS as Distributed by MLS Grid
- 2011-05-26 Sold (MLS) $16,000 NIRA MLS as Distributed by MLS Grid
- 2011-03-12 Listing Removed — NIRA MLS as Distributed by MLS Grid
- 2010-12-15 Listed $22,000 NIRA MLS as Distributed by MLS Grid
- 2010-11-18 Sold (Public Records) $85,895 Public Records
- 2010-09-13 Listed $89,900 NIRA MLS as Distributed by MLS Grid
- 2006-10-24 Listed $79,000 NIRA MLS as Distributed by MLS Grid
- 2000-07-11 Sold (Public Records) $75,000 Public Records
Property tax history
+8.2%/yrLatest (2024): $2,186 · +0.0% YoY. Source: county tax records.
Cash-flow waterfall
monthlySold comps — $/sqft
last 12 mo · ≤1 miLoading sold comps…