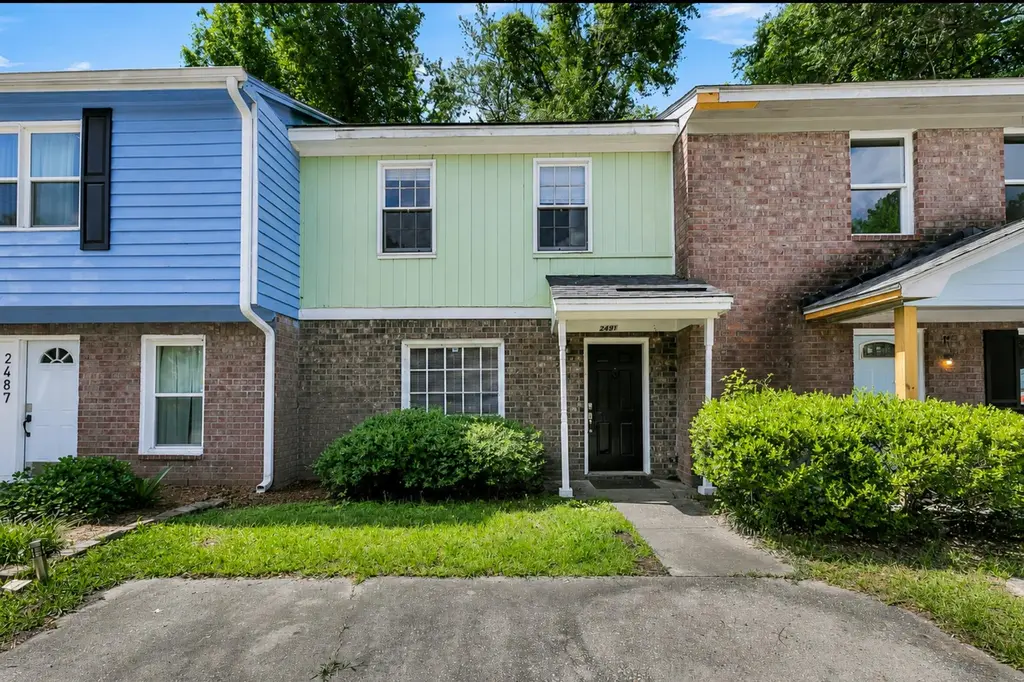
2491 Realm St · North Charleston, SC
Flood risk 1/10 · Minimal
- FEMA flood zone
- X (unshaded)
- Chance of flooding over 30 yrs
- 0.0%
- Est. flood insurance / yr
- $507 – $1,088
Fire risk 2/10 · Minimal
- Est. fire insurance / yr
- $783 – $1,453
Heat risk 9/10 · Severe
- Hot days now (above 107°F)
- 7 days/yr
- Hot days in 30 yrs
- 17 days/yr
Wind risk 8/10 · Major
- Chance of severe wind over 30 yrs
- 99.0%
Air-quality risk 3/10 · Minor
- Unhealthy air days now
- 3 days/yr
- Unhealthy air days in 30 yrs
- 3 days/yr
Risk factors via First Street. Map © Google.
Why this score? — see what drove the D grade
The composite is a weighted blend of 9 inputs, each scored 0–100. Each bar is that input's sub-score; the figure is the points it added to the 100-point composite (weight × sub-score).
- Cash flow +13.6/30.0
- ARV discount +9.6/15.0
- Schools +4.3/10.0
- DSCR +4.1/10.0
- Livability +3.3/5.0
- 1% rule +3.1/10.0
- Rent growth +2.8/5.0
- Condition / age +2.5/5.0
- Appreciation +0.0/10.0
$199,900
🖨 Deal sheet (PDF) 📄 Offer letter ✓ Due diligence
Listing remarks MLS
Move in ready townhome with no HOA. This nice townhome has 2 bedrooms, 1.5 bathrooms, kitchen, dining room and laundry room. There is no carpet. Home has been freshly painted, has smooth ceilings, new ceiling fans, new floors, new refrigerator, new lights and new tile stand up shower. Laundry room is downstairs. Great for an investor or potential first time homeowner. Conveniently located to I-26 and Ashley Phosphate. Close to shopping, Walmart, Northwoods mall and restaurants.
Key facts
- Spacious living area
- Private outdoor area
- Move in ready
Tags
Property features AI
Exterior
- Parking: Off-street parking
- Utilities: Public sewer
- Home design: Single-family attached (townhouse); Two levels; Ground-level entry
- Construction: Asphalt roof; Townhouse structure; Fee simple ownership
- Exterior features: Partial fencing; Level lot
Interior
- Kitchen: Dishwasher; Electric range; Refrigerator
- Bedrooms: 2 bedrooms; Primary bedroom located on upper level with ceiling fan
- Flooring: Laminate flooring
- Bathrooms: 1 full and 1 half bathroom
- Heating & cooling: Electric heating; Central air conditioning
- Interior features: Smooth ceilings; Ceiling fans; Eat-in kitchen; Family room; Pantry
- Laundry & utility: Laundry room; Washer hookup; Electric dryer hookup
Neighborhood map
What this means for you Summary
Snapshot
- This is a 2-bed/1.5-bath townhouse listed at $200k.
Deal economics
- At list price, monthly cash flow is $12 ($142/yr) — positive.
- The deal already cash-flows at list — no discount required.
- To meet the 1% rule (rent ≥ 1% of price), the offer needs to be $162k (19.1% below list).
- Recommended offer: $162k (19.1% below list) — sets the bar for 1% rule.
- Cap rate 6.4% vs local median 4.0% in North Charleston — top-decile yield for the area; either an underpriced asset or a hidden risk that comps aren't pricing in. Stress-test before assuming the spread holds.
Location & tenants
- Location reads 66/100 on livability (#122 in SC) — a middle-class / working-renter tenant base. Strengths: housing A+, health & safety A+, cost of living A; Watch: employment C-, crime F, amenities F.
- Charleston 01 (urban): math 48% / reading 53% proficiency, ranked #7 of 80 in SC (top 9%) — acceptable for families but not a draw, mixed tenant base, ~2y average lease.
- Zoned schools: Pinehurst Elementary (math 18% / reading 13%, grade F, #539 of 597 statewide, top 91%, 656 students, 100% FRL); Northwoods Middle (math 11% / reading 16%, grade F, #207 of 229 statewide, top 91%, 738 students, 100% FRL); Rb Stall High (math 49% / reading 63%, grade C, #126 of 196 statewide, top 65%, 1,952 students, 100% FRL) — zoned schools average 100% FRL vs 44% district-wide (56 pts higher); higher-poverty schools than district average — tighter screening recommended.
- Zoned-school proficiency averages 28% at this address vs 50% district-wide (-22 pts) — the specific schools serving this property underperform the Charleston 01 average; the district grade overstates school quality for this exact location.
- Market conditions: Rents rising (+1.4%/yr); 173 active listings in the ZIP; 17 comparable units currently listed for rent nearby; rentals leasing fast (median 5d on market — plan ~1-2 weeks tenant-placement turnaround); 4,156 units permitted in Charleston County in 2024 (857 in 5+ unit buildings).
- This rent runs 39% of the median local income ($50k/yr) — at the standard rent-burdened threshold; future hikes will face affordability resistance.
Forward outlook
- Local home prices are declining (-3.0%/yr); year-one equity from $1k of loan paydown is wiped out by about $6k of value loss. Plan a longer hold.
- Charleston County population projected at +44% by 2050 — long-run rental-demand tailwind backs the buy-and-hold thesis.
Negotiation context
- It's been on market 17 days — a 2% lower offer ($197k) is reasonable based on typical stale-listing flexibility.
- 7 sale attempts since 23y ago with the ask held roughly flat each time — persistent listings suggest the price (not the market) is what's stuck; bring a comps-based counter.
- Current owner paid $155k; 29% above their basis — modest negotiation headroom, anchor on the comps not their cost.
Risks & watch-outs
- Climate carrying-cost: severe wind risk, 99% chance of damaging wind over 30y; extreme-heat days projected 7→17/yr by 2055 (HVAC capex compounding) — expect insurance premiums to compound above CPI over the hold.
Questions for the listing agent
- Is there a deadline driving the sale (1031 exchange, divorce, estate, relocation)? That informs how much negotiation room exists.
- Crime grade is F in this area — have there been break-ins, vandalism, or insurance claims at this property in the last 3 years? What carrier currently insures it and at what premium?
- The area grade is low — what's the realistic commute time and amenity access for the typical tenant pool here? Any planned neighborhood developments (good or bad) we should know about?
- What's the average days-on-market for RENTAL listings here right now (not sales)? A rising rental-DOM trend means longer vacancies and softer asking-rent achievability than the comps imply.
- What's the recent tenant-quality profile in this submarket — average credit score on applications, eviction rate, late-payment / NSF rate, and stable-employment percentage? A property-management company in the area should have these aggregated.
- How much new for-sale + rental construction is in the pipeline within 1–3 miles? Heavy new supply typically softens prices + rents 12–24 months out; constrained supply supports both.
Investment metrics
- 1% rule
- 0.81% ✗
- Cap rate
- 6.36%
- Cash-on-cash
- 0.25%
- DSCR
- 1.01
- GRM
- 10.3
CMA / ARV
- ARV (on-the-fly)
- $209,520
- Comps found
- 1
Show comp detail 1 sale within ~0.75 mi
| Address | Dist | Beds/Ba | Sqft | Sold | Price | $/sf | Match |
|---|---|---|---|---|---|---|---|
| 2483 Realm St | 0.01mi | 2/1.5 | 1,080 (0%) | 20mo | $210,000 | $194 | 83 |
Match score weights: distance 35% · size 25% · config 20% · recency 20%. Top-matched comps best support the ARV.
Projected returns pro-forma
-3.0% appreciation · 1.37% rent growth · sell at horizon
- IRR
- -17.6%
- Equity multiple
- 0.39×
- Total profit
- $-34,294
- Equity at exit
- $29,806
- IRR
- -12.9%
- Equity multiple
- 0.30×
- Total profit
- $-39,447
- Equity at exit
- $17,284
Cash invested: $55,972 (down + closing). Projections, not guarantees.
Landlord ↔ Tenant lean methodology
- Overall (STATE)
- 90 Strongly Landlord-Friendly
- State South Carolina
- 90 Strongly Landlord-Friendly · R+6
- County
- — inherits STATE
- City
- — inherits STATE
ZIP-level market 29406
- Home prices YoY
- -6.7%
- Rents YoY
- 1.4%
- Active inventory
- 173
- Price-to-rent
- 10.3×
Monthly cashflow live
- Estimated rent
- $1,618 high interval (Pro) →
- Mortgage (P&I)
- −$1,048
- Tax from tax record
- −$135 /mo · $1,615/yr
- Insurance
- −$83
- HOA
- −$0
- Vacancy / Maint / Mgmt
- −$340
- Net cashflow
- $12
Break-even live
Sensitivity live
| Price | -10% $125 | -5% $68 | +0% $12 | +5% $-45 | +10% $-101 |
|---|---|---|---|---|---|
| Rent | -10% $-116 | -5% $-52 | +0% $12 | +5% $76 | +10% $140 |
| Rate | -1.0pp $113 | -0.5pp $63 | base $12 | +0.5pp $-40 | +1.0pp $-93 |
UW: 25.0% down · 7.5% · 30yr · 1.5% tax · 5.0% vac · 8.0% maint · 8.0% mgmt
Financing live
Cash to close
- Down payment
- $49,975
- Closing costs
- $5,997
- Reserves months
- —
- Total cash needed
- —
Loan-product check · same deal, 3 products live
Conventional
25% down · 7.5% · 30yr
- Down + closing
- —
- Monthly P&I
- —
- Monthly cashflow
- —
- DSCR
- —
- Eligible?
- —
Personal DTI + credit; lowest rate.
DSCR
20% down · 8.5% · 30yr
- Down + closing
- —
- Monthly P&I
- —
- Monthly cashflow
- —
- DSCR
- —
- Eligible?
- —
No personal income docs; deal must DSCR.
Hard money
10% down · 12.0% · 12mo
- Down + closing
- —
- Monthly P&I
- —
- Monthly cashflow
- —
- DSCR
- —
- Eligible?
- —
Short-term bridge; refi at stabilization.
Rent comps 17 comps
| Address | Beds | Baths | Sqft | Rent | $/sqft | DOM | Units | Dist |
|---|---|---|---|---|---|---|---|---|
| 2155 Morris Baker Blvd North Charleston, SC | 1.0–3.0 | 1.0–2.0 | 1029 | $1,844 | $1.79 | 4d | 22 | 0.38mi |
| 7131 Stall Rd Charleston, SC | 1.0–2.0 | 1.0 | 662 | $1,215 | $1.84 | 5d | 5 | 0.40mi |
| 2181 Dunlap St Charleston, SC | 1.0–2.0 | 1.0–2.0 | 920 | $1,795 | $1.95 | 5d | 12 | 0.44mi |
| 6951 S Kenwood Dr Charleston, SC | 2.0 | 1.0 | 850 | $1,600 | $1.88 | 25d | 1 | 0.60mi |
| 7940 Shadow Oak Dr Charleston, SC | 3.0 | 2.5 | 1287 | $1,895 | $1.47 | 16d | 1 | 1.02mi |
| 6935 Rivers Ave Charleston, SC | 2.0–3.0 | 2.0 | 875 | $1,431 | $1.64 | 5d | 1 | 1.06mi |
| 5000 Mabeline Rd Hanahan, SC | 2.0–3.0 | 1.5 | 1200 | $1,459 | $1.22 | 5d | 6 | 1.12mi |
| 7925 St Ives Rd North Charleston, SC | 1.0–2.0 | 1.0–2.0 | 914 | $1,689 | $1.85 | 5d | 10 | 1.15mi |
| 6880 Rivers Ave North Charleston, SC | 1.0–2.0 | 1.0–2.0 | 946 | $1,904 | $2.01 | 4d | 19 | 1.30mi |
| 8012 Thelen St North Charleston, SC | 2.0 | 1.5 | 1133 | $1,495 | $1.32 | 16d | 1 | 1.30mi |
| 2245 Greenridge Rd North Charleston, SC | 1.0–3.0 | 1.0–2.0 | 965 | $1,528 | $1.58 | 5d | 19 | 1.34mi |
| 7911 Angel Ct North Charleston, SC | 3.0 | 1.5 | 988 | $1,750 | $1.77 | 25d | 1 | 1.35mi |
| 2430 Woodstock Ave North Charleston, SC | 2.0 | 1.5 | 1100 | $1,350 | $1.23 | 5d | 1 | 1.35mi |
| 2422 Woodstock Ave North Charleston, SC | 2.0 | 1.5 | 1114 | $1,600 | $1.44 | 16d | 1 | 1.36mi |
| 7927 Saint Ives Rd Charleston, SC | 1.0–3.0 | 1.0–2.0 | 969 | $1,529 | $1.58 | 5d | 26 | 1.42mi |
| 3311 Mountainbrook Ave North Charleston, SC | 1.0–3.0 | 1.5 | 1204 | $1,499 | $1.25 | 5d | 12 | 1.44mi |
| 2225 Greenridge Rd North Charleston, SC | 1.0–2.0 | 1.0–2.0 | 817 | $1,579 | $1.93 | 5d | 14 | 1.44mi |
Listing history 11 events
-
2026-06-22days on market $199,900 Active 17 DOM
-
2026-06-18days on market $199,900 Active 14 DOM
-
2026-06-17days on market $199,900 Active 13 DOM
-
2026-06-16days on market $199,900 Active 12 DOM
-
2026-06-15days on market $199,900 Active 11 DOM
-
2026-06-10days on market $199,900 Active 6 DOM
-
2026-06-09days on market $199,900 Active 5 DOM
-
2026-06-08days on market $199,900 Active 4 DOM
-
2026-06-07days on market $199,900 Active 3 DOM
-
2026-06-05remarks 699-char remark
-
2026-06-05$199,900 Active 1 DOM
ⓘ Source: listings_history table (triggers on properties + properties_extension) + one-shot
backfill from property_details.listing_events for pre-trigger history.
Tax reassessment forecast SC · Resets to sale price
- Current annual tax
- $1,615 · $135/mo
- Projected year-2 tax
- $1,615 · $135/mo
- Expected delta
- $0/yr ($0/mo · 0.0%)
ⓘ Screening estimate from a state-policy table — verify with the county assessor before closing.
Climate risk First Street
- Flood 1/10 Low FEMA zone X (unshaded) · 0% chance over 30 yrs
- Wildfire 2/10 Low
- Heat 9/10 Extreme 7 d/yr ≥107°F today · 17 d/yr by 30 yrs out
- Wind 8/10 Severe 99% chance of damaging wind over 30 yrs
- Air quality 3/10 Moderate 3 unhealthy d/yr today · 3 by 30 yrs out
Nearby sold comps map
Loading sold comps map…
Walkable amenities ~0.75 mi
Loading nearby amenities…
Taxation est. · year 1
- Rental income
- $19,413
- − Mortgage interest
- −$11,198
- − Property taxes
- −$1,615
- − Insurance
- −$1,000
- − Repairs & maintenance
- −$1,553
- − Management
- −$1,553
- − Depreciation
- −$5,815
- Taxable loss
- −$3,320
- Est. tax savings @ 24.0%
- +$797
- After-tax cash flow
- $939/yr
For passive investors: Depreciation is non-cash, so a rental often shows a tax loss while cash-flowing — sheltering income. Rental losses are passive: they offset passive income freely, and up to $25,000/yr can offset ordinary (W-2) income if you actively participate and your MAGI is under $100k (phasing out to $0 by $150k); unused losses carry forward. On sale, claimed depreciation is recaptured at up to 25%, and gains may owe capital-gains tax (a 1031 exchange can defer both). Figures are a year-1 estimate at your 24.0% rate — not tax advice; consult a CPA.
Schools (NCES district)
- District
- Charleston 01
- NCES district ID
- 4501440
- Math proficiency
- 48% ▼ -2.00%
- Reading proficiency
- 53% ▬ 0.00%
- Median HH income
- $52,376
- Composite
- 43.41/100
- National rank
- #3018
- State rank
- #7 of 80 in SC
Livability — North Charleston
- Score
- 66/100
- State rank
- #122
- US rank
- #12222
Category grades
Schools grade is shown separately in the Schools card above.
Census & demographics
- Census place
- North Charleston, SC
- County
- Charleston County · 366,793 people
- City population
- 108,266
- Metro
- Charleston-North Charleston, SC
- Population (ZIP)
- 32,001
- Household income
- $49,815
- Rent vs Own
- Severe rent burden
- 2054.0
Population outlook (Charleston County) Hauer SSP2
- Today (2025)
- 480,562 people
- By 2030
- 525,921 · +9.4%
- By 2040
- 612,189 · +27.4%
- By 2050
- 691,627 · +43.9%
- By 2075
- 847,979 · +76.5%
- By 2100
- 926,482 · +92.8%
Race, ethnicity, and origin ACS 2023
- Neighborhood character
- Diverse neighborhood (Simpson 0.70)
- Race & ethnicity
- Black 40% White 32% Hispanic / Latino 19% Two or more races 9% Asian 3%
- Hispanic origin (detail)
- Mexican 10% Puerto Rican 1%
- Common ancestry
- Romanian 1% Italian 1% Lithuanian 1%
- Foreign-born
- 15% · Canada, Vietnam
- Languages at home
- 79% English-only · Spanish 17% Vietnamese 1% Tagalog/Filipino 1%
Political lean MEDSL · Charleston
- 2024 margin
- Lean D (+5.7) · D 51.9% · R 46.3% · Other 1.8%
- 2008→2024 swing
- -2.7pp toward R · 2008: 8.3pp · 2024: 5.7pp
- All cycles
- 2024: D+5.7 2020: D+12.9 2016: D+7.9 2012: D+2.4 2008: D+8.3
Not yet ingested
- Civics
- —
Market trends
- HPI YoY
- ▼ -27.09%
- Current HPI
- 374.9164
- Rent YoY
- ▲ 1.37%
- Metro
- Charleston-North Charleston, SC
- State GDP YoY
- ▲ 4.51%
- F500 in state
- 2
Industry mix (Fortune 500 HQ in SC)
| Industry | F500 HQs | Revenue |
|---|---|---|
| Packaging | 1 | $7B |
|
||
Price history
+7.6% since first listed22 events — show timeline
- 2026-06-03 Listed $199,900 Charleston Trident MLS
- 2022-08-31 Sold (MLS) $155,000 Charleston Trident MLS
- 2022-08-06 Contingent — Charleston Trident MLS
- 2022-08-01 Listed $155,000 Charleston Trident MLS
- 2019-07-19 Sold (Public Records) $87,000 Public Records
- 2019-06-28 Sold (MLS) $87,000 Charleston Trident MLS
- 2019-06-18 Contingent — Charleston Trident MLS
- 2019-05-13 Price Changed $89,000 Charleston Trident MLS
- 2019-05-06 Price Changed $89,900 Charleston Trident MLS
- 2019-04-27 Listed $89,000 Charleston Trident MLS
- 2018-12-07 Sold (Public Records) $80,000 Public Records
- 2018-12-03 Sold (MLS) $80,000 Charleston Trident MLS
- 2018-11-14 Listed $80,000 Charleston Trident MLS
- 2010-03-15 Sold (MLS) $26,900 Charleston Trident MLS
- 2010-02-12 Listed $26,900 Charleston Trident MLS
- 2004-06-02 Sold (Public Records) $54,500 Public Records
- 2004-05-29 Sold (MLS) $54,500 Charleston Trident MLS
- 2004-02-16 Listing Removed — Charleston Trident MLS
- 2004-01-25 Listed $57,500 Charleston Trident MLS
- 2003-11-25 Listed $59,900 Charleston Trident MLS
- 1996-05-24 Sold (Public Records) $436,707 Public Records
- 1992-10-02 Sold (Public Records) $185,795 Public Records
Property tax history
+13.7%/yrLatest (2022): $1,615 · +0.7% YoY. Source: county tax records.
Cash-flow waterfall
monthlySold comps — $/sqft
last 12 mo · ≤1 miLoading sold comps…